


In Australia, 61 % of adults are overweight and obese(1), placing them at high risk of chronic diseases(2). Energy intake is a critical component of energy balance and weight gain, and high consumption of energy-dense foods and beverages is associated with an increased risk of overweight and obesity(2). The provision of nutrition information at the point of sale can potentially assist consumers to recognise lower energy food items and healthier food choices(Reference Cowburn and Stockley3). A literature review of consumer understanding and use of food labels found that the relationship between calories (or kilojoules) and energy was poorly understood(Reference Cowburn and Stockley3); however, other studies have shown that the provision of energy information at the point of sale can influence some consumers, particularly women, in selecting lower energy food products(Reference Gerend4, Reference Girz, Polivy and Herman5).
The inclusion of energy information on food labels and restaurant menu boards has been proposed as a policy initiative to support consumers to make healthier food choices. Australian food labelling regulations require energy information to be displayed in kilojoules (kJ) while other countries declare energy as calories. In 2006, the Australian Food and Grocery Council, the peak food manufacturing body in Australia, introduced the Daily Intake Guide as a voluntary front-of-pack labelling system, which uses ‘thumbnails’ to show the percentage contribution that a serving of food/drink provides for up to seven key nutrients, including energy, based on dietary recommendations for a reference adult(6). A simplified version that lists energy alone has been used on some products(6). Calorie information is also included on many front-of-pack labelling schemes internationally, such as in the UK and the USA(7, 8). In January 2011, an Australian Government review recommended the mandatory display of energy content on the menu/menu boards in chain food service outlets and on vending machines(9). Subsequently, the New South Wales (NSW) Government introduced legislation requiring larger fast-food chains (i.e. those with twenty or more outlets in NSW or fifty or more nationally) to display the average energy content of standard food items, as well as the average adult daily recommended energy intake (8700 kJ), on menus(10).
While front-of-pack food labelling may be a potential strategy to assist consumers in selecting healthier food products(Reference Kelly, Hughes and Chapman11, Reference Sacks, Swinburn and Lawrence12), poor nutrition knowledge and nutrition literacy may reduce the ability of some consumers to interpret the nutrition information provided, particularly for non-interpretive systems, such as percentage daily intake and energy labelling(Reference Cowburn and Stockley3). Health literacy refers to individuals’ access to, understanding and use of information to make decisions relating to health(Reference Peerson and Saunders13). Applying this to the field of nutrition, ‘nutrition literacy’ can mean the extent to which people access, understand and use nutrition information. In this context, consumers’ nutrition literacy is critical in their interpretation of non-interpretative front-of-pack food labelling and menu labelling.
There is limited research on Australian consumers’ nutrition literacy generally, and their understanding of energy specifically. However, recent qualitative research found the term ‘high energy’ to be associated with positive health concepts, in contrast to ‘fats’ and ‘sugars’, which were associated with weight gain(Reference Carter, Mills and Phan14). These conflicting attitudes, and the fact that Australians are exposed to both terms ‘kilojoules’ and ‘calories’ in advertising and dietary advice, present some particular challenges in promoting nutrition literacy relating to energy.
With the imminent introduction of kilojoules and energy information on menus and in some front-of-pack labelling schemes(6), it is particularly important to understand the usefulness of this information and how consumers interpret and apply it in food purchasing. The present study used a mixed methods approach of both qualitative and quantitative surveys to explore consumers’ understanding of energy, kilojoules and calories and to determine how energy terms affect perceptions of the healthiness of products and consumers’ purchase intentions.
Methods
Qualitative interviews
A pilot study comprising individual face-to-face interviews with adults (≥18 years) who had the main or shared responsibility for grocery purchases for their household was conducted between August 2010 and February 2011. Interviews included open-ended exploratory questions on participants’ understanding of the terms ‘energy’, ‘calories’ and ‘kilojoules’ and the impact of energy labelling information on perceived healthiness and intention to purchase products. Qualitative responses are presented herein to supplement findings from the quantitative survey.
A market research company recruited participants (n 40) from a database of pre-existing contacts. Individuals who (themselves, or their close family or friends) were employed in the food or marketing industries, or who were nutritionists, were excluded from the sample as these groups were considered to have better nutrition knowledge than the general population. Interviews were conducted by trained interviewers.
Participants were asked what the term ‘high energy’ meant to them and whether it was ‘a good or a bad thing’. They were asked about situations when they looked for a product high or low in energy. Questions also assessed consumers’ understanding of the terms ‘kilojoules’ and ‘calories’, and if they would be likely to buy a product high/low in kilojoules or calories and their reasons. Interviews were audio-recorded and transcribed verbatim. Participants received a cash incentive ($AUD 40).
Thematic content analysis(Reference Braun and Clarke15) was used to analyse the responses to the open-ended questions. Key themes were identified independently by two of the authors (W.L.W., C.H.) and responses scored in relation to agreed codes. The key codes regarding energy terms were: (i) the nutrients mentioned or associated with the term; (ii) the purpose or role associated with the term; and (iii) whether participants were unsure or not confident in their answer.
The number of participant responses under each theme was identified as a fraction of the participants responding to that question. The number of participants responding to each question varied. Not all participants answered all questions and additional questions were included part way through the interview process.
Quantitative survey
A quantitative survey was undertaken with adults (≥18 years) who had main or shared responsibility for household grocery purchasing. Participants were recruited and interviewed at two shopping centres in metropolitan Sydney, Australia, in a high and a medium socio-economic area(16). Minimum age quotas were used to ensure a spread of ages. The same exclusion parameters as mentioned in the qualitative sample were used. The data collection was undertaken over three days during March 2011 by a market research company.
Shopper intercept surveys comprised a 7 min survey that had been piloted and refined in the prior qualitative testing. The questionnaire included mainly closed questions that asked the participant to imagine that they were doing their food shopping. Half the participants were initially asked whether they would purchase a product higher/lower in calories and the other half whether they would purchase a product higher/lower in kilojoules (random allocation). Participants were then asked, when choosing from the following food categories (i) breakfast cereal, (ii) muesli bar and (iii) a frozen meal (order of presentation rotated), whether they thought that the higher or lower energy product was healthier. The response categories were: (i) product higher in energy; (ii) product lower in energy; (iii) both the same/neither; or (iv) depends on the type of product. Participants were asked to explain their answer and responses were categorised according to pre-coded response lists, based on the prior qualitative research. To explore understanding of kilojoules and calories, participants were asked a true/false question ‘kilojoules and calories measure the same thing’; and if kilojoules measure (i) sugar content only; (ii) fat content only; or (iii) the energy content of food. Both studies were approved by the University of Sydney Human Research Ethics Committee.
Analysis
Data were analysed using the SPSS for Windows statistical software package version 15·0 (SPSS Inc., Chicago, IL, USA). Pearson's χ 2 tests were used to compare intention to purchase with perception of healthiness. Analyses also compared responses between participants living in households of higher and lower socio-economic status (SES), where higher SES households comprised those participants with a university qualification (regardless of income) and participants whose household income was $AUD 95 000 or more (regardless of education; n 226), and lower SES households comprised participants with a household income less than $AUD 95 000 or no tertiary qualification (n 162). These cut-off points were used to provide two comparatively sized samples. All P values were two sided.
Results
Participant characteristics
Qualitative interviews
The qualitative sample comprised forty adults, with twenty-six females, seventeen with a university qualification and a range of ages (ten aged 20–29 years, twelve aged 30–39 years, ten aged 40–41 years, seven aged 50–59 years and one over 60 years).
Quantitative survey
Table 1 shows the demographic details of the participants in the quantitative survey. The sample included 405 adults living in Sydney, with a greater proportion of women and persons born in Australia. One in three participants had no educational qualification beyond school. There was a relatively even distribution across the age range 20–65 years, with the largest segment aged 30–39 years.
Table 1 Characteristics of participants in the quantitative study: adults aged 18–79 years (n 405), Sydney, Australia
*Did not respond, n 1.
†Did not respond/refused, n 19.
‡Did not respond, n 1.
Impact of energy on perceived product healthiness and purchase intentions
Quantitative survey
Initially half the participants were asked whether they would buy a higher or lower calorie product and half were asked the same question using kilojoules. Of those asked about kilojoules, 86 % indicated they would purchase the lower kilojoule product and 88 % of those asked about calories indicated they would buy the lower calorie product.
Participants were asked a series of questions about their shopping choices and their perception of whether a product higher in energy or lower in energy was more healthy for the three selected product types. The relationship between energy and perceived healthiness varied by product. For breakfast cereals, 56 % of participants indicated the higher energy product was healthier, while 38 % indicated the breakfast cereal lower in energy was healthier (Fig. 1). Similar numbers of participants perceived the higher energy (46 %) and lower energy muesli bar (47 %) to be healthier. For frozen meals, 37 % of participants perceived the higher energy product to be healthier and 52 % thought the lower energy product was healthier.

Fig. 1 Responses to the question ‘If you were choosing between a higher energy product and a lower energy product which one would you think was the most healthy?’ ( $$$$, breakfast cereal;
  $$$$, muesli bar;
  $$$$, frozen meal) among adults aged 18–79 years (n 405), Sydney, Australia. Frequency of ‘don't know’ responses: breakfast cereal 3 %, muesli bar 5 %, frozen meal 8 %
Similar to perceptions of healthiness, intention to purchase the higher energy product varied by product type, with consumers more likely to purchase the higher energy product when choosing breakfast cereals (56 %) and muesli bars (46 %) but not for frozen meals (37 %). There was a strong correlation between perceived healthiness and intention to purchase for each food type (breakfast cereal  $$-->$<>\chi _{1}^{2} <$>
<!--$$ = 284, P < 0·001; muesli bar
$$-->$<>\chi _{1}^{2} <$>
<!--$$ = 284, P < 0·001; muesli bar  $$-->$<>\chi _{1}^{2} <$>
<!--$$ = 279, P < 0·001; frozen meal
$$-->$<>\chi _{1}^{2} <$>
<!--$$ = 279, P < 0·001; frozen meal  $$-->$<>\chi _{1}^{2} <$>
<!--$$ = 237, P < 0·001).
$$-->$<>\chi _{1}^{2} <$>
<!--$$ = 237, P < 0·001).
Comparisons by socio-economic status
The interpretations of the perceived healthiness of higher and lower energy products were significantly different between participants from higher and lower SES households. Those from the lower SES group were significantly more likely to perceive the higher energy breakfast cereal (64 % v. 50 %;  $$-->$<>\chi _{1}^{2} <$>
<!--$$ = 6·3, P < 0·05), the higher energy muesli bar (56 % v. 40 %;
$$-->$<>\chi _{1}^{2} <$>
<!--$$ = 6·3, P < 0·05), the higher energy muesli bar (56 % v. 40 %;  $$-->$<>\chi _{1}^{2} <$>
<!--$$ = 9·4, P < 0·05) and the higher energy frozen meal (43 % v. 32 %;
$$-->$<>\chi _{1}^{2} <$>
<!--$$ = 9·4, P < 0·05) and the higher energy frozen meal (43 % v. 32 %;  $$-->$<>\chi _{1}^{2} <$>
<!--$$ = 5·1, P < 0·05) as being healthier compared with the participants of higher SES.
$$-->$<>\chi _{1}^{2} <$>
<!--$$ = 5·1, P < 0·05) as being healthier compared with the participants of higher SES.
Those from the lower SES group were significantly more likely to express intention to purchase the higher energy breakfast cereal (70 % v. 53 %;  $$-->$<>\chi _{1}^{2} <$>
<!--$$ = 8·7, P = 0·003), the higher energy muesli bar (59 % v. 43 %;
$$-->$<>\chi _{1}^{2} <$>
<!--$$ = 8·7, P = 0·003), the higher energy muesli bar (59 % v. 43 %;  $$-->$<>\chi _{1}^{2} <$>
<!--$$ = 8·0, P = 0·005) and the higher energy frozen meal (48 % v. 35 %;
$$-->$<>\chi _{1}^{2} <$>
<!--$$ = 8·0, P = 0·005) and the higher energy frozen meal (48 % v. 35 %;  $$-->$<>\chi _{1}^{2} <$>
<!--$$ = 4·6, P = 0·03) compared with participants in the higher SES group.
$$-->$<>\chi _{1}^{2} <$>
<!--$$ = 4·6, P = 0·03) compared with participants in the higher SES group.
Reasons for selecting higher or lower energy product
Qualitative interviews
Only a small number of participants perceived a high energy food as something high in calories (6/40) or kilojoules (6/40). More commonly, participants associated the term ‘high energy’ with foods high in sugar (21/40) or, to a lesser extent, carbohydrate (6/40). While a few mentioned that high energy foods would be high in fat (3/40), an equivalent number specifically mentioned that it did not include fat (3/40):
I would assume it has a lot of sugar in it, not necessarily fat but sugar (female in her twenties).
High energy foods were often (9/40) described as something to ‘keep you going’, ‘sustain you through the day’, ‘decrease tiredness’ or simply ‘give you energy’. Equally frequent (8/40) was reference to ‘give you a boost’ or a ‘quick buzz’. A few participants talked about the concept of glycaemic index (4/40) when asked about energy, although not all expressed confidence in their knowledge. A couple mentioned caffeine (2/40).
That means a good boost that you can sort of rely on to carry out the activities, like sporting activities (female in her sixties).
I guess that it can give you more energy, physically to do the things you want to do in your day. Hopefully you would feel less tired I guess (female in her forties).
Another theme was that energy was regarded as a ‘fuel’ (5/40) or something to ‘burn’ or ‘expend’ (4/40):
The food contains a high amount of energy or fuel for the body. It means that it would take more energy and action to burn it off or to utilise it (female in her thirties).
Some people openly stated they were unsure what ‘high energy’ meant in relation to a food (4/40), while some (3/40) indicated that they were sceptical about the term ‘energy’:
It's a slightly dubious marketing term, I'd say (male in his forties).
More people associated high energy with something positive (10/33) rather than negative (6/33). The reasons given for positive perceptions about energy included increased productivity, decreased tiredness and something to ‘pep you up’, and as necessary because of their level of physical activity:
I definitely automatically see high energy as a good thing. We're all so busy and need energy (female in her twenties).
It's a sudden boost which you do need sometimes to get you going. Sometimes if you feel tired after work, you can have one of those drinks and have the energy to go and do your exercise (female in her sixties).
However, more participants (15/33) said that whether it was a good or a bad thing was dependent on factors such as if you were watching your weight (6/33) or the type of food (10/33):
Bananas, even fruit, can be high in energy because they are very high in sugars (female in her twenties).
Although one-third of those who answered said they would not actively seek high energy products (8/24), those who would identified certain situations when this would be more likely to occur. Most commonly, those situations were linked to doing exercise or sport (10/24), or as a boost (5/24) or if they were working long hours (3/24):
In situations where you need an energy boost. For example hiking, or working for 24 hours (female in her forties).
Something to snack on at work, or prior to playing sport (male in his fifties).
Half of the participants indicated they were not likely to look for low energy products (12/24). Those who identified occasions when they would mentioned watching their weight (1/22), at the end of the day (2/22) or when not exercising (2/22):
Don't think I really would, it's not something I think about unless someone told me that looking for low energy stuff is good for you (female in her twenties).
I suppose at night time, when you're winding down I wouldn't have something high energy like a breakfast bar (female in her twenties).
Quantitative survey
The most common reason given by participants for purchasing the higher energy product was for sustained energy (breakfast cereal 63 %, muesli bar 58 %, frozen meal 53 %; Fig. 2). Approximately one-fifth of those stating they would be more likely to buy the higher energy product gave the reason as the perceived healthiness of the product. For breakfast cereals and muesli bars, those saying they would purchase the lower energy product gave the main reason as the expectation that the lower energy product would be lower in sugar (Fig. 3). For each product type, around a quarter reported they would buy the lower energy product ‘because it's healthier’ or ‘better for me’. The presence of fewer calories or kilojoules was the third most common reason for buying the lower energy product in each of the three food categories.
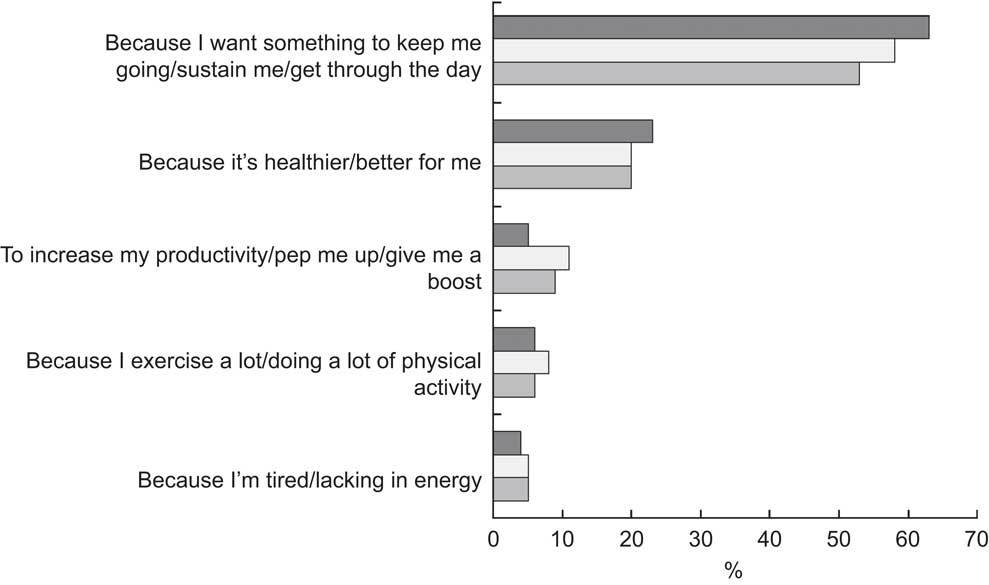
Fig. 2 Main reasons given in the quantitative survey for buying high energy products ( $$$$, breakfast cereal;
  $$$$, muesli bar;
  $$$$, frozen meal) among adults aged 18–79 years (n 405), Sydney, Australia; participants could provide multiple reasons. Number of participants who would buy high energy products: breakfast cereal n 242; muesli bar n 201; frozen meal n 149

Fig. 3 Main reasons given by participants in the quantitative survey for buying low energy products ( $$$$, breakfast cereal;
  $$$$, muesli bar;
  $$$$, frozen meal) among adults aged 18–79 years (n 405), Sydney, Australia; participants could provide multiple reasons (GI, glycaemic index). Number of participants who would buy low energy products: breakfast cereal n 137; muesli bar n 169; frozen meal n 189
Understanding of kilojoules and calories
Qualitative interviews
Understanding of kilojoules and calories was generally poor, with some participants admitting they could not answer the questions about what they understood by the term ‘kilojoules’ (4/31) and ‘calories’ (5/37). In addition, many people expressed a lack of confidence about their understanding of kilojoules (10/31) and calories (12/37):
I'm not as educated in kilojoules, I know how many calories I can eat a day (female in her thirties).
That's where I am wondering whether it is the same thing – whether kilojoules is just a modern thing. But I can't remember if there is a difference (male in his forties).
It's quite confusing. I've heard these terms but not taken much notice (female in her fifties).
Calories were often described as a measure of energy (15/37), but were also associated with being a component of food (7/37), with negative connotations regarding fat (6/37) and sugar (5/37) or in reference to watching weight (5/37):
If you consume more calories, you become more fat and it blocks your arteries (male in his forties).
When I think calories, I think sugar, right, so sugar is not very good for you (female in her twenties).
Kilojoules were most often described as contributing to an individual's energy needs (10/31) or the same as calories (13/31). Sugar was also mentioned in describing kilojoules (4/31), although no one mentioned fat or weight gain when describing kilojoules:
…kilojoules, I would think as being more related to a person's energy and how they are going to get through the day – like a food being better for them. Whereas, something that is high in calories just tastes better and is, you know, high in sugar and is not so good for them (female in her twenties).
Quantitative survey
Overall, 49 % responded that the statement about kilojoules and calories being measures of the same thing was false, while 40 % of participants answered correctly and 11 % were unsure. More participants from the higher SES group answered this correctly than those from the lower SES group (50 % v. 27 %;  $$-->$<>\chi _{1}^{2} <$>
<!--$$ = 13·2, P < 0·05).
$$-->$<>\chi _{1}^{2} <$>
<!--$$ = 13·2, P < 0·05).
In response to the prompted question ‘Do kilojoules measure sugar content only, fat content only, the energy content of the food or don't know?’, 65 % answered correctly (the energy content of the food), while 14 % indicated it measured the sugar content only, 9 % the fat content only and 10 % did not know. There was a significant difference in correct responses between lower and higher SES households ( $$-->$<>\chi _{1}^{2} <$>
<!--$$ = 11·7, P = 0·001; Fig. 4).
$$-->$<>\chi _{1}^{2} <$>
<!--$$ = 11·7, P = 0·001; Fig. 4).

Fig. 4 Comparison of responses to the question ‘And do kilojoules measure …?’, according to household socio-economic status (SES), among adults aged 18–79 years (n 405), Sydney, Australia ( $$$$, whole sample;
  $$$$, higher SES;
  $$$$, lower SES)
Frequency of using energy information
Quantitative survey
Overall 18 % of participants reported ‘always’ using the energy information listed on the pack, and 37 % reported that they ‘rarely’ or ‘never’ use this information. However, the claimed use of energy information did not equate with energy comprehension. Of those who reported they ‘always’ used information about energy or kilojoules, 32 % said that kilojoules measured the sugar content and 9 % said kilojoules measured the fat content of food.
Qualitative interviews
Participants indicated they most often used energy information when looking at new products or for more processed products. When asked how they would determine if a product was high in energy, almost half (15/34) mentioned they would look at the panel on the back of the product, and some would rely on claims about energy on the front of the pack (8/34). Other participants referred to advertising or promotions for high-energy drinks they had seen. Rather than referring to energy itself on the nutrition information panel, many participants referred to other nutrients including sugar and/or carbohydrates (8/34) and/or fat content (5/34).
Discussion
Although 40 % of participants reported referring to energy information always or often when shopping, there was confusion about the term ‘energy’. High energy products were often seen as healthy and even necessary for sustained energy, supporting findings in previous Australian research(Reference Carter, Mills and Phan14). Previous research has found during word association tasks that participants associated high energy with vitality and positive health concepts(Reference Carter, Mills and Phan14). High energy products were also associated with increasing productivity, providing a boost and necessary for those doing physical activity. The finding of differences in people's interpretation of energy according to their SES, with people with lower education or incomes more likely to associate higher energy with healthiness, is particularly important and indicates that poorer nutrition literacy may be a contributor to increased risk of being overweight and obese, supporting existing data on the differences in prevalence of overweight and obesity according to SES(Reference McLaren17, 18).
There is poor understanding of the terms ‘kilojoules’ and ‘calories’ among Australian shoppers, with many reporting that they are unsure of the definitions. Only 40 % knew that kilojoules and calories were measures of the same thing, with respondents in the interviews associating calories negatively with weight gain, sugar or fat, while kilojoules were more often referred to in terms of contributing to energy needs. Another Australian study also found that participants in focus groups lacked an understanding of kilojoules(Reference Carter, Mills and Phan14). In Australia, energy must be expressed on nutrition information panels on food packages as kilojoules(19); however, consumers are exposed to the term ‘calorie’ on fitness equipment and in fitness centres, on television programmes about weight loss and in popular media.
International consumer research has similarly found that consumers lack a basic understanding of calories(Reference van Kleef, van Trijp and Paeps20, 21). A study of ‘diet’ drinks found that some participants linked sweetness to calories and most thought of energy as different from calories(Reference Freeman and Booth22). In the USA, although many consumers expressed an interest in having access to calorie information on restaurant menus, only 40 % linked calorie imbalance to weight gain(23). Recent studies in the USA on the effect of menu labelling on the amount of calories purchased have reported mixed results(Reference Dumanovsky, Huang and Nonas24–Reference Tandon, Wright and Zhou26).
The present study contributes to the evidence that Australian consumers have insufficient knowledge to interpret energy information on food labels. In fact, the results may reflect a higher level of nutrition literacy than held by the general population, as there was an over-representation of more educated participants; 41 % of our participants had a university degree compared with 23 % in the Australian population(27). The over-representation of females reflects the social pattern where women are more likely to be responsible for grocery shopping. A limitation of the study was that no data were collected on the weight or health status or special dietary requirements of participants. Therefore it was not possible to determine if these factors influenced participants’ beliefs. The mixed methods approach is a strength as it allowed quantitative assessment of responses as well as qualitative exploration of the interpretations.
In Australia, there is widespread use of energy claims on packaging and in advertising, particularly in relation to drinks containing caffeine and in advertising for breakfast cereals. These messages and marketing claims may have influenced Australian consumers’ perceptions and interpretation of the term ‘energy’.
Australian consumers’ understanding of energy and kilojoule information is particularly important as industry front-of-pack food labelling initiatives and new quick service restaurant menu labelling laws in some states and territories will provide consumers with energy (kilojoule) content only(10, 28). The results of the present study indicate that these initiatives will require comprehensive and widely communicated education campaigns if they are to successfully guide consumers towards healthier food choices. Conversely, interpretive systems, such as Traffic Light labelling, may reduce the need for public education to improve nutrition literacy and may be more immediately understandable for all consumers(Reference Kelly, Hughes and Chapman11). The ability of consumers from lower socio-economic groups to understand energy information is particularly important as these groups have a greater burden of overweight and obesity and diet-related disease.
The present study shows that Australian consumers have poor understanding of energy and energy terms. It is critical to improve nutrition literacy regarding these concepts to empower consumers with the knowledge to make better choices when shopping.
Acknowledgements
Source of funding: This research was funded by the Cancer Council NSW with the support of Tour De Cure and NSW Department of Health, Australia. Conflicts of interest: The authors have no conflict of interest to declare. Authors’ contribution: All authors were involved in the study design. W.L.W. wrote the manuscript and W.L.W. and J.C. conducted the statistical analyses. All authors contributed to the interpretation of the results and approval of the final manuscript.


