


The Editor,
Journal of Glaciology
Sir,
Glacier melting contributes to sea-level rise that could submerge highly populated coastal lowlands, and also has climatological and hydrological implications for the populations who depend on the meltwater, hence the importance of glacier monitoring. At present, continuous conventional measurements spanning more than 20 years exist for only about 40 glaciers worldwide (Reference Dyurgerov and MeierDyurgerov and Meier, 1997). The only such glacier in China is Urumqi glacier No. 1 (UG1; 43°05′ N, 86°49′ E) at the source of the Uriimqi river, Tien Shan. Continuous and systematic measurements of mass balance, terminus position and areal extent commenced on UG1 in 1979. In addition, a hydrometeorological station (G1HS) (43º06′ N, 87º15′ E; 3693ma.s.l.) was established just 200 m from the glacier tongue. Temperature and precipitation observations at G1HS allow us to analyze the impact of climate change on this glacier. We report observations on this glacier, and analyze the causes of its recent behavior.
UG1 has shortened by about 90 m since 1980. Figure 1 presents the observed yearly terminus retreat rates over the past two decades. The retreat rate is clearly increasing. Linear regression through the data indicates a retreat acceleration of 0.073 m a-2 over the period 1980-2002. The cumulative retreat of the glacier reflects the trend in cumulative mass balance (Fig. 2) which is calculated based on more than 60 stake measurements extrapolated to the whole glacier area and updated every few years. This suggests the mass-balance variations are responsible for the accelerated retreat. The cumulative mass balance was -8747.5 mmw.e., equivalent to an ice volume loss of 1.73 × 10⁷ m3 over the period 1979/80 to 2001/02. About 65% of the total ice- volume loss occurred during 1990/91 to 2001/02, ~51 % in the last 6 years (1996/97 to 2001/02).

Fig. 1. Yearly variations in the terminus of UG1at the source of the Urumqi river during the past two decades.

Fig. 2. Comparison between the variations of cumulative mass balance (filled circles) and the cumulative length change (open circles) of UG1 during the past two decades.
Maps of UG1 have been made at different times over the past two decades (Reference YouYou, 1988; Reference Chen, Liu and JinChen and others, 1996; personal communication from Chen Jianming and others, 2004). These maps are useful for investigating the changes in glacier area. Figure 3 shows glacier area as a function of time, indicating UG1 lost 0.149 km2 over the period 1980−2001, a decrease of ~8%, with rapid shrinkage during 1992−94. The average shrinkage rate after 1992, -0.014 km2 a, is about seven times greater than before 1992, ~0.002 km2 a-1.

Fig. 3. Changes in area of UG1 during the past two decades. The line with filled circles is the glacier area; the step line is the area change.
The critical link between glaciers and climate is glacier mass balance (Reference Meier, Wright and FreyMeier, 1965). Mass balance in a balance year is predominantly controlled by climatic conditions. We therefore examine climatic factors (temperature and precipitation) observed at G1HS and the mass-balance values measured on UG1 to determine the major causes of the glacier variations. Table 1 shows correlation coefficients (CC) between annual mass balance and precipitation within different periods of the balance year. There is no significant correlation, which implies that precipitation is not a major influence on the behavior of UG1. However, the annual mass balance is correlated (significant at 1%) with summer mean air temperature (see Table 2), suggesting summer temperatures are a major cause of the variation in mass balance. Although precipitation increased, the mass balance of UG1 has become more negative with summer warming during the past two decades (Fig. 4). The summer warming trend is 0.48°C (10 a)-1 at G1HS, but only 0.37°C (10 a)-1 at Ürümqi station (43°47′ N, 87°37′ E; 919ma.s.l.) over the period 1980−2000. Many studies have shown that the magnitude of change in temperature increases with elevation (Reference Beniston and RebetezBeniston and Rebetez, 1996; Reference Aizen, Aizen, Melack and DozierAizen and others, 1997; Reference WangWang and others, 1999; Reference Liu and ChenLiu and Chen, 2000). Enhanced warming at high elevations impacts on the behavior of UG1 and other mountain glaciers.
Table 1. Correlation coefficients (calculated across the years) between annual mass balance of UG1 and precipitation measurements at G1HS during different months of the balance year (1979/1980 through 2001/2002)

Table 2. Correlation coefficients (calculated across theyears) between annual mass balance of UG1and air temperature measurements at G1HS during different months of the balanceyear (1979/1980 through 2001/2002)
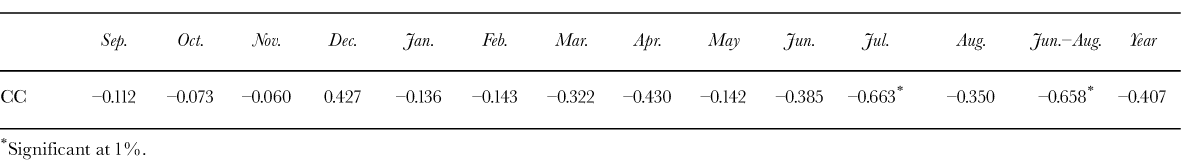

Fig. 4. Comparisons of the variations in air temperature (a) and precipitation (b) measured at G1HS with the variations in mass balance of UG1 (c) during the past two decades. The lines with filled circles are yearly data series; the dashed lines are linear trends. The significance level of the linear trend is 1% for air temperature, 10% for mass balance and >10% for precipitation (i.e. an increasing trend in precipitation is weak).
Recently, mountain glaciers in other regions have also experienced accelerated shrinkage. Qori Kalis, the largest outlet glacier of the Quelccaya ice cap, Peru, retreated at a rate three times greater during the period 1983-91, and five times greater during the period 1993-95, than between 1963 and 1983 (Reference ThompsonThompson, 2000). The volume changes of 67 glaciers in Alaska, U.S.A., have been studied using airborne laser altimetry, and it was found that the glacier thinning rate between the mid-1990s and 2000/01 (1.8 m a) was more than twice that between the mid-1950s and the mid-1990s (0.7 m a 1) (Reference Arendt, Echelmeyer, Harrison, Lingleand and ValentineArendt and others, 2002). Hielo Patagonico Norte and Sur (the northern and southern Patagonia ice fields), South America, lost ice at a rate of 16.7 ± 0.9 km3 a during the period 1968/1975−2000, and average ice-loss rates more than doubled to 41.9 ± 4.4 km3 a 1 in 1995-2000 (Reference Rignot, Rivera and CasassaRignot and others, 2003). The current worldwide shrinkage of glaciers should be considered a strong indication of global warming.
Acknowledgements
This research work is supported by the Chinese National Science Foundation (40121101), the Centuria Program and Innovation Research Projects (2003107, 2004102) of the CAREERI, Chinese Academy of Sciences, and Tien Shan Glaciological Station Foundation.
7 October 2004


