


Iodine is necessary for the production of thyroid hormones thyroxine and triiodothyronine that are needed for normal human growth and development(Reference Bougma, Aboud and Harding1). Data from 2011 indicated that about 41 million newborns per year worldwide were unprotected from iodine deficiency-induced consequences of brain damage(Reference Andersson, Karumbunathan and Zimmermann2). Globally, insufficient intake of iodine is still one of the most common micronutrient deficiencies(Reference Zimmermann3), despite it being one of the most preventable causes of impaired cognitive development in children(Reference Aboud, Bougma and Lemma4). In line with this, a recent cluster-randomised controlled trial from Ethiopia showed improved mental development among children aged 20–29 months after receiving iodised salt(Reference Bougma, Aboud and Lemma5). Notably, iodine deficiency among children <5 years is linked not only to poor mental development but also to stunted growth(Reference Bougma, Aboud and Harding1,Reference Millward6) . However, in their systematic review, Farebrother et al.(Reference Farebrother, Naude and Nicol7) questioned whether prenatal iodine repletion would increase infant growth, highlighting the need for further research. Yet, discussions on the aetiology of childhood stunting involving nutrition seldom include iodine deficiency(8). Contrary to many other nutrient deficiencies, iodine deficiency occurs in both developed and developing countries(8). Several countries have implemented the use of iodised salt as a cheap public health measure to prevent iodine deficiency disorders(Reference Aboud, Bougma and Lemma4). A UNICEF report from 2015 indicated that about 75 % of households worldwide use iodised salt(9); henceforth the number of iodine-deficient countries has decreased from 110 in 1993 to 15 in 2016(10). Moreover, a recent report from the Iodine Global Network database indicated that 129 out of 197 countries have mandatory legislation for the iodisation of at least household/table salt or salt for food processing(11).
With the use of urine iodide concentration (UIC, a marker of iodine intake), according to the WHO, the threshold for iodine deficiency among children is UIC < 100 μg/l (<0·79 μmol/l)(12). Using this threshold, Harika et al.(Reference Harika, Faber and Samuel13) reported large variations in the prevalence of iodine deficiency among children aged 0–19 years in Ethiopia (86 %), Nigeria (59 %) and South Africa (15 %).
In Uganda, >95 % of the households consume iodised salt(14). In 2002, a study on the severity of iodine deficiency disorders showed that about 30 % of the Ugandan general population had been diagnosed with goitre, indicating a severe public health problem(14). However, the current prevalence of iodine deficiency is unclear since few surveys provide accurate estimates(10). Specifically, Uganda’s districts bordering the Democratic Republic of Congo, with high mountainous terrains, deep valleys, volcanic soils and abundant rainfall, are endemic for iodine deficiency(Reference Ehrenkranz, Fualal and Ndizihiwe15). To illustrate this, Ehrenkranz et al.(Reference Ehrenkranz, Fualal and Ndizihiwe15) found that the prevalence of iodine deficiency was 21 and 23 % among newborns in the districts of Kabale and Kisoro, respectively.
Although several studies have investigated the adverse outcomes of iodine deficiency on child health(Reference Aboud, Bougma and Lemma4,Reference Abel, Caspersen and Meltzer16,Reference Zimmermann, Connolly and Bozo17) , few studies have examined the association of iodine status with development and growth, especially in Sub-Saharan Africa(Reference Andersson, Karumbunathan and Zimmermann2,Reference Osei, Baumgartner and Rothman18) . Moreover, health promotion interventions for children have usually overlooked iodine’s importance for child health outcomes(Reference Farebrother, Naude and Nicol19).
We performed a randomised trial to test the effect of a 6-month intervention, consisting of nutrition, stimulation and hygiene education among mothers of children aged 6–8 months in Uganda, on growth and development(Reference Muhoozi, Atukunda and Diep20). Whereas this education intervention did not improve child growth at the age of 20–24 months, cognitive, language and motor development improved. Given the possible importance of inter alia an adequate iodine intake on both child development outcomes and growth, we here used data from our follow-up of this trial. This presented a unique opportunity to study development and growth over time, that is, when the children were 20–24 and 36 months, and specifically to (i) evaluate the effects of the intervention on iodine intake (measured as urine iodide excretion) and (ii) perform a secondary analysis to search for associations between urine iodide excretion and child development as well as growth.
Methods
Study area and participants
This is a secondary analysis of a follow-up study of our open, cluster-randomised education intervention regarding nutrition, stimulation and hygiene among impoverished mothers of children aged 6–8 months in the Kisoro and Kabale districts of south-western Uganda; details can be found elsewhere(Reference Muhoozi, Atukunda and Diep20). We report the data according to CONSORT guidelines.
Randomisation and allocation to study groups
The randomisation procedure of the original trial is detailed elsewhere(Reference Muhoozi, Atukunda and Diep20). In brief, ten clusters were first obtained (i.e., sub-counties) from the two study districts by simple random sampling before they were randomised to either intervention (n 5) or control (n 5). Second, all the villages in each cluster were listed alphabetically and assigned numbers. Using computer-generated random numbers, villages whose assigned number matched with the random numbers were chosen. We accounted for an intra-cluster correlation (a measure of relatedness of clustered data) for a linear growth of 0·01(Reference Campbell, Donner and Klar21). We finally enrolled 511 mother–child pairs in the original study, and they were randomised to an intervention (n 263) or a control (n 248) group. The intervention group received the nutrition, hygiene and stimulation education in addition to routine healthcare, while the control group received only routine healthcare.
The child had to be 20–24 months of age during January–May 2015 in order to be included in the current follow-up study, since developmental milestones at this age may predict IQ at 5–6 years when children are about to start school(Reference Peyre, Charkaluk and Forhan22). Out of the 511 children in the original trial, 501 were 20–24 months at the time of this follow-up study. Among these 501 children, 155 were randomly selected to participate in the current study. The primary outcome in this follow-up study was cognitive development assessed with the Bayley Scales of Infant and Toddler Development–III (BSID-III) at 36 months. To detect a clinically relevant difference between the two study groups in the BSID-III cognitive composite score at 36 months of 0·5 sd (corresponding to 7·5 points) with a power of 0·8 and α of 0·05, sixty-three children per group were required. To account for dropouts, a total of 155 children were included. Among these 155 children, we randomly selected seventy-seven from the intervention group and seventy-eight from the control group.
Data were collected when the children were 20–24 and 36 months. The data collection teams were masked to group allocation and never interacted with the team that delivered the education intervention in the original trial.
Delivery and content of education intervention in the original trial
The education intervention lasted 6 months starting when the children were between 6 and 8 months of age and has been described elsewhere(Reference Muhoozi, Atukunda and Diep20). Mothers in the intervention group were periodically followed and reminded of the intervention activities. Following the end of intervention period, eight booster education sessions were conducted after every 3 months until the children were 36 months. The intervention education teams emphasised nutrition, child stimulation and hygiene in these booster sessions.
Briefly, education intervention was delivered to groups of mothers by a team of nutrition educators (bachelor education in nutrition) following a nutrition education curriculum based on the ten guiding principles of complementary feeding(23). The nutrition educators demonstrated breastfeeding practices and cookery. The mothers were advised: to start complementary feeding to their children with nutrient-rich foods while breastfeeding continued; to increase the number of feeds to 3–4 times a day; and to provide nutritious snacks between main meals. The mothers were also encouraged to practice responsive feeding and allow the children to feed themselves. The importance of oral hygiene and sanitation was given special emphasis.
Mothers together with the intervention team engaged in specific play activities and toys that could be useful in developing each of the development domains (cognitive, language and motor). The stimulation intervention was based on social-cognitive learning theory, emphasising the benefits of stimulation practices(Reference Bandura24). Mothers in the intervention group also met at monthly intervals to practice what they had learnt, thereby empowering them and ensuring compliance to the intervention(Reference Muhoozi, Atukunda and Diep20).
Collection of development and growth data
We have detailed our data collection procedures for child development and anthropometric measurements(Reference Muhoozi, Atukunda and Diep20). In case of child illness, data collection was postponed. Three assistants with a bachelor degree in psychology performed child development assessments, while two with a bachelor degree in nutrition collected anthropometric data. Assessments were administered in the local language and conducted in hired rooms in the villages without distractions to minimise interruptions. To promote reliability, child development assessments were administered first, followed by anthropometric measurements, and then urine sampling. BSID-III and the Ages and Stages Questionnaire (ASQ) were used. BSID-III is known to be the most comprehensive child development measure for children up to 3·5 years and has been adapted in similar settings(Reference Singla, Kumbakumba and Aboud25). Unfamiliar items in the BSID-III stimulus and picture booklets were replaced with familiar objects in the Ugandan context; for example, apples were replaced with tomatoes, and a vacuum cleaner was replaced with a mop. Replacement items were chosen based on their size, colour and shape to maintain functional equivalence with the original stimuli. ASQ is a parent/caregiver-completed screening scale with excellent psychometric properties, which capture and establish a wide range of adaptive behaviours, and has been previously used in similar settings(Reference Hornman, Kerstjens and de Winter26). For mothers who could not read the translated ASQ tool in the local language, the assessments were conducted together with our blinded data collection team. This team would read ASQ questions to the mothers and then they would score the results together. Notably, few women could not read the local language; we registered only five (3 %) mothers out of 155. Both tools were used because ASQ assesses the social-emotional abilities of the child, which were not included in our BSID-III. In addition, ASQ is used to evaluate a range of adaptive behaviours not obtained with BSID-III and which the child may not readily perform during testing. Inter-observation agreement between the teams was good, indicated by an intra-class correlation coefficient of 0·75 (P < 0·001) for BSID-III and 0·79 (P < 0·001) for ASQ.
Nutritional status was evaluated using weight and length following standard procedures and calibrations recommended by WHO(27). Weight (to the nearest 0·1 kg) was measured with a Seca scale model 881, whereas height (recumbent at age 20–24 and standing at age 36 months) was measured (to the nearest 0·1 cm) with a length board/stadiometer (Seca). The date of birth was obtained from the child’s health card. These anthropometric data were converted to z-scores for height-for-age (HAZ), weight-for-age (WAZ), weight-for-height (WHZ), head circumference and mid-upper arm circumference using the WHO Anthro (version 3.2.2) software(28). Undernutrition (stunting, underweight and wasting) was defined as a z-score <–2 sd from the median of the WHO reference standards for HAZ (stunting), WAZ (underweight) or WHZ (wasting), respectively(28).
Urine iodide and creatinine concentrations
We collected 155 and 148 samples of morning spot urine (volumes ranged from 2·5 to 4 ml) at 20–24 and 36 months, respectively. These samples were collected by a graduate student of laboratory technology using small containers and were transferred to tubes and kept at 4 ºC for no more than 24 h before being frozen at –20°C. They were then shipped on dry ice to Oslo University Hospital for analysis at the Department of Medical Biochemistry. We measured the concentration of anion (oxidised form of iodine), which is iodide. Briefly, urine iodide was analysed by a colorimetric method based on ammonium persulfate digestion prior to the Sandell–Kolthoff reaction, as described by Ohashi et al.(Reference Ohashi, Yamaki and Pandav29) and with an analytical CV of 6 % at 0·9 µmol/l.
Creatinine in urine was measured with enzymatic colorimetry using Cobas 6000 (Roche; CV 3 %). Urine was collected as spot urine samples, which were passed out when the children’s bladders were full. It was not feasible to collect diurnal urine samples. UIC was corrected for differences in water intake and, hence, urine dilution and concentration by calculating the individual urine iodide/creatinine ratio (ICR), which was used as a measure of iodine status in addition to UIC(Reference Bath, Furmidge-Owen and Redman30).
Measurements of iodine concentration in drinking water
To determine the concentration of iodine in drinking water, twenty randomly selected samples (ten from intervention villages and ten from control villages) were collected from the following sources of water: protected springs (n 4), unprotected springs (n 4), free-flowing springs (n 3), ponds (n 2), gravity (i.e., tap water, n 3) and swamp water (n 4). Iodine concentrations were analysed by Vestfold Lab Ltd. using the ISO 17294-2 method (level of detection 0·5 µg/l). Iodine was extracted by an aqueous solution of tetramethyl-ammonium hydroxide (TMAH; 0·2–1·0 g sample in 1 ml TMAH and 5 ml H2O). Extraction was carried out at a temperature of 90°C for 3 h. After cooling, the sample was diluted, the liquid phase was separated and prepared for measurement by ICP-MS (after the addition of an internal standard).
Statistical analyses
Values are reported as mean (95 % CI), or median with IQR, as appropriate. Differences between the study groups in concentrations of urine compounds were tested by Mann–Whitney U tests for each time-point since the data was not normally distributed. For the secondary analyses, we used mixed models to investigate the effect of urine iodide on growth and development outcomes in the intervention and control groups separately. An individual child was set as a random identifier; time and ICR/UIC as fixed variables. We adjusted for baseline values (obtained when the children were 6–8 months) of the outcomes of interest. To investigate whether the effect of urine iodide on different outcomes changed between 20–24 and 36 months, we included an interaction term ‘time × UIC’ and ‘time × ICR’. The association of iodine with child development and growth was expressed as a regression coefficient with 95 % CI and its corresponding P-value. The analyses were performed with Stata/se 14 (StataCorp. 2015) and IBM SPSS Statistics, version 22.0 (IBM Corp.).
Results
Inclusion and characteristics of participants in the follow-up study
Figure 1 shows the inclusion criteria for both the original trial cohort and the follow-up study cohort. The characteristics of the original trial cohort and the follow-up study cohort are shown in Table 1. Anthropometry and BSID-III scores obtained when the children were 20–24 months are shown in Table 2. The corresponding data obtained when the children were 36 months have recently been reported(Reference Jooste, Weight and Kriek32). The intervention group in the follow-up study cohort had significantly fewer cases of stunting than the controls when they were 20–24 months. Moreover, the intervention groups in both the original trial cohort and the follow-up study cohort had significantly higher BSID-III scores at 20–24 months.
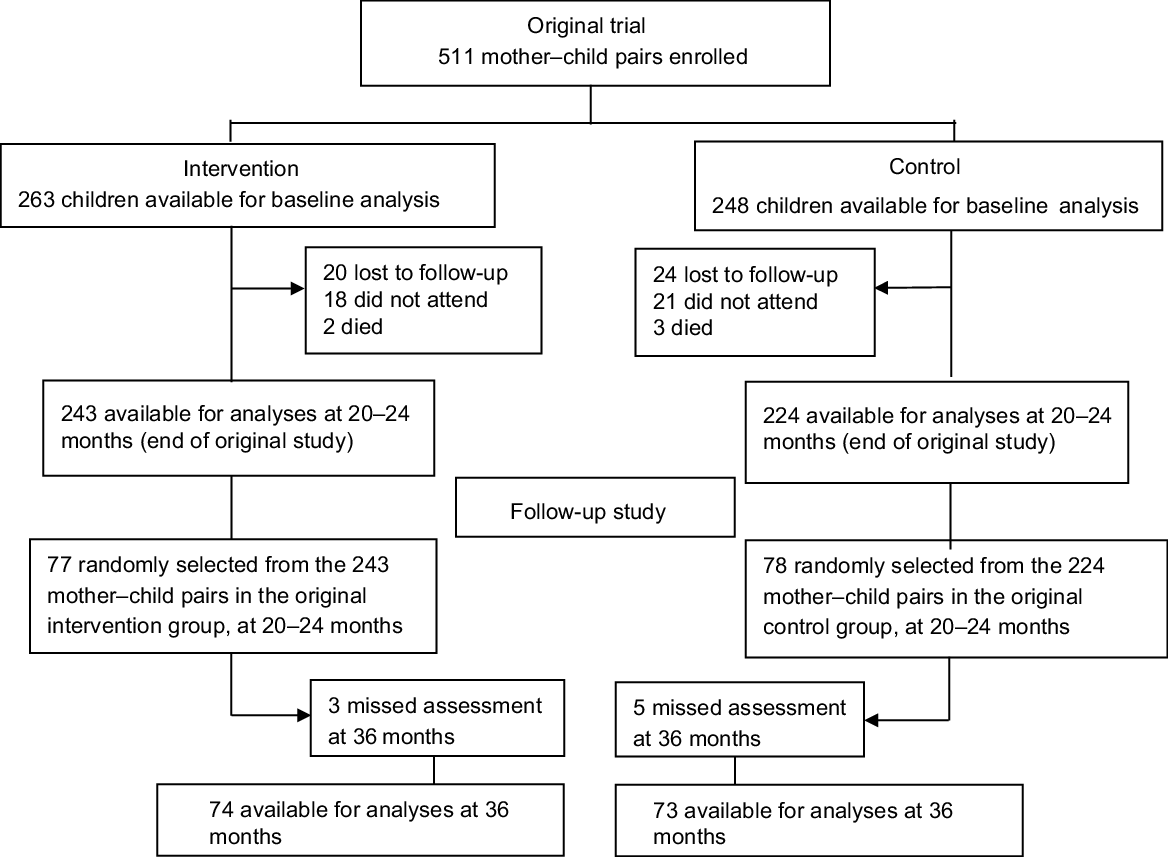
Fig. 1 Flowchart of inclusion process
Table 1 Population characteristics of the original trial cohort and the follow-up study cohort

* Poverty score card(Reference Schreiner46).
Table 2 Anthropometry and Bayley Scales of Infant and Toddler Development–III (BSID-III) scores for the original trial cohort and the follow-up study cohort

* Variation in n is due to missing data.
† Based on z-score values < 2 sd of the median of reference population.
‡ Significant differences between the intervention and control groups.
Urine iodide concentrations at 20–24 and 36 months
According to the criteria proposed by Andersson et al.(Reference Andersson, Karumbunathan and Zimmermann2), adequate UIC for small children ranges from 100 to 199 µg/l (0·79–1·60 µmol/l). Median UIC for both study groups at 20–24 and 36 months were within this range (Table 3). At 20–24 months, 20·8 and 21·8 % of children in the intervention and control groups, respectively, had a UIC <100 µg/l (0·79 µmol/l), whereas 35·1 and 52·6 %, respectively, had a UIC >200 µg/l (1·60 µmol/l). The corresponding values at 36 months were 26·0 and 31·6 % with a UIC <100 µg/l (0·79 µmol/l), and 40·3 and 52·6 % with a UIC >200 µg/l (1·60 µmol/l) in the intervention and control groups, respectively. No child had a severe iodine deficiency defined as UIC < 20 µg/l (0·16 µmol/l) at either time-point.
Table 3 Urine iodide concentration (UIC) and iodide/creatinine ratio (ICR) of the follow-up study groups

* Variation in n is due to some children not completing all the tests.
† 1 µmol/l of UIC corresponds to 127 µg/l, whereas 1 mg/dl of creatinine corresponds to 88·4 µmol/l.
** P-value for the difference between study groups at each time-point.
ICR was nearly twice as high in the intervention compared with the control group at 20–24 months (P = 0·03), whereas no significant difference was found at 36 months (Table 3). We did not detect any significant differences in UIC, neither between the two study groups nor between the two time-points of assessment (Table 3).
Associations between iodine status and child’s development outcomes
In both the original trial and the follow-up study, we found that the intervention led to better developmental outcomes. We here show that the intervention group had higher ICR at 20–24 months compared with the controls. Therefore, we next examined whether the ICR was associated with any of the development outcomes in the two study groups. Table 4 shows that ICR was positively associated with BSID-III cognitive scores at 20–24 months in the intervention group, but not with any other developmental outcome in either the intervention or control group when adjusting for baseline values. None of the ASQ scores were significantly associated with ICR either at 20–24 or 36 months in the two study groups except that ICR was negatively associated with ASQ gross motor score (P = 0·020) among the controls at 20–24 months (Table 4). The associations of ICR on BSID-III and ASQ development outcomes did not differ between the two time-points (i.e., P > 0·05 for the interaction term).
Table 4 Associations between urine iodide/creatinine ratio (ICR) and child developmental scores of the two study groups

* Variation in n is due to incomplete data.
† Values are regression coefficients (R) adjusted for baseline scores.
*** Mixed-effects linear regression P-values of the association between ICR and BSID-III/ASQ scores.
# P-value for the difference between two time-points’ regression coefficients.
UIC was positively associated with BSID language development scores at 20–24 months in the control group, but negatively associated at 36 months (Table 5). Thus, we found a significant interaction effect between time and UIC on BSID language development in the control group. Furthermore, UIC was positively associated with ASQ fine motor scores at 36 months in the intervention group, but negatively associated among the controls.
Table 5 Associations between urine iodide concentration (UIC) and child developmental scores of the two study groups
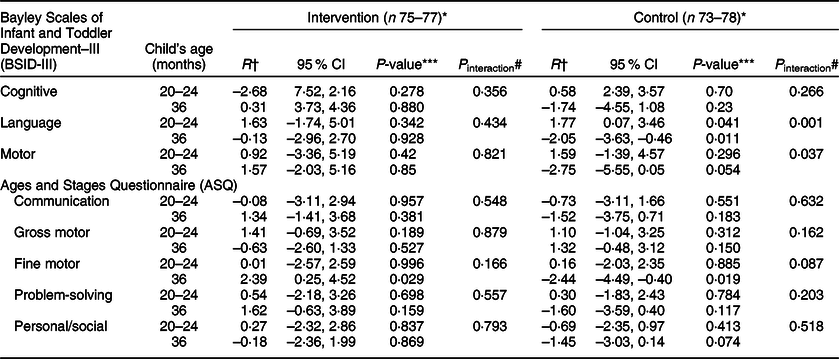
* Variation in n is due to incomplete data.
† Values are regression coefficients (R) adjusted for baseline scores.
*** Mixed-effects linear regression P-values of the association between UIC and BSID-III/ASQ scores.
# P-value for the difference between two time-points’ regression coefficients.
Associations between iodine status and growth outcomes
None of the anthropometrical markers of growth was associated (P > 0·05) with ICR at the two time-points (Table 6). However, a significant interaction effect of ICR and time for head circumference z-score was found in the intervention group. Moreover, we found no significant associations between UIC and growth outcomes at 20–24 and/or at 36 months, except that at 20–24 months the z-scores for head circumference (P = 0·006) and weight-for-height (P = 0·047) were negatively associated with UIC in the control group (Table 7). Furthermore, a significant interaction effect was evident for UIC and time on z-scores for head circumference (P = 0·033).
Table 6 Associations between urine iodide/creatinine ratio (ICR) and child growth z-scores of the two study groups

* Variation in n is due to incomplete data.
† Values are regression coefficients (R) adjusted for baseline scores.
*** Mixed-effects linear regression P-values of the association between ICR and growth scores.
# P-value for the difference between two time points’ regression coefficients.
Table 7 Associations between urine iodide concentration (UIC) and child growth z-scores of the two study groups

* Variation in n is due to incomplete data.
† Values are regression coefficients (R) adjusted for baseline scores.
*** Mixed-effects linear regression P-values of the association between UIC and growth scores.
# P-value for the difference between two time-points’ regression coefficients.
Iodine concentration in drinking water
Since drinking water can be an important iodine source(Reference Jooste, Weight and Kriek32,Reference Barikmo, Henjum and Dahl33) , we measured iodine concentrations in sources of drinking water from randomly selected ten intervention and ten control villages. The median (IQR) iodine concentrations were 17·5 (3·0–28·8) and 11·0 (2·5–30·1) µg/l for the intervention and control sources (P = 0·78), respectively. Hence, children in both study groups apparently received similar iodine content from drinking water.
Discussion
To our knowledge, the current study is apparently the first to focus on iodine status and its associations with child development and growth outcomes longitudinally in a rural setting and conducted in a low-income country.
The majority of children in the current cohort had sufficient iodine intake (i.e., UIC > 100 µg/l) both at 20–24 and 36 months of age even without specific iodine supplements. We also found that the median UIC in both study groups were within the recommended range as proposed by Andersson et al.(Reference Andersson, Karumbunathan and Zimmermann2). This could be attributed to the Ugandan policy on the levels of iodine fortification of salt (95 % Ugandan households consuming iodised table salt)(14). However, we found that about one-fifth of children in both study groups had low UIC at 20–24 months, and this fraction increased to about one-fourth and one-third in the intervention and control groups, respectively, after 1 year (at 36 months). Moreover, we found that the median ICR among intervention children was higher compared with the control group at 20–24 months, possibly indicating higher iodine consumption among children in the intervention group. In contrast, we did not detect any significant difference in median ICR at 36 months. Collectively, our data indicate that the intervention may have led to higher iodine consumption when the children reached the age of 20–24 months, but over time, the consumption possibly declined.
Interestingly, in our separate analyses of data from the two study groups, we found a positive association between ICR and BSID-III cognitive score in the intervention group at 20–24 months, and a negative association between ICR and ASQ gross motor score among the controls aged 20–24 months. Bougma et al. concluded in their systematic review that iodine deficiency has a substantial impact on mental development(Reference Bougma, Aboud and Harding1). However, similar to our results, Bell et al.(Reference Bell, Ross and Goodman34) in their systematic review also identified inconsistencies in the relationship between iodine and child development using global assessments. The aetiology behind a negative association between ICR and gross motor development at 20–24 months in the control group is unknown and may be due to chance. We do not know why the association for BSID-III language and motor scores was not positively associated with ICR as opposed to the cognitive scores in the intervention group at 20–24 months. Possibly, cognition has different development pathways compared with language and motor skills at an early age(Reference Markhus, Dahl and Moe35). The lack of significant associations between iodine markers and outcomes at 36 months is consistent with that from other studies involving children, indicating that the main effects of iodine on development may be restricted to children aged ≤3 years(Reference Aboud, Bougma and Lemma4,Reference Pereira, Valentini and Saccani36,Reference Robinson, Crozier and Miles37) . Whereas Robinson et al. found no associations between ICR and executive function outcomes(Reference Robinson, Crozier and Miles37), the Ethiopian study focusing on the use of iodised salt reported similar findings to ours on the association of urine iodide and BSID-III cognitive outcomes(Reference Bougma, Aboud and Lemma5).
We detected no significant association between ICR and the anthropometrical markers of child growth (HAZ, WAZ, WHZ, head circumference and mid-upper arm circumference) at 20–24-month and 36-month assessments. Our findings disagree with those obtained among Albanian and Moroccan children whose HAZ and WAZ increased after iodine supplementation(Reference Zimmermann, Connolly and Bozo17). Possibly this difference could be related to the fact that children in the current study were not supplemented with iodine. Notably, in the current study, children were using iodised table salt as part of Uganda’s iodisation programme. However, our findings are comparable with studies from South Africa and Mexico that investigated the effects of increased iodine intake, which reported no effect on child growth outcomes(Reference Van Stuijvenberg, Kvalsvig and Faber38,Reference Rivera, Gonzalez-Cossio and Flores39) . These latter studies included micronutrient supplements in their interventions. In contrast, we only provided an education intervention to mothers; no foods or supplements were provided at any time. Supporting our findings, a recent systematic review reported no clear evidence on the association between UIC and physical development; their findings rather identified likely increases in urinary iodine concentration(Reference Santos, Christoforou and Trie40).
We did not detect any significant difference in iodine content in the drinking water obtained from both intervention and control villages. Our results of the median range of water iodine concentrations are in line with those reported from, for example, Denmark(Reference Pedersen, Laurberg and Nohr41), Austria, Spain(42), USA(43), and Australia and New Zealand(44). Notably, WHO’s recommended values for iodine in drinking water are not yet defined(45).
Several years of follow-up and including iodine measurements in both urine and drinking water samples constitute major strengths of the current study. We also adjusted for any effects of dilution or concentration of spot morning urine samples by reporting urine ICR. Moreover, since urine creatinine concentrations were similar between the study groups, there is no reason to believe that nitrogen intake (and thus protein intake) was different between the intervention and control groups. A major limitation of the current study was the lack of data on actual intake of iodine among children, neither from foods nor from drinking water as well as household table salt, as this was not included in the design of the original trial. For the same reason, we also lack data on baseline urine iodine concentrations when the children were recruited to the original trial. Also, this was a follow-up study of an original trial where the intervention did not target iodine intake as the primary outcome. Furthermore, the size of follow-up sample was smaller than in the original trial. Information from the mothers, such as ASQ being a maternal report, could possibly be biased. Since many comparisons were performed, we cannot rule out that some statistical associations may have occurred by chance alone.
In conclusion, the intervention only led to a positive association between ICR and child development outcomes at 20–24 months (measured as BSID-III cognitive scores). ICR was not associated with any growth outcomes neither at 20–24 months nor at 36 months. Our data suggest that iodine is important for child’s mental development, at least for cognitive skills. Still, there is a need for further studies to establish the associations between iodine intake, child development and growth outcomes, especially in low-resource areas.
Acknowledgements
Acknowledgements: The authors thank the mothers and children in the Kisoro and Kabale districts whose valuable time enabled them to complete the current study, as well as all field staff for their dedicated work. The authors also thank Ms Anne-Marie Siebke Trøseid for keeping track of urine samples, and Ms Marit Daneid for performing urine iodide analysis. Financial support: This research was funded by the Throne Holst Foundation and the University of Oslo. The funders had no role in the design, analysis or writing of this article. Conflict of interest: None. Authorship: P.A. designed and performed the current study, collected and analysed the data and drafted the manuscript. G.K.M.M. designed and performed the current study, collected and analysed the data and read all manuscript drafts. L.M.D. and J.P.B. analysed the data and read all manuscript drafts. A.C.W and P.O.I. designed and supervised the current study, interpreted the data and read all manuscript drafts, and they share last authorship. All authors read and approved the final manuscript. Ethics of human subject participation: The current study was conducted according to the guidelines laid down in the Declaration of Helsinki, and all procedures involving research study participants were approved by The AIDS Support Organisation Research Ethics Committee (no. TASOREC/06/15-UG-REC-009), the Uganda National Council for Science and Technology (no. UNCST HS 1809) as well as the Norwegian Regional Committee for Medical and Health Research Ethics (no. 2013/1833). All mothers gave signed or thumb-printed informed consent to participate, and could decline to be assessed at any time. The current study was registered with Clinical trials.gov ID: NCT02098031.


 Open access