Introduction
The Ross Ice Shelf is one of thc most studied regions of Antarctica with a comprehensive network of strain-rate, surface-velocity, mass-balance, 10m temperature and icethickness measurements made during the 1970sReference Bentley(Bentley, 1984)Until recently, however, it has remained beyond the latitudinal limit of satellite-altimeter missions. The launch of ERS-I in July 1991 has enabled us to map surface elevation with sub-meter precision up to a latitude ofS1.5° S, thus covering areas of inflow from Byrd Glacier and Ice Streams D and E, complementing the more thoroughly investigated Ice Streams A, Band C (e.g. Shabtaie andReference Shahraie and BentleyBentley, 1987).For example, the input mass flux from Ice Stream E is second only to Ice Stream Band represents about 20% of the total inflow (MacAyeal and Thomas, 1986; Shabtaie andReference Shahraie and BentleyBentley, 1987 )yet its grounding line is poorly known, and ice-thickness data are relatively sparse in this regionReference Bentley, Clough, Jezek and Shabtaic(Bentley and others, 1979)The altimeter data can, how'Cver, be used t9 provide information on both of these parameters (e.g.Reference Partington, Cudlip, Melntyre and HelePartington and others, 1987).
Ice thickness can be inverted to provide surface elevation (or vice versa), assuming that the mean ice and water densities are known and that the ice is in hydrostatic equilibrium. DiITerences between the altimeter- derived heights and those derived from the radioecho- sounding (RES) data indicate a failure of one or more of the assumptions. Possible causes inelude grounding, ice-density variations and a change in surface elevation in the 15years between measurements. mean ice density may vary due to differences in densification rate of the firn layer, thickening due to compression in flow or the freeze-on of marine ice.
Data analysis and reduction
Altimeter data
ERS-l altimeter data are distributed in two forms. The first, distributed as wave-form data, comprise a comprehensive data set with corrections, quality flags and wave forms at the full sampling rate of 20 Hz (335 m along-track). A complex ground-processing procedure, requiring the input of a number of auxiliary data sets, is used in producing the wave-form product and at present only limited amounts of these data arc available. The second type is known as the fast delivery (FD) data set and is a summary product, with a reduced spatial resolution of 6.7 km (1 Hz) along-track. No wave forms are included and a relatively limited range of other parameters is provided. This product requires minimal ground processing and is, therefore, available relatively soon after acquisition.
In this study, five 35 d repeat cycles of FD data were used, comprising approximately 100000 measurements of surface elevation over the ice shelf and surrounding region. These data were improved with the use of ESA precise orhits, which are available approximately 3–6 months after acquisition (ESA, 1992)They are calculated from a gravity model tailored to the ERS-l mission.
In the absence of wave forms, it is necessary to carry out careful filtering to remove erroneous data, and the procedures used to do this have been described elsewhereReference Bamber(Bamher, 1994a)After filtering, a DEM with 10km grid spacing was produced in a polar stereographic projection with its origin at the South Pole, and a standard parallel of 710 S. Slope corrections were applied by the re-location methodReference Brenner, Bindschadler, Thomas and Zwally(Brenner and others, 1983)using a procedure described elsewhereReference Bamber(Bamber, 1994a)The data coverage after filtering is indicated in Figure 1 and the resultant elevation map (with 2 m contours) is shown in Figure 2a.

Fig. 1 Coverage of altimeter-height measurements, after removal of poor data, for one of the .F'ie 35 d rejleats used.

Fig. 2. a of surface elevations, from radar altimetry for Ross Ice Shelf relatiue to the OSu91-A geoid. AIaximum elevation Plotted is 120m. The 2m contour interval used is equivalent to about 19m in ice thickness (ef. 20m contours in
Error sources
The errors in the satellite-altimeter estimate of elevation comprise two components:
Random errors The orbit error IS quoted as heing better than 50 em(ESA, 1992)however, it is likely to be worse than this in the Antarctic due to the paucity of tracking stations in the Southern Hemisphere. Atmospheric corrections for the fast-delivery data are coarse, predicted values. However, the error in using these is no more than 30 emReference Bamber(Cudlip and others, 1994)There are both random and systematic errors due to not recalculating the range estimate, a process known as retrackingReference MIartin, Zwally, Brenner and Bindschadler(Martin and others, 1983)which can only be carried out on 'Nave forms. The magnitude of these errors was assessed by calculating the mean and standard deviation of the rctracking correction obtained from a small data set of wave forms over the Ross Ice Shelf. A threshold-retracking technique Reference Bamber(Bamber, 1994b)was used and the mean correction was found to be -0.18 ± O.26m at the 95%confidence limit. No tide correction was applied and tides are ahout 1–2 m in magnitude (Williams and Robinson, 1980). Their effect, however, is averaged out hy the use of multiple orbits (≈2500)which have no temporal correlation with the tidal periods.
The combined random errors can be determined from a comparison of crossing points of descending and ascending orbits. The standard deviation of 4303 cross-overs for one of the 35 d repeats was 1.56m over the ice shelf and surrounding grounded ice regions. This figure was reduced to 0.94 m for the ice-shelf region only. If this is the random component of the height error on two measurements on the ice shelf, then combining five repeat tracks reduces it to 0.30 m for a single height estimate
There are two geographically correlated biases. The first is due to a spatially invariant orbit error that arises from a poor knowledge of the local gravity field Reference Tapley and Rosburuugh(Tapley and Rosborough, 1985)Based on a comparison between two geopotential models, the rms error in the orbit due to this source was estimated as 1.50m. The second bias is due to errors in the geopotential model used to convert from altimeter-derived heights relative to the ellipsoid to heights relative to the geoid. In this study, two of the most recent geopotential models were considered, the OSL91-A and 1GMI Reference Rapp, Wang and Padis(Rapp and others, 1991)They were compared with the available in situ measurements of mean sea level and with each other.
There are only nine locations where heights relative to mean sea level and the ellipsoid were determined accurately enough to compare with the models Reference Shahraie and Bentley(Shabtaie and Bentley, 1987)The requirement on repeatability of these height measurements was to <5 m, and this is therefore likely to represent the upper limit on their error.Bearing this in mind and taking into account that, in general, mean sea level is taken to be 1.5m below the geoid in the Antarctic Reference Jacobel and Bindschadler(personal communication from R. H. Rapp, 1993)the differences between the modelled and measured values for the OSL”91-Aand1GM1 models were 3.8 ± 2.8 m and _3.7 ± 3.1 m, respectively, where the errors are 10'. For the Ross Ice Shelf embayment, the two models agree to better than 1m up to 70° (the limit of 1GMl), and for this study we chose the OSU geoid as it is complete ro 360°, thus providing undulations on a 50 km wavelength.
The OSU model has been compared with GPS/ levelling data and with Geosat sea-surface topography, and the errors have been estimated to range from ± 0.26 m over the ocean to ± 2m over land areas with no surface gravity data Reference Rapp, Wang and Padis(Rapp and others, 1991)Although gravity data exist for the Ross Ice Shelf embayment, it seems unlikely that they were included in the terrestrial data used in either of the geoid models and the error in the geoid is, therefore, likely to be on the order of ± 2 m. This is about half the difference between the measured and modelled values, discussed earlier. It is possible, however, that part of the difference may be due to biases in the in situ data. It will be shown later that good agreement is obtained between the theoretically derived eq uation relating surface elevation to Ice thickness and the measured relationship using the OSU91-A model
Ice-thickness data
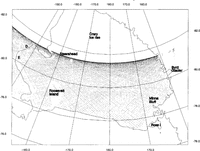
Two data sets were used in this investigation, the tabulated values of ice thickness for each Ross Ice Shelf Geophysical and Glaciological Survey (RIGGS) stationReference Greischar, Bentley and Whiting(Greisehar and others, 1992)and the Scott Polar Research Institute (SPRI) radio-echo soundings madeduring the 1970s Reference Drewry(Drewry, 1983)The RIGGS airborne surveys represent the most comprehensive data set over the Ross Icc Shelf, but were not available in digital form, and therefore could not be used for a quantitative analysis in this study. However, an ice-thickness map produced from those data Reference Bentley, Clough, Jezek and Shabtaic(Bentley and others, 1979)is reproduced here (Fig. 2b).
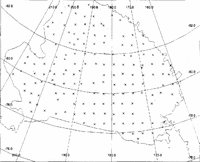
The location of SPRI flight lines and RIGGS stations is indicated in Figure 3. RIGGS ice thicknesses have an accuracy of about 10mReference Greischar, Bentley and Whiting(Greischar and others, 1992)Stations with a location accuracy of worse than 3 km were discarded The accuracy of the SPRI data was assessed from the crossing-point differences. These had a standard deviation of 14.8m with some difTerences in excess of 30 m. As can be seen from Figure 3, the SPRI airborne coverage is relatively sparse. The track spacing is about 50 km. Features running north-south with a wavelength less than approximately 100km will not be detected in the icc-thickness data used. The amount of short-wavelength information in this data set is less than that indicated by the ice-thickness map produced from the airborne RIGGS data (Fig. 2b). The SPRI data were used, however, as they allow a quantitative estimate of the surface-elevation differences to be made, as described in the next section.

Fig. 3 Location of RIGGS stations (crosses) and radioecho-sounding flight lines used in the analysis.
Comparison of ice thicknesses and surface elevations
Assuming that the noating ice is in hydrostatic equilibrium, the surface elevation can be derived from the following equation:

where
Z is ice thickness, Pi and Pw are the densities of ice and water, respectively, and Pi is the vertically averaged ice densityReference Shabtaic and Bentley(Shabtaie and Bentley, 1982)If it is also assumed that 8 is constant over the ice shelf, then Equation (1) is linear. The RIGGS station ice thicknesses were used alone in a linear regression againstsurface elevation, as these data have a higher accuracy compared to the airborne SPRI data and are less prone to interpretational problems. Points that were known to be grounded were not includedReference Greischar, Bentley and Whiting(Greischar and others, 1992) Bilinear interpolation was used to find the surface elevation at each RIGGS station from the gridded DEM A linear fit to the data by least squares, yielded: e =(0.104 ± 0.004)Z + 15.5 ± 2.6 (2) where the errors are exprcsscd at the 9.1% confidence limit and the correlation coefficient was 0.91. The fit to the data is shown in Figure 4 by the solid line. Equation (2) agrccs bctter with the relationship dcrivcd using a density for solid ice (917kgm-3) (Shabtaie and Bentley, 1987) than with one derived from thc measured density in an ice core at Little America Reference Greischar, Bentley and Whiting(Greischar and others, 1992)The mean ice-shelf density below the firn layer is surely greater than 910 kg m-3, the value assumed byReference Greischar, Bentley and WhitingGreischar and others (1992)However, it is possible that errors in the short-wavelength components of the geoid < length of the ice shelf), of a metre or two, could be responsible for part of the difference. Long-wavelength errors >ice-shelf dimension) would simply produce a bias which would affect only. For a 200 m thick and 700m thick column of ice, the differences in surface elevation between the equation derived byReference Shahraie and BentleyShabtaie and Bentley (1987)and that of Greischar and others (1992) are 1.2m and -3.05 m, respectively, which are within the random crror.
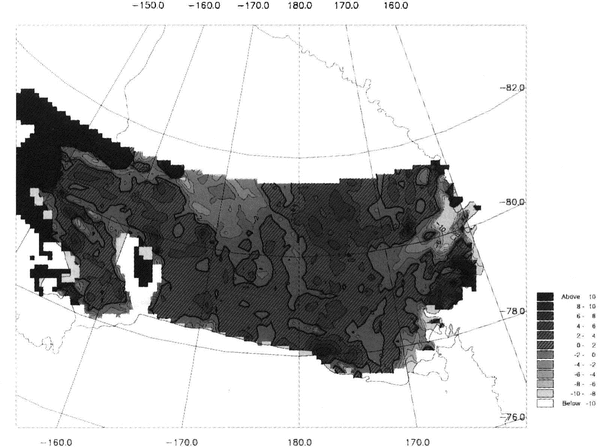
Using Equation (2), all the ice-thickness data were converted to surface elevations and interpolated into a second DEM with the same grid spacing and coordinatesystem as the ERS-I altimeter DEM. A diffcrence map was produced by subtracting the RES-derived elevations from the altimeter values. A grey-scale contour plot of the differences is shown in Figure 5. Positive differences are hatched. Combining the errors in ice thickness and surface elevation (Erandom + Ebias) gives an rms error of ±4 m for the differences in Figure 5.

Fig. 4 Least-squares fit to the elevations (interpolated from the ERS-l altimetry) versus the ice thicknessesfor the 103 RIGGS stations within the coverage of the satellite, excluding areas known to be grounded.
Discussion
The main features 1Il Figure 2a and b are in broad agreement. Along the eastern boundary of the ice shelf; the lobes of thick ice emanating from Ice Streams D andE (80° 81° S, 150° W) can be seen clearly flowing around Roosevelt Island (79° S, 163° W). In between them, just southeast of Roosevelt Island, is a low, thin spot that presumably is a "backwater" associatcd with flow around a stationary boundaryReference Massey(massey, 1979)The northern boundary of the ice rise informally callcd "Steershead" (81.5° S, 163° W), associated with the Steershead Crevasses, is well delineated on the elevation map and shows good accord in its appearance with the maps ofReference Shahraie and BentleyShabtaie and Bentley (1987) Reference JczekJezek (1980)and Bentley andReference Bentley and JezekJezek (1981)from a study of bottom crevasses, suggested that several other previously unrecognized ice rises exist. Two of them would be within our coverage: one just east of Steershead at 160°W and the other at about 80.3° S, _172°W. There is no sign of either.
Obvious features along the western margin of the ice shelf that are common to the two maps are the thick lobes in front of major outlet glaciers, most prominently Byrd Glacier (80.2° S, 1600 E) and Mulock Glacier (79 °S, ]62°E), and the thick ice dammed behind Minna Bluff (78.7° S, 1570 E). The downstream end of a lobe from Nimrod Glacier, most of which is south of the satellite coverage but which shows prominently on the icethickness map, appears at 81.5° S, 1650 E.
Some more subtlc features are also reproduced in the central ice shelf the ridge that trends southeastward from around 80° S, 177° \V and the low spots ncar 79° S, 178° E and 78° S, 1780 E. These low spots were attributed byReference JczekJezek (1980) to break-ofti; and downstream movement of thin ice formed in the lee of Crary Icc Risc (south of the satellite limit). The more northerly low spot, a known rift in the ice shelfReference Bentley, Clough, Jezek and Shabtaic(Bentley and others, 1979 fig. 3is sharp enough and closely cnough delineated on both maps that its displacement can be approximately measured. This displacement, about 12km, is in reasonable agreement with the measured ice speed (954ma-1 Reference Thomas, Macayeal, Eilers and GaylondThomas and others, 1984) and the time interval of 15 years(january 1977-January 1992)The "anomaly" at a grid position of 11.4° S, 0.50 E (Fig. 2b) is also prominent in the surface elevations and is, elearly, a real feature. It appears as a negative difference in Figure 5 because there were no SPRI RES data sufficiently close to it and, consequently, it was not resolved with the data used.
In the west-central part of the ice shelf there is a significant disagreement between the maps. The surface elevations show no sign of the striking ridge trough system shown on the ice-thickness map running parallel to flow across much of the ice shelf between 180° E and the Byrd Glacier flow bulge. We now believe that these ridges and troughs may not represent real variations in ice thickness but rather echoes from a reflector within the ice a few tens of metres above its baseReference Bentley(Bentley, 1981)These internal echoes are stronger than the basal echocs; both can be seen on the high-gain SPRI radio-echograms but only one echo appears on the RIGGS records that were used by Reference Bentley, Clough, Jezek and ShabtaicBentley and others (1979)to construct their map. vVesuspect, therefore, that the bands of indicated thinner ice on the map really represent bands of ice, stretched out along flow, that contain the internal reflector. We note also that the western part of the ice shelf displays pronounced bands of differing basal characteristics revealed by radio-echo sounding and attributed variously to bottom melting and freezingReference neal(Neal, 1979) and different propertics from diffcrcnt source regions In the Transantarctic l\mountainsReference BentleyBentley, 1981
That appears to be the only falsification of the icethickness map by the elevation map. However, there are some new features of interest on the elevation map. Around 78° S, 170° E, the new map shows a zone of strong gradient in elevation (and, presumably, ice thickness there is almost no radio-echo-sounding information in this region) between the main body of Ross Icc Shelf and McMurdo Ice Shelf south of Ross Island. This gradient extends surprisingly far out into the ice shelf The isopachs are not parallel to flow Reference Thomas, Macayeal, Eilers and Gaylond(Thomas and others, 1984)so there must be rapid thinning along the flowlines. The flow is neither divergent nor spatially accelerating in the direction of thinning, so the thinning must reflect rapid basal melting, perhaps produced by oceanic flow southward beneath the ice shelf and around Ross Island into McMurdo Sound, as sug;gested by Lewis andReference Lewis and PerkinPerkin (1985)Contrary to this idea, however, is the lack of anv warm source water in this region along the Ross Ice Shelf frontReference Pills bury and Jacobs(Pillsbury and Jacobs, 1985).
Another new feature is the valley along 171° W north of 79.5° S that deepens all the way to the ice front. It lies entirely between the two nearest RIGGS flight lines, so could not show on the ice-thickness map, although there is a suggestion of it farther south (Fig. 2b)around grid 9.5° S, 2°W. This valley begins about 70 km to the east of the northern end of the broad valley that curves northwestward from just west of Steershead across 80' S at 173°W. It lies directly down-flow from Steershead itself, according to both the velocity vectors (Thomas and others, 1984) and flow stripes in the iceReference Shahraie and Bentley(Shabtaie and Bentley, 1987)The continuity of the flow stripes proves that the new-found feature was not formed bv an eastward displacement of the broad valley, a possibility that is suggested by the elevation map, yet the feature itself does qot extend continuously back to Steershead. vVe suggest that this is a break-off of thin ice from the lce of Steers head, according to the model ofReference JczekJezek (1980andReference BentleyBentley and Jczek (1981)already mentioned.
Perhaps the most useful feature of the new map is the delineation of the grounding lines ofIce Streams D and E, vvhich show strikingly on an expanded-scale mapheavy solid line). The position .of the grounding line, estimated from the break in slope, is in good agreement with that mapped by Scambos and Bindschadler (1991;, alth.ough the altimeter version is sm.oother and less complex due to the gridding and contouring of the data. The position of the grounding line near 80.1 S, 150°w was confirmed by Jacobe! and BindschadlerReference Jacobel and Bindschadler( 1993)using surface-based radio-echo-sounding and tiltmeter measurements, and is in excellent agreement with the altimeter estimate. Notonly is the grounding line marked, by an abrupt change in the surface slope, but an ice plain is also dearly indicated by surface flattening and even reversals in slope, as on the ice plain of lee Stream BReference Shahraie and Bentley(Shabtaie and Bentley, 1987)This is also apparent in the imagery .ofthis areaReference Jacobel and Bindschadler(Jacobel and Bindschadler, 1993).
The difference mapcan be expected to show principally, four things: grounded ice, secular changes, spatial variations in the mean density of the ice shelf and errors in one or the other of the DEM we believe errors are few and mostly small in extent. The only large featureon On the map that we believe probably results from error is the broad negative anomaly, marginally significant in amplitude, that lies between Steersht'ad and 18°E. There is no reason to suspect abnormally high densitities here - neither the snow-accumula tion rates nor the strain rates arc anomalousReference Thomas, Macayeal, Eilers and Gaylond[Thomas and others, 1984)so we suspect that the cause is either orbit error or an inaccuracy in the geoid model.
Many small anomalies appear between Roosevelt Island and ice Stream D and also on the southwest side of Roosevelt Island. These we attribute principally to imperfect positioning and lack of resolution, in the icethickness DEM of the small-scale, steep-sided features that characterize these areas. However, it is also likely that changes have occurred with time in these regions. Thcre are three areas, where thert' is adequate RES data, that show significant positive differences that may indicate grounding. The first lies at 80.3° S, 168° W. The s('cond at 80.° S, 163° Wand the third at 80.3° S, 168°E. However, for the latter two, the differences are about 6 m, which is only just above the error margin
Over the major part of the icc shelf the differences shown in Figure 5 lie well within the ±m margin of error. This indicates a general lack oflatnal variability in mean ice density. An obvious exception to this is the region of large negative differences > 10m) along the outflow from Byrd Glacier, which is due- to a rapid increase of density with depth in the near-surface fim, as shown by a seismic short-refraction profileReference Kirchner and Bentlcy(Kirchner and Bentley, 1990)A 10m lower surface height, compared with the 15.5 m intercept term in Equation (2) (which represents the integratted height of the air column in the fim) shows that tlw near-surface densities should be about 65% eloser to the solid-ice density than the average for the firn layers across the ice shelf This is approximately what the short-refraction profile showsReference Kirchner and Bentlcy(Kirchnter and Bentley, 1990 fig. 23 Similar anomalies arc associated with mulock and Skelton Glaciers, presumably from similar strcss-indueted high densities.

Fig. 5 Map of altimeter-derived elevations minus elevations derivedfrom ice thicknesses by using an equation for hydrostatic equilibrium (Equation (2)). The contour interval used was 2m. Positive differences are hatched. Unshaded regions equate to areas where no data were available.

Fig. 6 Map of surface elevations on the ice plain oj Ice Streams D and E, and the neighbouring part of the ice shelf elevations above 250 m are not plotted. The approximate location of the grounding line,from the break in slope, is shown as a heavy solid line.
Conclusions
In this initial study, we have shown that the fast-delivery altimeter data from ERS-l give new insights into the morphology of the Ross Ice Shelf Deviations from the hydrostatic model relating ice thickness and surface elevation have been shown to provide information on areas of grounding and changes in mean ice density. The use of altimetn wave-form data and the full complement of radio-echo-sounding data, including the RIGGS flight Jines, will allow a more detailed study to be undertaken in the future.
Acknowledgements
the authors thank R. H. Rapp for his help with the geoid errors and analysis, and D. Vaughan for providing the SPRI RES data. Funding for J.L.B. was through U.K.natural Environment Research Council grant GR3/7836. This is contribution no. 550 of the Gcophysical and Polar Research Center, university of wisconsin-Madison. The ERS-l data were supplicd by ESA.