


Overconsumption of soft drinks is now considered to be a major public health concern with implications for the pathogenesis of obesity, type 2 diabetes and CVD. There is compelling evidence that consumption of sugar-sweetened beverages, as well as sugar in the form of fructose or glucose, is associated with increased blood pressure (BP)( Reference Brown, Stamler and Van Horn 1 ). Furthermore, reduced consumption of sugar-sweetened beverages, as well as sugars in the form of sucrose, glucose and fructose, was found to be significantly associated with reduced BP in a prospective study( Reference Chen, Caballero and Mitchell 2 ).
Although several long-term and epidemiological studies have evaluated the association between sugars and BP( Reference Brown, Stamler and Van Horn 1 – Reference Nguyen, Choi and Lustig 5 ), little is known about postprandial cardiovascular and haemodynamic responses to sugary drinks. In healthy elderly subjects, consumption of sucrose and glucose, but not fructose, decreased BP( Reference Visvanathan, Chen and Garcia 6 ), suggesting differential haemodynamic responses to the ingested sugars. Recently, work in our laboratory has shown that BP increased acutely after fructose, but not glucose, ingestion in healthy young adults( Reference Brown, Dulloo and Yepuri 7 ). In the latter study, the BP response was accompanied by a substantial drop in total peripheral resistance (TPR) after glucose ingestion, which was not observed with fructose ingestion( Reference Brown, Dulloo and Yepuri 7 ). Microvascular endothelial dysfunction was found to be associated with increased BP in obese and lean women( Reference De Jongh, Serné and IJzerman 8 ) as well as in normal subjects( Reference Serné, Stehouwer and ter Maaten 9 ). Recently, a study has found no alteration of endothelial function after ingestion of either a glucose or isoenergetic glucose–fructose (45:55, w/w) beverage( Reference Bidwell, Holmstrup and Doyle 10 ), but in this latter study, they did not measure haemodynamics, therefore, a relationship between endothelial function and the BP effect of sucrose, glucose and fructose is still lacking.
The purpose of the present study was to evaluate in young and healthy adults the haemodynamic consequences of sucrose, and its building blocks fructose and glucose ingested separately as well as in combination. A second aim was to investigate microvascular endothelial function to determine a possible relationship to the observed BP-elevating effects of fructose.
Materials and methods
Subjects
A total of twelve healthy young adults (five women, seven men), aged 22·0 (se 0·4) years, were recruited from local students and their friends. The mean height of the participants was 175 (se 3) cm, body weight was 66 (se 3) kg and BMI was 21·5 (se 0·7) kg/m2. All of the test subjects were non-obese with normal resting BP (brachial systolic blood pressure (SBP)/diastolic blood pressure (DBP) < 135/85 mmHg). None of the subjects had any diseases or were taking any medication affecting cardiovascular regulation. All participants fasted for ≥ 12 h and abstained from alcohol, smoking and caffeine, as well as from vigorous exercise for 24 h, before each test and were advised not to change their dietary habits between the tests. The present study was conducted according to the guidelines laid down on the Declaration of Helsinki, and all procedures involving human subjects were approved by the local ethics committee (approval no. 132005). Written informed consent was obtained from all subjects.
Experimental design
All studies started between 08.00 and 09.00 hours in an air-conditioned (temperature 22 ± 1°C), quiet laboratory, with subjects at thermal comfort. Every test subject attended four separate experimental sessions (separated by at least 3 d) according to a randomised cross-over design. Randomisation was performed using a random sequence generator (http://www.random.org/sequences/) by which the session order was determined for twelve test subjects before the commencement of the study. At each experimental session, cardiovascular responses to one of four test drinks were monitored. The drinks tested were as follows: (1) water containing 60 g sucrose; (2) water containing 60 g glucose; (3) water containing 60 g fructose; (4) water containing 30 g fructose. Each test drink also contained 10 ml lemon juice (to cover partially the difference in sweetness) and was made up to a total of 500 ml by addition of tap water (water temperature 22 ± 1°C). The subjects were not informed about the order of the drinks.
On arrival at the laboratory, subjects were asked to empty their bladders if necessary and to sit in a comfortable armchair. All subjects wore light clothing consisting of a t-shirt and trousers. The equipment was then connected and the test subject's upper part of the body was covered with a light blanket. After waiting for a period (within 30 min) to reach stable values for cardiovascular functions (heart rate (HR), BP and cardiac output (CO)), the microvascular function test was performed (time required: approximately 32 min). Cardiovascular recordings started immediately after the microvascular testing with a 30 min baseline period after which the subjects ingested the test drink over a period of 4 min, which was followed by post-drink cardiovascular recordings made for 60 min. At the end of this period, the BP measuring equipment was removed and microvascular function testing was repeated. Throughout the procedures, subjects were allowed to watch documentaries.
Haemodynamics
Cardiovascular recordings were performed using a Task Force Monitor (CNSystems Medizintechnik AG) with data sampled at a rate of 1000 Hz( Reference Brown, Barberini and Dulloo 11 ). Continuous BP was monitored using the Penaz principle from either the index or middle finger of the right hand and was calibrated to oscillometric brachial BP measurements on the contralateral arm. Impedance cardiography measurements( Reference Grasser, Goswami and Hinghofer-Szalkay 12 ), in which the changes in thoracic impedance are converted to reflect the changes in thoracic fluid content/volume over time, were performed based on the original Kubicek et al. ( Reference Kubicek, Patterson and Witsoe 13 ) approach but using an improved estimate of thoracic volume( Reference Fortin, Habenbacher and Heller 14 ), which allows calculation of cardiac stroke volume (SV). Electrocardiogram/impedance electrodes were positioned together with upper-arm and finger BP cuffs. Electrode strips were placed at the neck and thoracic regions, the latter specifically at the midclavicular line at the xiphoid process level (CNSystems standard electrode kits). Myocardial contractility parameters were derived through impedance cardiography measurement( Reference Grasser, Goswami and Hinghofer-Szalkay 12 ).
Microvascular endothelial function
Microvascular endothelial function was assessed non-invasively in the finger-skin microcirculation by a combination of iontophoresis and laser Doppler flowmetry (Perimed PF5010; Järfälla), using a standard protocol( Reference de Jongh, Clark and Ijzerman 15 ).
Acetylcholine (ACh, 1 %, Fluka; Sigma-Aldrich Chemie GmbH) was delivered to the middle dorsal phalanx of the third finger of the non-dominant hand using an anodal electrical current, consisted of seven doses (0·1 mA for 20 s) with a 60 s interval between each dose. The electrical current was conveyed by a battery power supply that was isolated from the mains electricity. Then, sodium nitroprusside (0·01 %, Riedel-de Haen; Sigma-Aldrich Laborchemikalien GmbH) was delivered to the same spot of the fourth finger using a cathodal current, consisted of nine doses (0·2 mA for 20 s) with a 90 s interval between each dose. Skin perfusion responses were recorded by a laser Doppler flowmetry probe (in perfusion units), and the temperature of the probe was kept constant at 32°C during all measurements. The protocol was chosen because it is sufficient to provide effective ACh and sodium nitroprusside delivery but avoids non-specific vasodilation observed with higher electrical charges( Reference Droog, Henricson and Nilsson 16 ). CV for the maximum response to ACh was 31 (se 5) % and to sodium nitroprusside was 40 (se 5) %, determined from all pre-drink tests, which is in agreement with a previous study( Reference Morris and Shore 17 ).
Data and statistical analysis
The present sample size is based on variability estimates for BP (our primary outcome) obtained from our previous experiments( Reference Brown, Dulloo and Yepuri 7 ). Power analysis, with type I error (α) of 0·05 and a desired power (1 − β) of 0·80, suggests that for such an investigation of repeated measures (on the same subject), a total number of twelve subjects would be required. Assumptions employed in the power analysis of the present study for BP, our most relevant variable, include the following: (1) standard deviation (σ) of the difference in post-drink BP response of 5 mmHg; (2) physiologically and clinically relevant difference (δ) in post-drink BP change of 5 mmHg.
Values of cardiac interval, BP (SBP, mean blood pressure (MBP) and DBP), cardiac SV and index of contractility (IC) were averaged every 15 min during the baseline period and over the 1 h post-drink period. CO was derived as the product of SV and HR. TPR was calculated as MBP divided by CO, whereas MBP was calculated from DBP and SBP, respectively:
 $$\begin{eqnarray} MBP = DBP + 1/3(SBP - DBP). \end{eqnarray}$$
The IC reflects the aortic peak flow and it is the maximum impedance changes (ΔZ divided by Δt max) normalised to the ground impedance Z 0. Maximal increase in skin perfusion was computed as the average of the last two stimuli minus baseline.
All values are reported as means with their standard errors. Statistical analysis was performed by two-way ANOVA for repeated measures with time (0, 15, 30, 45 and 60 min) and treatment – sucrose (60 g), glucose (60 g), fructose (60 g) and fructose (30 g) – as within-subject factors using statistical software (Statistix version 8.0; Analytical Software). Where significant differences were found, the effects of each drink over time were analysed by comparing the values at each time point over the post-drink period with the baseline values recorded during the 30 min period immediately before drinking. One-way ANOVA with Dunnett's multiple comparison test and repeated-measures ANOVA with the Newman–Keuls post hoc test were used to determine the changes over time from baseline levels and to compare mean changes between the drink types. A paired t test was used to compare mean changes from baseline over 60 min for each drink, respectively. A Friedman test with Dunn's post hoc testing was used to compare vasodilatory responses before and after drug administration. All reported P values are two-sided. For all tests, significance was set at P≤ 0·05.
Results
Cardiovascular responses to the sugary drinks
Resting values were similar for both haemodynamic and microvascular measurement parameters (Table 1). None of the test subjects reported nausea or other unpleasant effects after ingesting the test drinks.
Table 1 Baseline haemodynamic data recorded 30 min before ingesting each of the test drinks and baseline laser Doppler perfusion for microvascular measurements (Mean values with their standard errors)
PU, perfusion units.
† Baseline skin blood flux, average over the last 30 s before the first application.
Figs. 1 and 2 show the changes in SBP, DBP, MBP and HR after ingesting the various test drinks. Significant effects for time (SBP: P< 0·005; DBP: P< 0·005; MBP: P< 0·005; HR: P< 0·005), drink (SBP: P< 0·05; DBP: P< 0·01; MBP: P< 0·005) and drink × time interaction (SBP: P< 0·05; DBP: P< 0·01; MBP: P< 0·01; HR: P< 0·05) were found for SBP, DBP, MBP and HR. Ingestion of fructose (60 or 30 g) led to significant elevation in SBP, DBP and MBP over time starting approximately 30 min after ingestion (peak fructose 60 g for SBP: 7·1 mmHg, P< 0·005; DBP: 5·6 mmHg, P< 0·005; MBP: 6·1 mmHg, P< 0·005; peak fructose 30 g for SBP: 5·4 mmHg, P< 0·005; DBP: 4·0 mmHg, P< 0·005; MBP: 4·3 mmHg, P< 0·005). Ingestion of glucose led to increased SBP (2·5 mmHg, P< 0·05) over time, whereas ingestion of sucrose showed no changes related to BP (Figs. 1 and 2). Comparison of the responses to the ingested test drinks (mean change from baseline levels) showed that the increases in DBP and MBP were significantly higher for fructose (60 or 30 g) than for either glucose or sucrose (Figs. 1 and 2). For SBP, there was a significant difference found between fructose and sucrose (Fig. 1(a)). The fructose 30 g drink decreased HR significantly within the first 15 min after ingestion followed by a steady increase, at which a similar time course to that of the fructose 60 g drink was observed. The HR response over time for glucose and sucrose resulted, after a small initial drop, in a gradual increase for sucrose but not for glucose. A comparison between the test drinks showed no significant differences in changes from baseline levels (Fig. 2(b)).
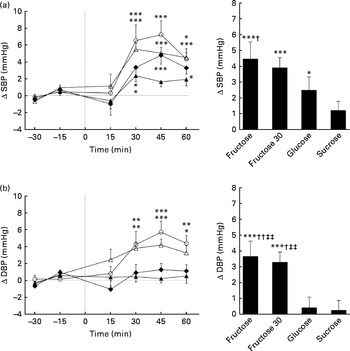
Fig. 1 Time course for changes in systolic blood pressure (SBP) (a) and diastolic blood pressure (DBP) (b) before and after ingestion of fructose (○), fructose at 30 g (fructose 30; △), glucose (◆) and sucrose (▲). Time 0 indicates the resumption of the recordings after the 4 min drink period. Values are means, with their standard errors represented by vertical bars. Mean value was significantly different from that at baseline over time: * P< 0·05, ** P< 0·01, *** P< 0·005. Mean value was significantly different from that of the sucrose drink (equivalent to the AUC): † P< 0·05, †† P< 0·01. ‡‡ Mean value was significantly different from that of the glucose drink (equivalent to the AUC) (P< 0·01).
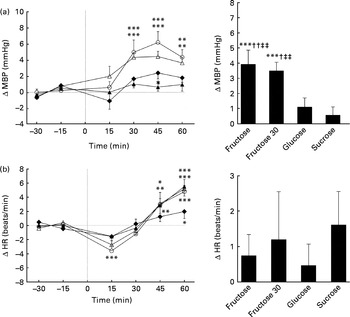
Fig. 2 Time course for changes in mean blood pressure (MBP) (a) and heart rate (HR) (b) before and after ingestion of fructose (○), fructose at 30 g (fructose 30; △), glucose (◆) and sucrose (▲). Time 0 indicates the resumption of the recordings after the 4 min drink period. Values are means, with their standard errors represented by vertical bars. Mean value was significantly different from that at baseline over time: * P< 0·05, ** P< 0·01, *** P< 0·005. Mean value was significantly different from that of the glucose drink (equivalent to the AUC): † P< 0·05, †† P< 0·01. ‡‡ Mean value was significantly different from that of the sucrose drink (equivalent to the AUC) (P< 0·01).
Figs. 3 and 4 show the changes over time and the mean changes from baseline levels for CO, TPR, SV and IC. Significant effects for time (CO: P< 0·005; TPR: P< 0·01; SV: P< 0·005; IC: P< 0·005), drink (CO: P< 0·005; TPR: P< 0·005; SV: P< 0·05; IC: P< 0·05) and drink × time interaction (CO: P< 0·01; TPR: P< 0·005; SV: P< 0·005; IC: P< 0·005) were found for CO, TPR, SV and IC. All sugars increased CO, but only glucose and sucrose showed significant changes over time (peak for glucose: 0·54 litres/min, P< 0·005; peak for sucrose: 0·51 litres/min, P< 0·005). Glucose and sucrose showed significantly higher CO compared with fructose (60 or 30 g) (Fig. 3(a)). Comparison of changes over time indicates that TPR is slightly, but not significantly, increased with the ingestion of fructose (60 and 30 g) but decreased significantly with the ingestion of glucose and sucrose (peak for glucose: − 1·18 mmHg × min per litre, P< 0·01; peak for sucrose: − 1·45 mmHg × min per litre, P< 0·005). TPR for fructose (60 or 30 g) is significantly higher than that for glucose or sucrose (Fig. 3(b)). In contrast to fructose, sucrose and glucose increased SV and IC significantly over time (SV peak for sucrose: 5·3 ml, P< 0·005; glucose: 7·0 ml, P< 0·005; IC peak for sucrose: 4·5 × 1000 per s, P< 0·005; glucose: 5·7 × 1000 per s, P< 0·005; Fig. 4(a) and (b)). Ingestion of glucose increased SV more than the ingestion of fructose (60 and 30 g), whereas the IC was found to be higher with the ingestion of glucose and sucrose than with the ingestion of both fructose drinks (Fig. 4(a) and (b)).
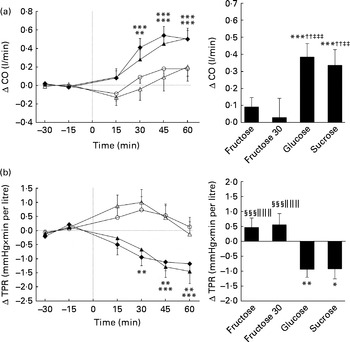
Fig. 3 Time course for changes in cardiac output (CO) (a) and total peripheral resistance (TPR) (b) before and after ingestion of fructose (□), fructose at 30 g (fructose 30; △), glucose (◆) and sucrose (▲). Time 0 indicates the resumption of the recordings after the 4 min drink period. Values are means, with their standard errors represented by vertical bars. Mean value was significantly different from that at baseline over time: * P< 0·05, ** P< 0·01, *** P< 0·005. †† Mean value was significantly different from that of the fructose drink (equivalent to the AUC) (P< 0·01). Mean value was significantly different from that of the fructose 30 drink (equivalent to the AUC): ‡‡ P< 0·01, ‡‡‡ P< 0·005. §§§ Mean value was significantly different from that of the sucrose drink (equivalent to the AUC) (P< 0·005). ∥∥∥ Mean value was significantly different from that of the glucose drink (equivalent to the AUC) (P< 0·005).
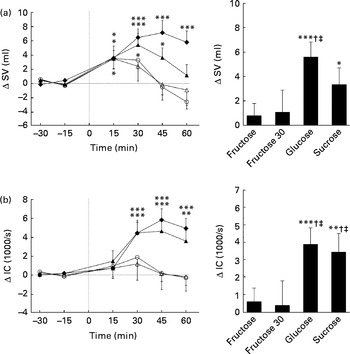
Fig. 4 Time course for changes in stroke volume (SV) (a) and index of contractility (IC) (b) before and after ingestion of fructose (○), fructose at 30 g (fructose 30; △), glucose (◆) and sucrose (▲). Time 0 indicates the resumption of the recordings after the 4 min drink period. Values are means, with their standard errors represented by vertical bars. Mean value was significantly different from that at baseline over time: * P< 0·05, ** P< 0·01, *** P< 0·005. † Mean value was significantly different from that of the fructose drink (equivalent to the AUC) (P< 0·05). ‡ Mean value was significantly different from that of the fructose 30 drink (equivalent to the AUC) (P< 0·05).
Microvascular function
There were no significant differences observed for ACh- and sodium nitroprusside-mediated microvascular endothelial flux between fructose, glucose and sucrose. Although, compared with pre-drink values, a tendency for fructose at 30 g to increase ACh-mediated vasodilation was observed (80 (se 19) v. 103 (se 17) arbitrary units, P =0·08; Table 2), these differences did not reach statistical significance.
Table 2 Microvascular endothelial function measurements before (pre-drink*) and after (post-drink*) the ingestion of fructose at 60 g, fructose at 30 g, glucose at 60 g and sucrose at 60 g (Mean values with their standard errors)
ACh, acetylcholine; PU, perfusion units; SNP, sodium nitroprusside.
* Pre- and post-drink conditions were compared using either a paired t test or a Wilcoxon signed-rank test. P< 0·05 was considered as statistically significant.
Discussion
To our knowledge, this is the first study using beat-to-beat cardiovascular measurements to evaluate haemodynamic consequences after ingestion of sucrose and its building blocks glucose and fructose at isoenergetic amounts, and at an amount of fructose equivalent to that present in sucrose (i.e. 30 g fructose). The results of the present study demonstrate that sucrose ingestion does not mimic the BP-elevating effect of fructose, independently of whether sucrose is compared with fructose at isoenergetic amounts (60 g each) or with fructose at an amount equivalent to that present in sucrose (30 g fructose v. 60 g sucrose); the haemodynamic responses and BP-elevating effects of fructose being similar whether provided as 60 g or as 30 g, and higher than with 60 g of either sucrose or glucose. Furthermore, the present study indicates no differences in haemodynamic responses to sucrose and glucose ingestion, and no differences in microvascular endothelial function in response to the various sugars ingested (glucose, fructose and sucrose). Taken together, the present results indicate that the glucose component of sucrose attenuates the acute fructose-induced elevation of BP in young and healthy human subjects.
Studies for the BP response to orally ingested sucrose in healthy human subjects are scarce. We chose the sugar content as 60 g (in 500 ml water) for the present study on the basis that this amount is commonly available in soft drinks, thereby mimicking a daily-life scenario. SBP increased with ingestion of all sugars in the present study, with fructose showing the highest response (5–6 v. 1-3 mmHg for the other sugars). Furthermore, whereas ingestion of sucrose and glucose caused only a marginal or no change in DBP, ingestion of fructose increased DBP substantially (3–5 mmHg between 30 and 60 min post-drink). These results are consistent with our previous findings( Reference Brown, Dulloo and Yepuri 7 ) for an elevated DBP value up to 120 min after ingestion of fructose but not after ingestion of glucose. Our findings, however, differ from Rebello et al. ( Reference Rebello, Hodges and Smith 18 ) who reported SBP to be elevated with sucrose and glucose but not with fructose 1 h after ingestion, and, furthermore, with no effect on DBP. In this latter study, the response to fructose should be interpreted with caution because all of their subjects experienced watery diarrhoea after ingestion of fructose (1 g/kg), most of them within 40 and 60 min post-drink. Furthermore, unlike in the present study in which we performed continuous measurement of BP, Rebello et al. ( Reference Rebello, Hodges and Smith 18 ) used a discontinuous oscillometric method to measure BP values. Another study by Visvanathan et al. ( Reference Visvanathan, Chen and Garcia 6 ) in elderly healthy individuals (72 years old on average) found SBP and DBP to be decreased after ingesting 50 g of either sucrose or glucose, whereas fructose ingestion showed no such decrease. Similarly, BP has been reported to fall slightly after ingestion of 75 g glucose but not after ingesting the same amount of fructose in elderly normotensive subjects( Reference Jansen, Penterman and Van Lier 19 ).
A likely explanation for the discrepancy between the blunted BP response after ingestion of sucrose (60 g) and its elevation after ingesting either isoenergetic (60 g) or equivalent (30 g) amounts of fructose can be derived by the actions of insulin. The observation of an increase in SV and CO and a decrease in TPR with ingestion of sucrose and glucose but not with ingestion of fructose in the present study is likely due to the action of insulin because insulin is known to increase dose-dependently CO by rising SV and HR and to decrease systemic vascular resistance( Reference Baron and Brechtel 20 ). In the present study, the rise of CO with ingestion of glucose and sucrose was secondary due to an increase in SV with minor changes in HR, whereas fructose did not affect CO and SV. In contrast, ingestion of glucose and sucrose substantially decreased TPR, whereas a small increase in TPR was found after ingestion of fructose. Therefore, it is likely that the actions of insulin were at least partly responsible for the aforementioned findings. Moreover, the differences for TPR in response to the ingestion of sugars in the present study fully account for the BP results.
It can be speculated that the observed positive inotropy with glucose and sucrose but not fructose consumption could partly explain the accompanying rise in SV in the present study. Using radionuclide ventriculography, Fisher et al. ( Reference Fisher, Gillen and Dargie 21 ) observed an immediate increase in inotropy in response to intravenous injection of insulin. In vitro experiments on human atrial myocardium found positive inotropic effects in response to insulin( Reference von Lewinski, Rainer and Gasser 22 ). However, the failure of two studies to find changes in inotropy in healthy human subjects after intravenous administration of insulin( Reference Airaksinen, Lahtela and Ikäheimo 23 , Reference Sasso, Carbonara and Cozzolino 24 ) calls for caution in attributing the observed inotropy with glucose or sucrose consumption to changes in insulin alone.
We conducted microvascular endothelial function testing to investigate whether changes in BP following ingestion of sugary drinks are linked to endothelial dysfunction. Here, we found a trend (P= 0·08) towards an augmentation of endothelial function after ingestion of 30 g fructose with a non-significant increase after ingestion of fructose and sucrose. Ingestion of glucose resulted in a non-significant attenuation in ACh-mediated vasodilation. Bidwell et al. ( Reference Bidwell, Holmstrup and Doyle 10 ) assessed endothelial function using forearm blood flow measurements combined with reactive hyperaemia after acute ingestion of either a glucose or isoenergetic glucose–fructose (45:55, w/w) beverage and found no significant alterations in endothelial function. In line with the present results, they observed, 60 min after ingestion, a small non-significant difference between the glucose–fructose and glucose beverages( Reference Bidwell, Holmstrup and Doyle 10 ), but the former tended to be higher. Based on the results, a contribution of microvascular endothelial function to the increase in BP after ingestion of fructose seems unlikely.
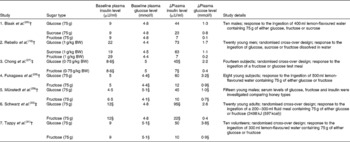
There are limitations in the present study. First, we cannot rule out the possibility that differences in perceived sweetness between the test drinks could have influenced the present results. However, we believe that the addition of 10 ml lemon juice to each drink minimised these differences in sweetness perception. Second, the primary focus of the present study was on BP responses for which a power analysis indicated that a sample size of twelve subjects would be required to identify significant differences. However, the part of the present study assessing microvascular endothelial functions may not be sufficiently powered because of the large inherent variability in the measurements of microvascular functions. Consequently, our findings that there are no significant differences across the various drinks for these secondary outcome parameters should be taken with caution. Third, we did not measure insulin concentrations because we wanted to avoid taking blood samples that could influence subtle haemodynamic changes pertaining to venous cannulation( Reference Langham and Harrison 25 ). Furthermore, based on a literature search, we found compelling evidence that a sugary drink or a sugared fluid meal at comparable amounts to those used in the present study raises plasma insulin and glucose levels substantially (Table 3) ( Reference Rebello, Hodges and Smith 18 , Reference Blaak and Saris 26 – Reference Tappy, Randin and Felber 31 ). Using a hyperinsulinaemic clamp approach in healthy human subjects, a recent study has found an improvement in skin and skeletal muscle microvasculature perfusion in response to reactive hyperaemia, suggesting that insulin influences the microvasculature from the skin and skeletal muscle similarly( Reference de Jongh, Clark and Ijzerman 15 ). Therefore, in the present study, it seems plausible to refer the observed cardiovascular consequences after ingestion of glucose and sucrose at least partly to insulin.
Table 3 Summary of the studies in which plasma insulin and glucose levels were reported before and at 60 min after ingestion of a sugary drink or a sugared fluid meal in healthy human subjects*
BW, body weight.
* Values for plasma insulin and glucose levels were either obtained from tables (Rebello et al. ( Reference Rebello, Hodges and Smith 18 ) and Münstedt et al. ( Reference Münstedt, Böhme and Hauenschild 29 )) or estimated from figures (Blaak et al. ( Reference Blaak and Saris 26 ), Chong et al. ( Reference Chong, Fielding and Frayn 27 ), Fukagawa et al. ( Reference Fukagawa, Veirs and Langeloh 28 ), Schwarz et al. ( Reference Schwarz, Schutz and Froidevaux 30 ) and Tappy et al. ( Reference Tappy, Randin and Felber 31 )).
† Studies with sugary drinks.
‡ Studies with sugared fluid drinks.
§ Values were originally expressed as μU/ml (Blaak et al. (26), Rebello et al. ( Reference Rebello, Hodges and Smith 18 ), Fukagawa et al. ( Reference Fukagawa, Veirs and Langeloh 28 ), Münstedt et al. ( Reference Münstedt, Böhme and Hauenschild 29 ) and Tappy et al. ( Reference Tappy, Randin and Felber 31 )) or as pmol/l (Chong et al. ( Reference Chong, Fielding and Frayn 27 ) and Schwarz et al. ( Reference Schwarz, Schutz and Froidevaux 30 )) for plasma insulin or as mmol/l (Blaak et al. ( Reference Blaak and Saris 26 ), Rebello et al. ( Reference Rebello, Hodges and Smith 18 ), Chong et al. ( Reference Chong, Fielding and Frayn 27 ) and Schwarz et al. ( Reference Schwarz, Schutz and Froidevaux 30 )) and as mg/dl (Fukagawa et al. ( Reference Fukagawa, Veirs and Langeloh 28 ), Münstedt et al. ( Reference Münstedt, Böhme and Hauenschild 29 ) and Tappy et al. ( Reference Tappy, Randin and Felber 31 )) for plasma glucose. A conversion factor of 0·166 was used to convert pmol/l to μU/ml and 0·0555 to convert mg/dl to mmol/l.
In conclusion, ingestion of a sugary drink containing 60 g sucrose seems unlikely to have an impact on BP in healthy young human subjects while isoenergetic amounts of fructose raised the BP substantially. Although sucrose comprises equivalent amounts of glucose and fructose, changes in TPR and CO are more related to glucose than to fructose. This is the first study to demonstrate that the BP-elevating effects of fructose are attenuated in the presence of glucose through a reduction in TPR.
Acknowledgements
The present study was funded in part by the Swiss National Science Foundation (project 3200B0-122554 to J.-P. M.).
The authors' responsibilities were as follows: E. K. G. recruited the subjects, conducted the study, analysed and interpreted the data, and wrote the original draft of the manuscript; A. D. and J.-P. M. assisted in the interpretation of the data, provided critical intellectual feedback for the manuscript, and helped to write the manuscript. All authors planned the study.
The authors declare that there are no conflicts of interest.


