


Excessive salt intake increases blood pressure with the eventual outcome of stroke and CVD, making it the second most important risk factor to harm one’s health next to cigarette smoking( Reference Beaglehole, Bonita and Horton 1 , Reference Strazzullo, D’Elia and Kandala 2 ). In fact, 10 % of cardiovascular deaths worldwide are said to be caused by excessive salt intake( Reference Mozaffarian, Fahimi and Singh 3 ). Conversely, continuous reduction in salt intake mitigates these risks( Reference Aburto, Ziolkovska and Hooper 4 ).
Both developed and developing countries have reported excessive salt intake in their populations( 5 , Reference Anderson, Appel and Okuda 6 ), although the sources of salt vary. In Japan, exceptionally high salt intake is an important lifestyle issue( Reference Anderson, Appel and Okuda 6 , Reference Asakura, Uechi and Sasaki 7 ). Despite this, no effective salt-reduction education has yet been established.
Several society-wide approaches, such as salt reduction in processed foods or clear nutritional labelling, have been effective( Reference He, Brinsden and MacGregor 8 ). However, these necessitate cooperation between government and industry. In contrast, individual approaches, such as salt-reduction education, make people aware of their own salt intake. For example, 24 h urinary salt excretion analysis provides individuals with feedback regarding their salt levels, leading to lower salt intake in the short and long terms( Reference Cohen, Weinberger and Fineberg 9 , Reference Ohta, Tsuchihashi and Onaka 10 ).
However, it is not feasible for people to repeatedly conduct 24 h urine collections, and spot-urine or second-urine tests, which are performed immediately after waking, must be measured by an inspection agency, so they are impractical for individuals( Reference Tanaka, Okamura and Miura 11 , Reference Kawasaki, Itoh and Uezono 12 ). Alternatively, 24 h urinary salt excretion can be estimated based on overnight (ON) salt excretion levels using a self-monitoring device (KME-03; Kohno ME Laboratory, Kanagawa, Japan). Individuals can do this themselves and the method shows significant correlation with the 24 h urine collection method( Reference Yamasue, Tochikubo and Kono 13 ). Furthermore, the urinary salt ‘in–out’ method – which employs a self-monitoring urinary salt-excretion device – has been compared with 24 h urinary excretion collection. The in–out method showed significant accuracy and could be used to motivate participants( Reference Yasutake, Sawano and Shono 14 – Reference Yasutake, Horita and Umeki 16 ). Moreover, individuals who used the self-monitoring urinary salt-excretion device showed effective management of their salt intake despite receiving no education on how to reduce their short-term ON urinary salt excretion levels( Reference Yasutake, Sawano and Yamaguchi 17 ). Nevertheless, no allocation tests, such as randomized comparison tests, have yet been conducted to evaluate the effectiveness of the device.
The present study was a parallel, randomized trial involving two groups; it aimed to evaluate whether the self-monitoring urinary salt-excretion device reduces salt intake over 4 weeks.
Methods
Participants
The target population comprised 123 out of 162 individuals who responded to a poster campaign and subsequent explanatory meeting that took place between September and November 2014. The posters were displayed on noticeboards in regional clusters of about 1300 apartment buildings, three health-care centres and one company. All individuals agreed to participate by both verbal and written agreement. Among the recruited individuals, those with a history of hypertension or antihypertensive drug use other than diuretics were not excluded. The research poster and explanatory meeting made it clear that individuals would not be eligible to participate if they: (i) had physical, mental or social difficulties; (ii) took diuretics; (iii) were pregnant; (iv) had oedema or renal disease; or (v) could not make decisions for themselves. In addition, only participants above 21 years of age were recruited. Individuals who answered these criteria were excluded from the study.
Intervention schedule
Upon entry into the study, the participants were asked to answer the salt check sheet( Reference Tsuchihashi, Masuda and Oniki 18 ) and a questionnaire on eating behaviour that was modified using the transtheoretical model (Fig. 1)( Reference Prochaska and Velicer 19 ). They were also asked to collect and submit a 24 h urine sample on a convenient day within 2 weeks of entry. Women were asked to collect urine on a day outside the menstrual period. At this time, they were instructed to continue their typical dietary habits. After urine collection, the participants were asked to measure their blood pressure.
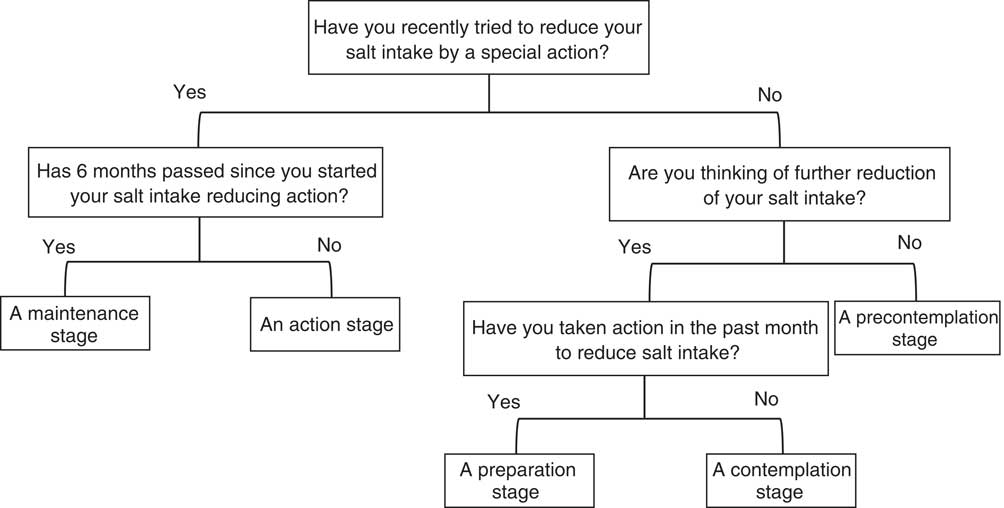
Fig. 1 Questionnaire about salt-reduction eating behaviour stage. The list was based on the transtheoretical model
This initial collection provided the baseline values for gender, age, existence of hypertension, blood pressure and 24 h urinary salt excretion. These were used as key parameters to stratify randomization and divide the subject population equally into two groups: an intervention group that used the self-monitoring urinary salt-excretion device and a control group that did not. The intervention group was asked to use the self-monitoring urinary salt-excretion device for 4 weeks and plot the measurements on a graph sheet (see below). At the end of the investigation, they were asked to record the results of their 24 h home urine collection, blood pressure measurement, salt check sheet and eating behaviour questionnaire (endline investigation). Conversely, the control group was asked to act in a manner typical to their everyday life from the time of entry. After 4 weeks, they answered the salt check sheet and eating behaviour questionnaire (endline investigation). Neither group received any nutritional education. The results of the 24 h urinary salt excretion were recorded individually after the study ended.
The 4-week duration of the study was based on our own pilot studies, wherein ON salt excretion levels decreased after 3–4 weeks of using the self-monitoring urinary salt-excretion device( Reference Yasutake, Sawano and Yamaguchi 17 ). Moreover, 4 weeks was long enough to confirm the antihypertensive effect, as we have shown in our previous study( Reference Yasutake, Horita and Murata 15 , Reference Obarzanek, Proschan and Vollmer 20 ).
Outcomes
The primary outcomes of the present study were: (i) the difference in 24 h urinary salt excretion after the intervention; and (ii) the difference between the intervention and control groups. Since salt intake differs greatly between individuals( Reference Fukumoto, Asakura and Murakami 21 ), 24 h urinary collection should be performed on multiple days( Reference Iwahori, Miura and Ueshima 22 ). However, the compliance rate decreases after multiple iterations( Reference Yasutake, Horita and Umeki 16 ), resulting in a low number of samples available for analysis. Thus, we instructed the participants to collect 24 h urine samples only at baseline and endline in the present study.
The secondary outcomes were change in the Na:K ratio and ON salt excretion in the 24 h urine sample, as well as blood pressure.
Twenty-four-hour urine collection
A partition cup (proportional sampling method) was used for the 24 h home urine collection and 1/50 of the total urine volume was collected( Reference Tochikubo, Uneda and Kaneko 23 ). Reports comparing the partition cup and total urine method show a high correlation index of urine volume (r=0·97) and urinary salt excretion (r=0·98)( Reference Tochikubo, Uneda and Kaneko 23 ). To collect urine accurately using the partition cup, the participants were given verbal and written instructions, as well as a simulation, beforehand. The participants were specifically reminded to collect urine during defecation.
To empty their bladders after the first-morning urination, the participants were asked to complete urination at 06.00 hours, which is the standard urine collection time. Thereafter, the participants were asked to collect all urine using the partition cup. Finally, they were asked to complete another scheduled urination at 06.00 hours the next day, regardless of desire to urinate. The total volume up to then was designated as the 24 h home urine collection( Reference Yasutake, Horita and Murata 15 , Reference Yasutake, Horita and Umeki 16 , Reference Yasutake, Miyoshi and Kajiyama 24 , Reference Ohta, Tsuchihashi and Fujii 25 ). The participants’ urine samples were collected occasionally and analysed. SRL Co., Ltd analysed the total urine volume, as well as urine creatinine, Na and K levels. Specifically, creatinine was analysed by enzyme assay, Na and K by the electrode method. Urine samples whose measured 24 h creatinine levels were within 30 % of the estimated levels were designated as successful. Those outside this range were eliminated( Reference Yasutake, Horita and Murata 15 , Reference Yasutake, Horita and Umeki 16 , Reference Yasutake, Miyoshi and Kajiyama 24 , Reference Ohta, Tsuchihashi and Fujii 25 ).
Self-monitoring device
A self-monitoring device (KME-03; Kohno ME Laboratory, Kanagawa, Japan) was used in the present study. The device can estimate 24 h salt excretion from 8 h ON urine samples in an exclusive container. Therefore, participants were asked to urinate 8 h before their prearranged waking time (06.00 hours). Urine evacuated during the sleeping period was collected in a dedicated cup. If an unscheduled urination was needed between 22.00 and 06.00 hours, the urine was added to the first-morning urine and analysed.
The principle of the measuring device is as follows: the volume sensor consists of fifty small, resistant chips and a conductivity sensor comprising two gold-coated nickel plates. These sensors measure urine volume, Cl– concentration and temperature. These values are then integrated, and the NaCl concentration is estimated using an original algorithm. In the present study, because conductivity-based concentration measurement is affected by other electrolytes, such as K, the NaCl concentration was adjusted using a correlation formula so that it was between the values obtained using the ion electrode and conductivity methods. The self-monitoring device estimated 24 h salt excretion from ON urine samples using the following formula: Y=5·76X×0·53 (g/d), where Y is the estimated 24 h urinary salt excretion and X is the Na+ content of the ON urine samples( Reference Yamasue, Tochikubo and Kono 13 ). This formula was derived from regression analysis of 24 h salt excretion and of those estimated using the self-monitoring device to analyse ON urine samples. Moreover, others have reported that 24 h salt excretion correlates well with ON urinary salt excretion (r=0·72, P<0·001; n 224)( Reference Yamasue, Tochikubo and Kono 13 ). We have also confirmed the validity of the self-monitoring device in previous studies( Reference Yasutake, Sawano and Shono 14 – Reference Yasutake, Horita and Umeki 16 ). First, test meals containing known amounts of salt (5, 10 and 13 g/d) confirmed that overnight urinary salt excretion values roughly reflect the previous day’s salt intake, but correlation of ON to 24 h urinary salt excretion was found only in the 10 g salt/d condition( Reference Yasutake, Sawano and Shono 14 , Reference Yasutake, Horita and Murata 15 ). Second, we have reported CV for interday differences for overnight urinary salt excretion. The CV for 24 h urinary salt excretion among three test days and among subjects were 24·7 and 21·3 %, respectively. The CV for overnight urinary salt excretion were lower than those for 24 h salt (13·3 and 17·7 %, respectively)( Reference Yasutake, Horita and Umeki 16 ).
Recording overnight salt excretion level using the self-monitoring urinary salt-excretion device
The participants were asked to record their urinary salt excretion levels every morning using the device and plot them on a graph sheet. The graph was prepared by modifying the bodyweight graph diary developed for obese patients( Reference Fujimoto, Sakata and Etou 26 ). The participants were asked to draw a red line at the target value of salt intake (males, below 8 g/d; females, below 7 g/d; hypertensive people, below 6 g/d)( 27 , Reference Kawano, Tsuchihashi and Matsuura 28 ) detailed in the Japanese dietary salt intake standard (2015). They were then asked to connect these values to their everyday diet and try to lower their values near to the target.
Salt check sheet
The salt check sheet is a single A4 sheet with thirteen questions; it takes 3–5 min to complete. The thirteen questions can be categorized as follows: seven items evaluate the intake of salty meals, such as miso soup, pickles and noodles; four evaluate the use of salty sauces (e.g. soya sauce), eating out and home-meal replacement; and two evaluate the seasoning content and size of homemade meals. Each question is scored up to 3 points, with a total of 35 points, and salt content is characterized as low (0–8 points), medium (9–13 points), high (14–19 points) or very high (≥20 points)( Reference Tsuchihashi, Masuda and Oniki 18 ). The check sheet was based on the relationship between salt intake (estimated using a brief self-administered diet history questionnaire)( Reference Kobayashi, Murakami and Sasaki 29 , Reference Kobayashi, Honda and Murakami 30 ) and 24 h urinary salt excretion in outpatients with hypertension in Fukuoka prefecture( Reference Sakata, Tsuchihashi and Oniki 31 ). The validity of the values from the salt check sheet were checked in studies involving patients with hypertension and local middle-aged people( Reference Tsuchihashi, Masuda and Oniki 18 , Reference Yasutake, Miyoshi and Kajiyama 24 ).
Questionnaire about salt-reducing eating behaviour
Generally, desirable health behaviour is attained in five stages, as evaluated by the transtheoretical model: (i) a precontemplation stage, in which a patient has no intention of changing in the foreseeable future; (ii) a contemplation stage, in which a patient intends to change, but not soon; (iii) a preparation stage, in which a patient intends to change during the next month; (iv) an action stage, in which a patient changes; and (v) a maintenance stage, in which a patient maintains the change for at least 6 months( Reference Prochaska and Velicer 19 ). We referred to a previous report in which the transtheoretical model showed that spot-urine measurement is comparable with 24 h urinary salt excretion( Reference Tamaki, Kikuchi and Yoshita 32 ). The same study categorized the eating behaviour of each individual into five stages using a questionnaire (Fig. 1).
Blood pressure measurement
The participants measured their blood pressure, after resting for 5 min, using a digital, upper-arm, automatic blood pressure-measuring instrument (HEM-7080 IC; Omron, Kyoto, Japan). They did so at the beginning and end of the 24 h urine collection period – immediately after the early-morning urination. The mean of four consecutive measurements was recorded.
Anthropometric measurements
Fasting measurements of height and body weight were conducted after urine sampling on the last day of 24 h urine collection, with the participants lightly dressed and without shoes or socks. Their body weight was self-measured at home using the same scale at baseline and endline. Their height was self-declared, and body weight measurements were recorded to the nearest 0·1 kg. BMI was calculated using these values of height and body weight.
Quality assurance of data collection
The authors pre-practised all investigations, including the 24 h urine collection, to become familiar with the procedure, data collection and confirmation; and could therefore adequately explain these processes. Blanks or errors in the salt check sheet( Reference Tsuchihashi, Masuda and Oniki 18 ) or questionnaire about salt-reducing eating behaviour( Reference Prochaska and Velicer 19 ) were corrected by asking each individual.
Statistical analysis
Statistical data were presented as means and standard deviations. The χ 2 test was used to analyse qualitative variables, the paired t test was used to compare two paired groups, and the unpaired t test to compare two unpaired groups. Concerning urinary salt excretion and blood pressure, the difference between baseline and endline was corrected as a covariate using ANCOVA. One-way ANOVA was used when there were three or more groups. The significance level was set at P<0·05. The statistical software package IBM SPSS Statistics version 22 was used in the statistical analyses.
Results
The present study involved 123 participants, who were assigned by stratified randomization: sixty-two in the control group and sixty-one in the intervention group. Six individuals withdrew their consent during the study: two in the control group and four in the intervention group. Seventy-eight participants succeeded in collecting a 24 h home urine sample at both baseline and endline: thirty-six in the control group and forty-two in the intervention group (baseline and endline). These samples were subjected to analyses (Fig. 2). Ultimately, the participants comprised twelve men and sixty-six women. There were no significant differences between the control and intervention groups in terms of gender, age, BMI, or medical, medication or smoking history (Table 1). Similarly, there were no significant differences in 24 h urinary salt excretion or blood pressure between the groups at baseline (Table 2). No change in 24 h urinary salt excretion was found in the control group after intervention (Δ=−0·1 (sd 3·3) g/d). However, the level was significantly lower in the intervention group (Δ=−1·2 (sd 3·8) g/d; P=0·039), but not significant when the baseline was corrected. Conversely, 24 h urinary K excretion was significantly lower after intervention in the control group (Δ=−419 (sd 900) mg/d; P=0·008); there was no significant difference in the intervention group (Δ=−98 (sd 723) mg/d), but a tendency (P=0·055) was found when corrected by baseline values. As a result, the Na:K ratio was significantly increased in the control group (baseline, 2·9 (sd 1·4); endline, 3·4 (sd 1·4); P=0·005), but showed no difference in the intervention group (baseline, 3·4 (sd 1·7); endline, 3·1 (sd 1·6); P=0·289; Table 2). This difference was still significant when corrected by baseline values (P=0·033). In contrast, there were no significant differences between the two groups in terms of salt excretion, K excretion, Na:K ratio, or systolic and diastolic blood pressure at endline (Table 2). Moreover, BMI did not differ after the intervention in either group (control group: baseline, 22·4 (sd 2·4) kg/m2; endline, 22·4 (sd 2·5) kg/m2; P=0·52; intervention group: baseline, 23·0 (sd 3·6) kg/m2; endline, 23·0 (sd 3·5) kg/m2; P=0·45). Similarly, at endline, there was no difference between the two groups in this regard.
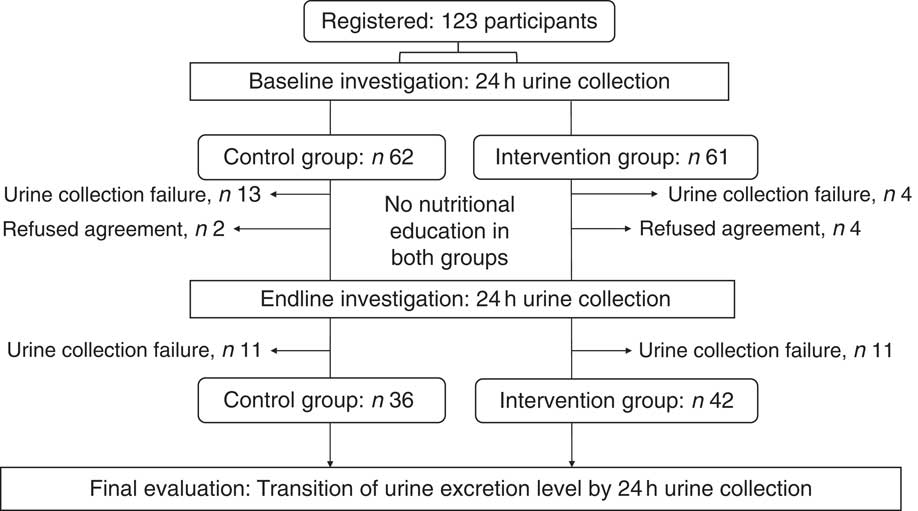
Fig. 2 Allocation of participants. The present study recruited 123 participants and divided them by stratified randomization into a control group with sixty-two individuals and an intervention group with sixty-one individuals. The final analysis involved seventy-eight participants (control group, n 36; intervention group, n 42)
Table 1 Characteristics of the study subjects: Japanese adults, 2014
Table 2 Change in 24 h urine collection and blood pressure variables after 4 weeks of intervention among Japanese adults, 2014
SBP, systolic blood pressure; DBP, diastolic blood pressure.
P value compares the mean difference between the baseline and endline changes in the variables between the two groups.
* Correction by baseline values using ANCOVA.
Next, we analysed changes in the scores on the salt check sheet after intervention. There was no significant difference in salt intake between the control and intervention groups at baseline, as evaluated using the salt check sheet items and total score. After intervention in the control group, there was no difference in the total ‘seasoning/eating-out’ score (four items: baseline, 3·1 (sd 2·4); endline, 2·7 (sd 1·9); P=0·14) or in the total ‘all items’ score (thirteen items: baseline, 10·3 (sd 4·6); endline, 9·5 (sd 3·9); P=0·15). However, in the intervention group, both scores were significantly decreased (‘seasoning/eating-out’: baseline, 3·2 (sd 2·1); endline, 2·5 (sd 1·9); P=0·01; ‘all items’: baseline, 10·6 (sd 3·8); endline, 9·5 (sd 4·2); P=0·01). Both groups showed a decrease in the ‘frequency of high-salt food intake’ (seven items) and ‘seasoning amount’ (two items), but the difference was not significant in either group. In addition, both groups showed a non-significant tendency towards improved salt intake level (Table 3). These results were similar even when participants receiving medication were excluded (data not shown). The distribution of eating behaviour stage showed no difference between the groups at baseline. However, at endline, the intervention group showed a significant increase in eating behaviour stage, while the control group showed no change (Table 3). Next, we analysed the changes in self-monitored urinary salt excretion after the intervention. The mean ON salt excretion, as measured using the self-monitoring device for ON urine, showed a tendency towards a decrease at 2, 3 and 4 weeks. However, ANOVA found no significant differences in this regard (Fig. 3(a)). However, the mean ON salt excretion value in weeks 3 and 4 was significantly decreased compared with weeks 1 and 2 (7·7 (sd 1·3) v. 7·9 (sd 1·3) g/d; P=0·02; Fig. 3(b)). The participants filled their ON salt excretion values into the self-monitoring graph on a mean of 24·0 (sd 5·1) d, with no difference being found between the groups in this regard.
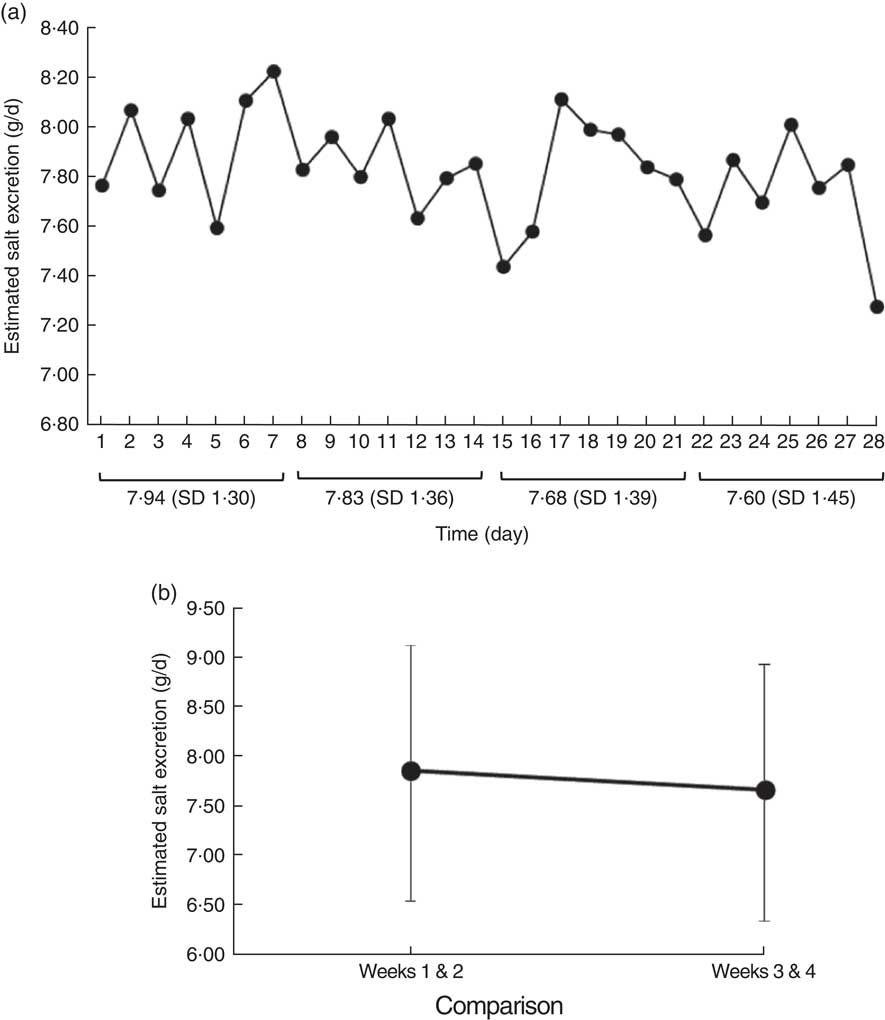
Fig. 3 Changes in estimated salt excretion levels evaluated using overnight urine in the intervention group of forty-two Japanese adults, 2014. (a) The mean estimated overnight salt urine excretion, measured using a self-monitoring device, was lower in weeks 2 and 3 than in week 1. However, it showed no change by multiple comparison. (b) Weeks 3 and 4 showed a significant decrease in mean estimated salt excretion (standard deviations shown by vertical bars) compared with weeks 1 and 2
Table 3 Change in salt check-sheet scores and dietary behaviour stage after 4 weeks of intervention among Japanese adults, 2014

Discussion
Salt intake in Japan is considerably higher than in many other countries( Reference Anderson, Appel and Okuda 6 , Reference Asakura, Uechi and Sasaki 7 ) and it is therefore important that researchers and policy makers develop effective salt-reduction education. The present study aimed to evaluate the effectiveness of a self-monitoring salt-excretion device as a novel education method. The study was a 4-week parallel, randomized trial involving two groups.
Interestingly, the two groups in the present study did not receive any nutritional education and only the intervention group, who used the self-monitoring device, showed a significant effect. In a previous report, we found that the use of a self-monitoring device decreased ON salt excretion without any special salt-reduction education. However, the experiment used no control group( Reference Yasutake, Sawano and Yamaguchi 17 ). In a similar study, Ohta et al. collected 24 h urine samples from 103 individuals with hypertension ten times over a 5-year period. They showed that feedback regarding urinary salt levels significantly lowered salt excretion levels by 1·4 g/d( Reference Ohta, Tsuchihashi and Onaka 10 ). This corroborates the present study, which also found that awareness of one’s own urinary salt excretion level significantly affected that level, indicating that the intervention triggered salt-reduction behaviour. Relatedly, eating behaviour stage was improved only in the intervention group, indicating the same conclusion.
The results indicated that the intervention significantly improved the urinary excreted Na:K ratio due to tendency of lower salt Na and equal K excretion between baseline and endline. There was no such tendency and no significant difference of urinary excreted Na:K in the control group. In addition, the scores of the salt check sheet, which evaluates habitual salt intake level( Reference Tsuchihashi, Masuda and Oniki 18 ), showed that the decrease was due to changes in the amount of added seasoning and frequency of eating out. Twenty-four-hour salt and K excretion showed no significant difference when corrected by baseline values. We believe that evaluation of the educational effect of the self-monitoring device in such a short period either needs usage of urinary excreted Na:K ratio as a marker since it is more sensitive; or that a slightly longer period is necessary for detecting improvement of 24 h urinary salt excretion. However, in the intervention group, the measurements of the self-monitoring salt-excretion device were significantly decreased in weeks 3 and 4 v. weeks 1 and 2, with no difference in BMI. Taken together, these results indicate that information regarding one’s own ON salt excretion level, as measured using a self-monitoring device, is effective in reducing salt intake. Studies with larger target populations are necessary to confirm our results.
Numerous studies have found that salt reduction lowers blood pressure( Reference He and MacGregor 33 , Reference Dickinson, Mason and Nicolson 34 ). For instance, Obarzanak et al. conducted a crossover comparison study wherein 188 individuals with hypertension reduced their salt intake from 8·2 to 3·7 g/d, leading to a significant reduction in mean systolic blood pressure( Reference Obarzanek, Proschan and Vollmer 20 ). However, in the present study, blood pressure did not change in either group, perhaps because the mean blood pressure of the participants reported herein was within the normal range and because the mean reduction in 24 h urinary salt excretion in the intervention group was 1·2 g, which, although significant, may have been too small a change to affect blood pressure. However, in a meta-analysis, salt reduction of 1 g/d over >4 weeks lowered blood pressure by 1 mmHg in hypertensive subjects and by 0·5 mmHg in normotensive subjects( Reference He and MacGregor 33 ). In addition, among all patients with hypertension in the USA assumed to take antihypertensive reagents, salt reduction of only 1 g has a greater prophylactic effect( Reference Bibbins-Domingo, Chertow and Coxson 35 ). Taken together with these previous reports, the effect of salt reduction in the present paper cannot be overlooked. Future studies must re-evaluate this effect in a large hypertensive group.
After the intervention, the participants in the control group showed a tendency of lower 24 h urinary K excretion levels and a higher Na:K ratio. However, the intervention group showed no difference. K counteracts high salt intake-dependent blood pressure elevation( Reference Fujita and Ando 36 , Reference Kawano, Minami and Takishita 37 ) and higher Na:K ratio is related to cardiovascular risk and all-cause mortality rate( Reference Yang, Liu and Kuklina 38 ). Thus, the combination of reduced salt excretion and unchanged K excretion is an important finding. Ideally, reduced salt excretion and increased K excretion should be observed, but we found this seldom happens simultaneously.
The self-monitoring salt-excretion device cannot estimate urinary K levels. For this reason, salt-reduction education, 24 h urine collection, spot-urine tests and second-urine tests after waking up should be conducted to measure K excretion and Na:K ratio( Reference Tanaka, Okamura and Miura 11 , Reference Kawasaki, Itoh and Uezono 12 , Reference Iwahori, Ueshima and Miyagawa 39 ). We do not know why urinary K excretion and resulting Na:K ratio showed, although not significant, respective lower and higher values in the control group. However, the result implies that it is important to evaluate K together with Na.
The present study had several limitations. First, in the control group, we found that baseline 24 h urinary salt excretion level was higher than in the intervention group. Although the significance of this and resulting 24 h salt excretion became non-significant after correction by baseline values, we need a larger target population to confirm the present study. Nutritional education is generally more effective among individuals with a poor socio-economic background( Reference Denke and Frantz 40 ). Thus, it may be that regression towards the mean had influenced the results. At baseline, we used stratified randomization to ensure that both groups had equal 24 h salt excretion levels. However, some participants dropped out subsequently because, for example, they failed to collect their 24 h home urine samples. This may have influenced the results. Indeed, salt excretion, K excretion and Na:K ratio did not differ significantly between the two groups at endline (Table 2), suggesting that the effect of the self-monitoring is limited.
Second, the present study was a short-term one that involved only a few participants with normal mean blood pressure; the resulting salt excretion reduction was small and there was no change in blood pressure. Future studies must involve a longer evaluation period and the use of blood pressure as an outcome in a hypertensive population.
The third limitation was that our salt check sheet and questionnaire about salt-reducing eating behaviour have not been checked for reproducibility. Our future studies will implement a detailed dietary investigation to analyse changes in dietary salt consumption using a self-monitoring device.
The final limitation is that the results of the present study may not be applicable in other groups with different profiles.
Conclusion
Salt-reduction education using a self-monitoring salt-excretion device helps 24 h urinary Na:K ratio, salt check sheet scores and eating behaviour stage. Thus, the usage of self-monitoring tools has an educational potential in salt intake reduction.
Acknowledgements
Acknowledgements: The authors wish to thank Ms Masayo Yasumoto, Ms Hiroko Takeuchi, Ayako Irie, Kazuko Ishimoto and Hiromi Misono for their excellent technical assistance, and Dr Hideaki Kumahara for help with statistics. Financial support: This work was supported by a Grant-in-Aid for Scientific Research from the Japan Society for the Promotion of Science (grant number JP25750067). The funder had no role in the design, analysis or writing of this article. Conflict of interest: All authors declare that they have nothing to disclose regarding funding or conflicts of interest with respect to this manuscript. Authorship: Conception, design and overall supervision of study: K.Y. and T.T. Registration of subjects and collection of urine samples: K.Y., E.M., T.K., T.F. and T.I. Analysis and interpretation the data: K.Y., R.M., Y.Mi., Y.Mu., K.O. and M.E. Write up: K.Y., K.O., M.E. and T.I. Ethics of human subject participation: The study protocol was approved by the ethics committee of Nakamura Gakuen University (Rinri̶̶14-001) and adhered to the ethical guidelines of the Declaration of Helsinki. Written informed consent was obtained from the subjects of their own free will. They confirmed that (i) they suffered no disadvantages for refusing the study overview, (ii) they were participating freely, (iii) there were no disadvantages for withdrawing consent after agreeing to participate, (iv) they consented to public dissemination of the results at scientific meetings and in published manuscripts, and (v) their personal information would be protected.


