


The health benefits of fish consumption, especially of fatty fish, have traditionally been attributed to the effect of long-chain n-3 PUFA, and although the TAG-lowering effect of fish oil and long-chain n-3 PUFA is well documented, there is controversy as to the cholesterol-regulating and glucose-regulating effects of the marine n-3 fatty acids( Reference Harris 1 – Reference Balk, Lichtenstein and Chung 9 ). Studies in rats and humans suggest that also fish proteins, either eaten as fish or purified intact or hydrolysed proteins, may be beneficial to human health and affect risk factors of CVD and type 2 diabetes( Reference Jacques 10 – Reference Hagen, Helland and Bratlie 22 ). Little is known about how protein hydrolysates containing small peptides from fatty fish, such as herring and salmon, may affect markers of obesity-related disorders.
The total production and utilisation from the world’s fisheries and aquaculture was estimated to be 157·9 million tonnes in 2012, with 136·2 million tonnes utilised for human consumption and 21·7 million tonnes utilised for non-food purposes( 23 ), such as fish protein concentrate, fishmeal and oil for the feed market. The global demand for n-3 PUFA ingredients in 2010 was estimated to be a staggering US$1·595 billion, whereas the market for protein ingredients in the USA alone was estimated to be worth US$45–60 million( 23 ). Fish remains and other fish by-products such as heads, tails, bones and other cut-offs should be explored to a greater extent as protein sources for human consumption. Dietary proteins have nutritional properties depending on their amino acid content, and in addition these proteins have potential functional properties on the basis of their amino acid sequence. Bioactive motifs can be liberated during digestion (enzymatic hydrolysis), microbial fermentation or in vitro hydrolysis (processing) of proteins before ingestion. The bioactive peptides are usually 2–20 amino acids in length, and may enter the circulatory system after being absorbed through the intestine or produce local effects in the digestive tract( Reference Ryan, Ross and Bolton 24 ). Peptides from fish protein hydrolysates have been shown to have antihypertensive, antioxidative, antiproliferative, anticoagulant and calcium-binding abilities( Reference Ryan, Ross and Bolton 24 , Reference Kim and Wijesekara 25 ), and we have recently identified small bioactive motifs with hypocholesterolemic, antidiabetic, antioxidant opioid agonist/antagonist activities in rest raw materials from Atlantic herring( Reference Pampanin, Larssen and Provan 26 ), Atlantic salmon and Atlantic cod( Reference Pampanin, Haarr and Sydnes 27 ). Hydrolysed proteins from fish should be of great interest for the food industry as additives to functional foods and as nutraceuticals, and good documentation of the health benefits of fish hydrolysates may contribute to a more sustainable fishery and a healthier population.
In the present study, we investigated the effects of two in vitro enzymatically hydrolysed fish proteins as part of normoenergetic diets fed to obese Zucker fa/fa rats. Rest raw materials from herring and salmon were chosen as protein sources, as the industrial processing of these fish types produces vast amounts of rest raw materials that we believe should be commercially exploited for human consumption. Both hydrolysates were examined for known bioactive motifs with hypocholesterolemic and/or antidiabetic effects. The obese Zucker fa/fa rat has an abnormal lipid metabolism and presents changes often seen in human obesity, and is the most used and most representative rat model for studies of metabolic complications and possible treatments of obesity( Reference de Artinano and Castro 28 ). Visible obesity is present already 3–5 weeks after birth, and in addition the obese Zucker rats develop a range of endocrinological abnormalities resembling human metabolic syndrome, including insulin resistance, dyslipidaemia, mild glucose intolerance and hyperinsulinaemia( Reference de Artinano and Castro 28 ). The aim of the present study was to see whether herring and salmon protein hydrolysates containing peptides mainly <4000 g/mol would affect typical markers for metabolic disorders in a rat model for obesity and diabetes.
Methods
Animals and diets
In total, eighteen male Zucker fa/fa rats (HsdOla:Zucker-Lepr, from Harlan Laboratories) were assigned to three experimental groups of six rats each with comparable mean body weight. The rats were housed in pairs in Makrolon IV cages (EHRET GmbH & Co.) in a room maintained in a 12 h light–12 h dark cycle (light from 07.00 to 19.00 hours) with constant temperature of 20±3°C and relative humidity of 65±15 %. The rats were acclimatised under these conditions before the start of the experiment.
The intervention period started when the rats weighed 350 (sd 20) g. The rats were fed modified, semi-purified experimental diets on the basis of AIN-93G( Reference Reeves, Nielsen and Fahey 29 ) (Table 1) for 4 weeks. The casein/whey-(CAS) based diet contained 20 wt% proteins from casein/whey (90 % casein, 10 % whey) from KAPA JP (Armor Protéines). The herring (HER) diet contained 15 wt% proteins from casein/whey and 5 wt% proteins from herring protein hydrolysate, and the SAL diet contained 15 wt% proteins from casein/whey and 5 wt% proteins from salmon protein hydrolysate. The casein/whey was not hydrolysed before use. All other ingredients were purchased from Dyets Inc. The diets were prepared according to the instructions for the AIN-93G( Reference Reeves, Nielsen and Fahey 29 ), with addition of 1 wt% growth and maintenance supplement as recommended by Dyets Inc. All rats had free access to tap water and feed (ad libitum). The feed was contained in ceramic bowls that were too heavy for the rats to knock over. Feed leftovers were thrown away and newly thawed feed was provided every day except Sundays (double doses provided on Saturdays). As the feed was given as a powder formula, the rats always had access to wood chewing sticks. The rats were weighed weekly during the intervention period.
Table 1 Composition of the of the experimental diets (g/kg diet)
CAS, casein/whey; HER, herring; SAL, salmon.
* Contains 90 % crude protein.
† Contains 44 % crude protein, 15 % maltodextrin, 36 % ash, 3 % moisture.
‡ Contains 44 % crude protein, 15 % maltodextrin, 31 % ash, 5 % moisture.
§ Contains 41 % choline.
|| Contains 2·5 g vitamin B12, 2·5 g vitamin K1 and 995 g sucrose per kg.
The rats were housed in Makrolon IV cages with grids for 24 h on day 18 of the intervention period, without fasting in advance, for collection of faeces and measurements of feed intake.
A meal tolerance test was performed using a standardised meal on day 22 of the intervention period. The glucose load was prepared as a modified, semi-purified meal on the basis of AIN-93G( Reference Reeves, Nielsen and Fahey 29 ) with 400 g of sucrose/kg feed (composition of feed for meal tolerance test: 225 g casein (88 % raw protein; Armor Protéines), 70 g of soyabean oil, 390 g of sucrose, 203 g of maize starch, 50 g of cellulose, 35 g of mineral mix, 10 g of vitamin mix, 3 g of l-cystine, 1·6 g of l-methionine, 2·5 g of choline bitartrate and 10 g of growth and maintenance supplement; all ingredients except casein were purchased from Dyets Inc.). The rats were housed individually and under fasting conditions from 20.00 to 08.00 hours, before they received a meal corresponding to 2 g of sucrose/kg body weight. All rats were fed the same diet for the meal tolerance test. Body weight was measured before the meal load was calculated. The rats were allowed a maximum of 15 min to finish the meal. The dorsal tail vein was punctuated and blood glucose was measured using a blood glucose measuring device (Contour; Bayer Consumer Care AG). Blood glucose was measured in the fasting condition and 60, 120 and 180 min after the rats had finished eating the meal.
The rats were euthanised while under anaesthesia with 2–4 % isoflurane (Isoba vet; Intervet, Schering-Plough Animal Health) mixed with nitrous oxide and oxygen after 4-week intervention, after a 12-h fast with free access to tap water. The body length of the rats was measured with a ruler when rats were anaesthetised. Blood was drawn directly from the heart and collected in Vacuette Z Serum Clot Activator Tubes (Greiner Bio-One) for isolation of serum. Liver, skeletal muscle from the thigh and epididymal white adipose tissue (WAT) were dissected out and weighed. Serum and tissues were frozen in liquid N2 and stored at −80°C until analysis.
Ethics approval
The animal experiment was approved in accordance with the Norwegian regulation on animal experimentation (approval no. 2012-4610). The protocol was approved by the Norwegian State Board of Biological Experiments with Living Animals. The animal care and use programme at the Faculty of Medicine and Dentistry at University of Bergen is accredited by the Association for Assessment and Accreditation of Laboratory Animal Care International.
Preparation of fish protein hydrolysates
Protein hydrolysates from fresh Norwegian spring spawning herring by-products (Grøntvedt Pelagic AS) and fresh backbones after filleting of salmon (SalMar ASA) were prepared by the same methods. First, the fish remains were minced and heated to 55°C before they were mixed with warm water (1:1). Enzymatic hydrolysis was started by adding 0·1 % (dry weight of enzymes per weight wet material) of a mixture of papain and bromelain (1:1, w/w) (both powder on maltodextrin; Enzybel International S.A), by SINTEF Fisheries and Aquaculture. After 1 h of hydrolysis, the hydrolysis mixture was heated to above 90°C to ensure inactivation of enzymes. Thereafter, heated material was pumped to a Tricanter centrifuge (Flottweg Separation Technology) where oil, hydrolysate and sediments were separated. The hydrolysate was preserved by adding acetic acid to pH<4·0. Next, the dissolved hydrolysates were heated to 73°C and filtered through a ceramic membrane filter (50 nm, Pall Membralox; Pall Corporation), and NaOH was added until a pH of 8·5 was obtained and until precipitation was observed (Nofima BioLab). The precipitate was removed and the pH of the hydrolysate solutions were adjusted to 6·5 using HCl. The solutions were dried in a vacuum evaporator to achieve a DM content of 40 %, and then 15 % maltodextrin (by DM weight) was added before drying the hydrolysates in a spray dryer.
Analyses of protein hydrolysates and diets
The contents of amino acids, ash and moisture and the distributions of peptides on the basis of molecular weights in the fish hydrolysates, as well as the amino acid composition and total energy content in the diets, were analysed by Nofima BioLab. Peptide size distributions were measured by combining results from HPLC size exclusion chromatography using a Superdex™ Peptide 10/300 GL column (measuring range 200–20 000 g/mol; GE Healthcare) and a TSKgel G2000SW column (measuring range 2000–70 000 g/mol; Tosoh), both equipped with UV detectors( Reference Oterhals and Samuelsen 30 ). The fatty acid composition in the diets was analysed by GC, as previously described( Reference Drotningsvik, Mjos and Hogoy 21 , Reference Bligh and Dyer 31 – Reference Wasta and Mjos 34 ). Identification of bioactive motifs in the water-soluble herring and salmon hydrolysates was performed by the International Research Institute of Stavanger (IRIS), as described by Pampanin et al.( Reference Pampanin, Larssen and Provan 26 ), using LC-MS/MS Orbitrap analyses. Raw data from the Orbitrap were analysed using the Proteome Discoverer 1.3 (Thermo Scientific) with the Sequest algorithm to search against peptide sequences that has been reported by others to have hypocholesterolaemic and/or antidiabetic effects. The herring and salmon protein hydrolysates were examined for the presence of the following motifs: ALPMH( Reference Nagaoka, Futamura and Miwa 35 ), GLDIQK( Reference Nagaoka, Futamura and Miwa 35 ), GPAE( Reference Li-Chan, Hunag and Jao 36 ), GPGA( Reference Li-Chan, Hunag and Jao 36 ), GPL( Reference Ben Henda, Laamari and Lanneluc 37 ), HIRL( Reference Yamauchi, Ohinata and Yoshikawa 38 , Reference Yoshikawa, Fujita and Matoba 39 ), IAVPGEVA( Reference Lammi, Zanoni and Arnoldi 40 ), IIAEK( Reference Nagaoka, Futamura and Miwa 35 ), IPI( Reference Umezawa, Aoyagi and Ogawa 41 ), LPGP( Reference Lyapina, Myasoedov and Grigorjeva 42 ), LPYPR( Reference Yoshikawa, Fujita and Matoba 39 ), PGPL( Reference Lyapina, Myasoedov and Grigorjeva 42 , Reference Myasoedov, Lyapina and Grigorjeva 43 ), RPLKPW( Reference Yoshikawa 44 ), VPDPR( Reference Takenaka, Nakamura and Yamamoto 45 ), VVYP( Reference Kagawa, Matsutaka and Fukuhama 46 ), VW( Reference Matsui, Oki and Osajima 47 ), VYVEELKPTPEGDLEILLQK( Reference Nagaoka, Futamura and Miwa 35 ), YPFVV( Reference Yamada, Muraki and Oie 48 ) and YYPL( Reference Matsui, Oki and Osajima 47 ).
Analyses in fasting serum
Fasting serum concentrations of total cholesterol, LDL-cholesterol, HDL-cholesterol, TAG, total bile acids and alanine transaminase were analysed by accredited methods at the Laboratory of Clinical Biochemistry at Haukeland University Hospital. Serum NEFA and free cholesterol were analysed on the Cobas c 111 system (Roche Diagnostics GmbH) using the NEFA FS kit (DiaSys, Diagnostic Systems GmbH) and the free cholesterol FS kit (DiaSys), respectively. Serum cholesteryl ester was calculated as the difference between total and free cholesterol. The EIA-2048 kit (DRG Instruments GmbH) was used for analyses of serum insulin.
Analyses of lipids in liver, muscle and faeces
Lipids were extracted from liver, skeletal muscle and faeces by the method of Bligh & Dyer( Reference Bligh and Dyer 31 ), and analysed as previously described( Reference Drotningsvik, Mjos and Hogoy 21 ).
Total faecal bile acids
Faecal total bile acids (3α-hydroxy bile acids) were measured in freeze-dried faeces( Reference Suckling, Benson and Bond 49 ), and analysed as previously described( Reference Drotningsvik, Mjos and Hogoy 21 ).
Fatty acids in serum, liver, muscle and adipose tissue
Lipids were extracted from liver and skeletal muscle using a mixture of chloroform and methanol( Reference Bligh and Dyer 31 ) before methylation. Serum and adipose tissue samples were methylated without prior extraction of lipids. Extracts, serum and adipose tissue were methylated and analysed as described previously( Reference Drotningsvik, Mjos and Hogoy 21 , Reference Meier, Mjos and Joensen 32 – Reference Wasta and Mjos 34 ).
Statistical analysis
The data were evaluated by one-way ANOVA with Dunnett post hoc test for multiple comparisons when appropriate, and the cut-off level for statistical significance was taken at a probability of 0·05. Rats fed a CAS diet served as controls. Data are presented as mean values and standard deviation for six rats in each group.
Results
Diets
The dietary contents of most indispensable amino acids were comparable between the diets, but the contents of arginine, glycine and taurine were higher and the ratios of lysine:arginine and of methionine:glycine were lower in HER and SAL diets when compared with the CAS diet (Table 2). The contents of fatty acids were only marginally different between the diets (Table 2). We found no traces of long-chain n-3 PUFA (20 : 5n-3, 22 : 5n-3 and 22 : 6n-3) in any of the diets. The herring and salmon protein hydrolysates contained peptides mainly <4000 g/mol (constituting 96·7 and 92·7 % of total peptides, respectively). The distribution of peptides of size 200–500 g/mol was similar between the two protein hydrolysates (herring, 14·3 %; salmon, 14·0 %), strongly indicating that the amounts of dipeptides and tripeptides were similar in the HER and SAL diets. In addition, the contents of peptides in the range 200–1000 g/mol, comprising peptides with approximately 2–5 amino acids, were comparable in herring and salmon hydrolysates (31·9 and 31·2 %, respectively). The fraction of peptides <200 g/mol, comprising free amino acids and miscellaneous water-soluble components absorbing light with wavelength of 214 nm, was larger in herring hydrolysate compared with salmon hydrolysate (34·2 and 20·3 %, respectively). Peptides/motifs with hypocholesterolemic and/or antidiabetic activities were found in both fish hydrolysates. Antidiabetic motifs GPL, IPI and VW were found in both herring and salmon hydrolysates, whereas antidiabetic motifs GPAE and LGPG were found only in herring hydrolysate. The hypocholesterolemic and antidiabetic motif PGPL was also found in both fish hydrolysates. Sequence IIAEK, a powerful hypocholesterolemic peptide, was found only in herring hydrolysate.
Table 2 Contents of indispensable amino acids, the functional amino acid glycine, the conditionally essential arginine, taurine, the ratios of lysine:arginine and methionine:glycine, and contents of fatty acidsFootnote * in the diets
CAS, casein/whey; HER, herring; SAL, salmon.
* Only fatty acids found in levels >0·5 g/kg diet are shown. Long-chain n-3 PUFA (20 : 5n-3, 22 : 5n-3, 22 : 6n-3) were not detected in any of the diets.
† Arginine can be synthesised by the rat, but not in sufficient amounts to meet the demands for normal growth( Reference Farris and Griffith 50 ).
Energy intake and growth
The body weights in the fish hydrolysate groups were similar to that of the CAS group at baseline (Table 3). The mean body weight:square body length (without tail) ratio at euthanasia and mean weights of liver, thigh muscle and epididymal WAT relative to body weight were similar in fish hydrolysate groups and CAS. The energy intake (relative to body weight) and the faecal output of DM relative to body weight were similar in fish hydrolysate groups and CAS.
Table 3 Body weight at baseline, relative organ weight at time of euthanasia, and daily energy intake and faecal DM at day 18 (Mean values and standard deviations, n 6 rats in each group)
CAS, casein/whey; HER, herring; SAL, salmon.
* Mean value was significantly different from that of the CAS group (P<0·05; evaluated by one-way ANOVA with Dunnett’s post hoc test).
The mean percentage growth during the study period was significantly higher in the SAL group when compared with the CAS group (P=0·035), and this was statistically significant after 2 weeks (P=0·049) and tended to be significant after 3 weeks (P=0·063) of intervention (Fig. 1). The mean growth in the HER group was similar to that of CAS.
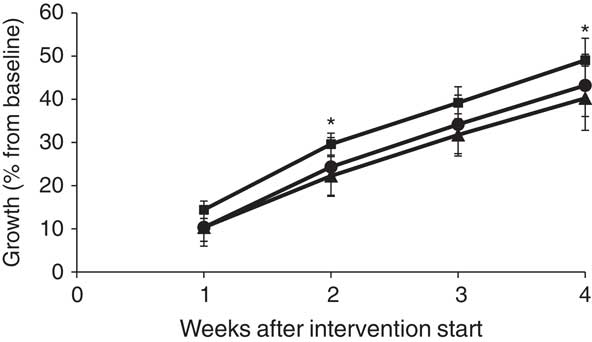
Fig. 1 Body weight gain during the intervention period, shown as percentage growth relative to baseline weight for rats fed casein/whey (CAS) (▲), herring (●) or salmon (■). * Mean value was significantly different from that of the CAS group (P<0·05; evaluated by one-way ANOVA with Dunnett’s post hoc test).
Meal tolerance test
Fasting glucose concentrations were similar in CAS and fish hydrolysate groups (CAS, 5·0 (sd 0·9); HER, 4·7 (sd 0·2); SAL, 5·0 (sd 0·5) mmol/l). The glucose concentration increased in all rats after intake of the carbohydrate-rich meal (2 g sucrose/kg body weight). The rise in glucose in SAL was significantly lower after 60 and 120 min (P values 0·023 and 0·012, respectively) when compared with CAS, whereas the postprandial glucose response in the HER group was similar to CAS (Fig. 2). After 180 min, no statistically significant differences were seen between fish hydrolysate groups and CAS.

Fig. 2 Meal tolerance test, shown as percentage change from fasting levels in casein/whey (CAS) group (▲), herring group (●) and salmon group (■) in fasting state and after intake of a carbohydrate-rich meal. * Mean value was significantly different from that of the CAS group (P<0·05; evaluated by one-way ANOVA with Dunnett’s post hoc test).
Biochemical analyses
Serum concentrations of HDL-cholesterol and LDL-cholesterol were significantly lower, and the serum concentration of TAG was significantly higher in HER when compared with CAS (P values 0·026, 0·010 and 0·032, respectively, Table 4). Serum total cholesterol and cholesteryl ester levels tended to be lower in HER when compared with CAS (P=0·093 and 0·099, respectively). No differences were seen between SAL and CAS for serum cholesterols and TAG concentrations. No statistically significant differences were seen between CAS and fish hydrolysate groups regarding the mean concentrations of total bile acids, NEFA, insulin and alanine transaminase (Table 4). The TAG and total cholesterol contents in liver and thigh skeletal muscle and the faecal excretion of cholesterol, TAG and total bile acids were not different between CAS and fish hydrolysate groups (data not presented).
Table 4 Circulating concentrations of lipids and enzymes (Mean values and standard deviations, n 6 rats in each group)

CAS, casein/whey; HER, herring; SAL, salmon.
* Mean value was significantly different from that of the CAS group (P<0·05; evaluated by one-way ANOVA with Dunnett’s post hoc test).
Fatty composition in serum, adipose tissue, liver and muscle
Both fish hydrolysate diets affected the fatty acid composition in serum, but only the SAL diet affected WAT epididymal fatty acids (Table 5). Serum level of 16 : 0 was higher and that of 18 : 0 was lower in HER when compared with CAS, and none of the fish hydrolysate diets affected total SFA amount. The Δ-9 desaturated MUFA 16 : 1n-7 and 18 : 1n-9 and the total concentration of MUFA in serum were higher in HER compared with the CAS group, whereas SAL seemed to not affect serum MUFA. HER and SAL rats had a significantly higher serum level of 18 : 3n-3, and in addition HER rats had a higher serum level of 22 : 5n-3; however, no difference was seen regarding serum total n-3 PUFA between CAS and fish hydrolysate groups. Serum level of 18 : 2n-6 was higher in SAL rats and that of 20 : 4n-6 was lower in both HER and SAL rats when compared with CAS. The total n-6 PUFA level was lower and the ratio of n-3:n-6 PUFA was higher in serum from HER rats when compared with the CAS group.
Table 5 Selected fatty acids in serum and epididymal white adipose tissue (Mean values and standard deviations, n 6 rats in each group)
CAS, casein/whey; HER, herring; SAL, salmon.
* Mean value was significantly different from that of the CAS group (P<0·05; evaluated by one-way ANOVA with Dunnett’s post hoc test).
† Sum of 12 : 0, 14 : 0, 15 : 0, 16 : 0, 17 : 0, 18 : 0, 20 : 0, 22 : 0, 23 : 0, 24 : 0.
‡ Sum of 14 : 1n-5, 16 : 1n-7, 16 : 1n-9, 17 : 1n-8, 18 : 1n-5, 18 : 1n-7, 18 : 1n-9, 20 : 1n-9, 24 : 1n-9.
§ Sum of 18 : 3n-3, 20 : 3n-3, 20 : 5n-3, 22 : 5n-3, 22 : 6n-3.
|| Sum of 18 : 2n-6, 18 : 3n-6, 20 : 3n-6, 20 : 4n-6, 22 : 4n-6, 22 : 5n-6.
The HER diet did not affect the fatty acid composition in WAT relative to CAS. In WAT from SAL-fed rats, levels of 16 : 0 and total SFA were lower, and levels of 18 : 3n-3 and total n-3 PUFA were higher when compared with CAS (Table 5). The fatty acid compositions in liver and muscle were not affected by any of the fish hydrolysate diets (data not presented).
Discussion
Fish intake is associated with improved blood lipid profile and glucose regulation, and could therefore prevent the development of type 2 diabetes and CVD in humans( Reference Feskens, Bowles and Kromhout 51 – Reference Kromhout, Bosschieter and de Lezenne Coulander 55 ). We have recently shown that when cod protein (as 25 % of dietary protein) was fed to obese Zucker rats, serum concentrations of fasting NEFA and 2-h postprandial serum glucose were lower, and the ratios of n-3:n-6 PUFA in liver, epididymal WAT and serum were higher when compared with a casein-fed control group( Reference Drotningsvik, Mjos and Hogoy 21 ). In the present study, we wanted to investigate the effects of herring and salmon protein hydrolysates on lipid metabolism and glucose regulation when obese Zucker fa/fa rats were fed diets in which fish hydrolysates constituted 25 % of dietary protein. The amount of peptides with a molecular weight of 200–1000 g/mol (comprising peptides with approximately 2–5 amino acids) were similar in the two fish protein hydrolysates, and none of the diets contained measurable amounts of long-chain n-3 PUFA. Both herring and salmon hydrolysates tested in the present study contained motifs with reported hypocholesterolemic and/or antidiabetic effects( Reference Nagaoka, Futamura and Miwa 35 – Reference Yamada, Muraki and Oie 48 ). To our knowledge, this is the first study testing dietary hydrolysed fish protein with identified bioactive motifs with hypocholesterolemic and antidiabetic activities in obese rats.
Motifs with antidiabetic properties have been identified in various species of fish: VW is found in sardine muscle( Reference Matsui, Oki and Osajima 47 ) and skin and residual material from Atlantic herring( Reference Pampanin, Larssen and Provan 26 ); YYPL is found in sardine muscle( Reference Matsui, Oki and Osajima 47 ); GPAE and GPGA are found in Atlantic salmon skin( Reference Li-Chan, Hunag and Jao 36 ); and GPL is found in skin and residual material from Alaska pollock, Atlantic herring, Atlantic salmon and Atlantic cod( Reference Pampanin, Larssen and Provan 26 , Reference Pampanin, Haarr and Sydnes 27 , Reference Byun and Kim 56 ). In addition, hypocholesterolemic motifs have been found in fish: HIRL and IIAEK have been found in residual material from herring( Reference Pampanin, Larssen and Provan 26 ). When searching for known motifs with hypocholesterolemic and/or antidiabetic effects( Reference Nagaoka, Futamura and Miwa 35 – Reference Yamada, Muraki and Oie 48 ) in our herring and salmon hydrolysates, we found the antidiabetic motifs IPI, GPL and VW and the combined antidiabetic and hypocholesterolemic PGPL in both hydrolysates. In addition, we found the hypocholesterolemic motif IIAEK and the antidiabetic motifs GPAE and LPGP only in herring.
The weights of liver, thigh muscle and epididymal WAT relative to body weight and the serum alanine transaminase concentration were not different between CAS and the fish hydrolysate groups, and thus we conclude that there are no indications of serious organ damage in any of the intervention groups. The energy intake was similar between the CAS and the fish hydrolysate groups; however, as the growth was significantly higher in SAL rats compared with CAS, this suggests a better utilisation of the feed in the SAL group. This is in contrast to findings in which Wistar rats fed a high-fat, high-sucrose diet with salmon hydrolysates as the sole protein source had a lower weight gain compared with similar diets with casein or herring hydrolysates despite similar energy intakes in all groups( Reference Pilon, Ruzzin and Rioux 17 ); however, this latter study uses a different rat strain and a high-energy diet, and no information on the peptide size distribution was given.
We have previously shown that a daily intake 6 g of cod protein as supplement was sufficient to affect postprandial glucose and insulin concentrations in overweight subjects( Reference Vikoren, Nygard and Lied 12 ), and recently we also found that cod protein feeding reduced 2-h postprandial glucose in obese Zucker fa/fa rats without affecting fasting serum concentrations of glucose and insulin( Reference Drotningsvik, Mjos and Hogoy 21 ). In the present study, no differences were seen in fasting glucose concentration between the HER and SAL groups and controls before the start of the meal tolerance test, indicating that the fish hydrolysates did not influence fasting glucose regulation. The mean increase in glucose was significantly smaller after 60 and 120 min in the SAL group when compared with CAS, strongly indicating a better postprandial glucose regulation in SAL, whereas HER did not seem to affect postprandial glucose regulation when compared with CAS. Postprandial regulation of glucose may be of more interest than solely looking at fasting concentrations of glucose when interpreting these findings in relation to humans, as we spend most of our time in a postprandial state. Findings in animal and clinical studies suggest that cod protein improves glucose regulation( Reference Vikoren, Nygard and Lied 12 , Reference Lavigne, Marette and Jacques 16 , Reference Pilon, Ruzzin and Rioux 17 , Reference Lavigne, Tremblay and Asselin 19 , Reference Drotningsvik, Mjos and Hogoy 21 ), but there is controversy as to the glucose-regulating effects of fatty fish or fish oil( Reference Kromhout and de Goede 4 – Reference Popp-Snijders, Schouten and Heine 6 , Reference Pilon, Ruzzin and Rioux 17 , Reference Bhathena, Berlin and Judd 57 – Reference Lara, Economou and Wallace 59 ). As both HER and SAL diets, and not CAS diet, contained taurine, it is of interest that taurine has been shown to have hypoglycaemic effect in rats, by increasing the glucose uptake without increasing insulin secretion( Reference Kulakowski and Maturo 60 ). Unfortunately, insulin was not measured during the meal tolerance test, but fasting insulin in serum from time of euthanasia was not different between CAS and fish hydrolysate groups. In line with this, no differences were seen in serum concentration of NEFA, which is regarded as a risk factor for the development of insulin resistance in humans( Reference Roden, Price and Perseghin 61 ), between CAS and fish hydrolysate groups. A possible explanation for the observed improvement of postprandial glucose regulation in SAL is that the salmon hydrolysate contained the antidiabetic motifs IPI, GPL, PGPL and VW( Reference Ben Henda, Laamari and Lanneluc 37 , Reference Umezawa, Aoyagi and Ogawa 41 – Reference Myasoedov, Lyapina and Grigorjeva 43 , Reference Matsui, Oki and Osajima 47 ). Of these motifs, IPI and PGPL may be of special interest in the current setting. IPI is the most potent dipeptidyl peptidase-IV (DPP-IV) inhibitor found to date( Reference Jao, Hung and Tung 62 ) and therefore holds potential as a possible approach for management of type 2 diabetes, and PGPL seem to protect against alloxan-induced IDDM in rats by preventing blood sugar increase( Reference Lyapina, Myasoedov and Grigorjeva 42 ).
The impact of salmon hydrolysates on cholesterol metabolism has been investigated in a range of rodent models with various results. We have previously shown that when hydrolysed salmon protein was the sole dietary protein source, the plasma concentrations of total cholesterol and HDL-cholesterol were lower in Zucker fa/fa rats but unaffected in Wistar rats when compared with rats fed a casein-based diet( Reference Wergedahl, Liaset and Gudbrandsen 14 ). In the present study, SAL did not affect serum cholesterol concentrations, whereas HER-fed rats had lower serum concentrations of HDL-cholesterol and LDL-cholesterol and tended to have lower serum total cholesterol and cholesteryl ester concentrations. It has been suggested that fish protein has a cholesterol-lowering effect because of lower ratios of methionine:glycine and of lysine:arginine( Reference Wergedahl, Liaset and Gudbrandsen 14 , Reference Kritchevsky, Tepper and Czarnecki 63 , Reference Morita, Oh-hashi and Takei 64 ). In the present study, the methionine:glycine and lysine:arginine ratios were lower in both HER and SAL diets when compared with CAS, despite no effect of SAL on serum cholesterol concentrations. In addition, dietary taurine has been shown to reduce serum cholesterol in rats by increasing the conversion of cholesterol to bile acids for faecal excretion( Reference Murakami, Nara and Yamori 65 ). Rats are able to conjugate cholic acid with both glycine and taurine, but prefer taurine( Reference Bremer 66 ), and of the diets tested in the present study the highest taurine content was found in the HER diet, and glycine content in fish hydrolysate diets was approximately twice that of CAS. Of particular interest is that the hypocholesterolemic motif IIAEK was identified in the herring hydrolysate, as we have also shown previously( Reference Pampanin, Larssen and Provan 26 ). IIAEK has been shown to have greater cholesterol-lowering capacity than β-sitosterol (on a weight-to-weight basis) in rats( Reference Nagaoka, Futamura and Miwa 35 ), and the proposed mechanism for the hypocholesterolemic effect of IIAEK is through increased cholesterol 7α-hydroxylase gene expression( Reference Morikawa, Kondo and Kanamaru 67 ). Faecal excretion of neutral and acidic steroids is the major route of cholesterol removal from the body, but despite the lowering effects of HER on serum cholesterols and the relatively high taurine intake the faecal content of bile acids and cholesterol, as well as the serum bile acid concentration, did not seem to be affected by the diet. Adding to this, no differences were seen between cholesterol contents in liver and muscle for HER- and CAS-fed rats.
The serum TAG concentration was not affected by the SAL diet, but was significantly higher in HER rats when compared with the CAS group. The effects of hydrolysed salmon and herring proteins on circulating TAG in obese Zucker rats have not been reported before, but we and others have shown that salmon hydrolysates( Reference Wergedahl, Liaset and Gudbrandsen 14 , Reference Pilon, Ruzzin and Rioux 17 , Reference Wergedahl, Gudbrandsen and Rost 68 ) and herring hydrolysates( Reference Pilon, Ruzzin and Rioux 17 ) did not affect plasma TAG concentration in Wistar rats. We have previously reported higher circulating concentration of TAG concomitantly with lower cholesterol levels in obese Zucker fa/fa rats fed normal-energy diets supplemented with fermented single-cell proteins with low lysine:arginine ratio compared with casein( Reference Gudbrandsen, Wergedahl and Liaset 69 , Reference Gudbrandsen, Wergedahl and Liaset 70 ) or soya proteins with high content of isoflavones( Reference Gudbrandsen, Wergedahl and Liaset 69 , Reference Gudbrandsen, Wergedahl and Mork 71 ), whereas others have shown that diets with low ratios of lysine:arginine reduced serum TAG concentration in Wistar rats( Reference Sugano, Ishiwaki and Nagata 72 ). The obese Zucker rats have an abnormal lipid metabolism and are hyperlipidaemic( Reference de Artinano and Castro 28 ), and TAG-rich lipoproteins from obese Zucker rats fed casein contain approximately 80 % TAG( Reference Gudbrandsen, Wergedahl and Mork 71 ). Therefore, the high serum TAG concentration in HER-fed rats is possibly because of higher level of TAG-rich lipoproteins such as VLDL, whereas the serum concentration of cholesterol-richer LDL and HDL are probably lower in HER rats.
The fatty acid compositions of the three experimental diets were identical, and no traces of long-chain n-3 PUFA were found in any of the diets. It was therefore of interest that both fish hydrolysate diets seem to affect fatty acid composition in serum. The most pronounced differences were seen in serum from HER-fed rats, with higher n-3:n-6 PUFA ratio because of the higher levels of 18 : 3n-3 and 22 : 5n-3, and lower level of 20 : 4n-6 when compared with CAS, but we did not see the same trend in liver, skeletal muscle and WAT. As we found only marginal differences in the longer n-3 PUFA in serum between the HER group and CAS, it is not likely that HER affected the desaturation and elongation of 18 : 3n-3 to the long-chain n-3 PUFA. This is supported by the findings that HER did not affect the fatty acid composition in liver, which is a quantitative important site for desaturation and elongation of PUFA. On the other hand, the concentrations of the Δ-9 desaturated MUFA 16 : 1n-7 and 18 : 1n-9 were significantly higher in HER rats (but not in SAL rats) when compared with CAS, suggesting an up-regulation of Δ-9 desaturase activity. However, no differences were seen in amounts of Δ-9 desaturated MUFA in liver, the main site of Δ-9 desaturation, in HER and SAL groups. We have previously seen higher circulating levels of Δ-9 desaturated MUFA after feeding Zucker fa/fa rats hydrolysed salmon proteins (as 100 % of protein source); but this seems not to be due to transcriptional up-regulation of stearoyl-CoA desaturase, as the hepatic stearoyl-CoA desaturase mRNA level was unaffected( Reference Wergedahl, Liaset and Gudbrandsen 14 ).
In epididymal WAT, the HER diet did not affect the fatty acid composition, but the SAL-fed rats had lower total SFA and higher total n-3 PUFA concentrations when compared with CAS, which may be regarded as beneficial effects of the SAL diet. The findings regarding fatty acids after herring or salmon hydrolysate intake in the present study differs greatly from our recent paper on cod protein diet (25 % of dietary protein as cod protein) in obese Zucker rats where we saw a higher n-3:n-6 PUFA ratio in serum, liver and WAT, possibly due to up-regulation of desaturase and elongase activities caused by increased postprandial insulin secretion( Reference Drotningsvik, Mjos and Hogoy 21 ).
To conclude, our findings show that when obese Zucker fa/fa rats were fed a diet containing herring protein hydrolysate (HER, 25 % of protein intake), this resulted in lower serum concentrations of HDL-cholesterol and LDL-cholesterol, possibly because of a high dietary content of taurine, low ratios of lysine:arginine and methionine:glycine and/or the presence of the hypocholesterolemic motif IIAEK, when compared with the CAS diet. In addition, the serum TAG and MUFA concentrations, as well as the n-3:n-6 PUFA ratio, were higher in HER rats when compared with CAS. On the other hand, when obese Zucker fa/fa rats were fed a diet containing salmon protein hydrolysate (SAL, 25 % of protein intake), the growth was greater and the postprandial glucose regulation was improved when compared with CAS, the latter possibly due to the presence of antidiabetic motifs in the salmon hydrolysate. However, although several beneficial motifs with known hypocholesterolemic and/or antidiabetic activity were identified in the herring and salmon hydrolysates, we have no information about whether these motifs exist as bioactive peptides that can be absorbed from the intestine as such, or as inactive sequences in a longer amino acid sequence. In addition, SAL rats had lower total SFA and higher total n-3 PUFA concentrations in adipose tissue when compared with CAS, but the serum fatty acid composition was only marginally affected and no effects were observed in serum lipid concentrations. In vitro enzymatic hydrolysis of proteins to small peptides results in bioactive peptides that can be absorbed directly from the intestine, and future studies should investigate the effects of fish protein hydrolysates and selected bioactive peptides identified in fish protein hydrolysates in human populations with metabolic disturbances such as obesity, type 2 diabetes and/or hypercholesterolaemia.
Acknowledgements
K.B. Øysæd and E. Larssen (IRIS) are acknowledged for their technical support in the bioactive motif identification in fish protein hydrolysates.
The present research has been supported by funding from the Bergen Medical Research Foundation and the Regional research fund of Western Norway (project no. 212625). These sponsors were not involved in the design of the study, data collection, analysis and interpretation of data, writing of the article or in the decision to submit the article for publication.
T. R., I. H. and O. A. G. formulated the research question and designed the study. R. S., A. C., T. R. and I. H. prepared the fish protein hydrolysates for the study. A. D. and O. A. G. conducted the animal study. A. D., S. A. M., D. M. P. and O. A. G. analysed the data and performed statistical analyses. O. A. G. drafted the paper and had primary responsibility for the final content. All authors have contributed to the writing and approved the final manuscript.
T. R. is employed in Nutrimar AS, which is owned by the investment company Kverva AS who also own SalMar ASA. SalMar ASA is one of the world’s largest producers of farmed salmon, and provided fresh salmon backbones for this study. I. H. is CEO and Chairman of Blue Protein, a company that commercialises new products based on fish proteins from fish by-products. Nutrimar AS, Kverva AS, SalMar ASA and Blue Protein were not involved in on-site data collection. The other authors declare no conflicts of interest.


