


1. Introduction
Thermal convection occurs ubiquitously in nature (such as in the ocean, the atmosphere, the Earth's mantle, etc.) and has wide applications in industry (such as heat exchangers, cooling devices, etc.). Rayleigh–Bénard convection (RBC), which involves a fluid layer heated from below and cooled from above, is an idealized yet effective paradigm to study the generic convection phenomenon mentioned above (see Ahlers, Grossmann & Lohse (Reference Ahlers, Grossmann and Lohse2009), Lohse & Xia (Reference Lohse and Xia2010), Chilla & Schumacher (Reference Chilla and Schumacher2012) and Xia (Reference Xia2013) for comprehensive reviews). The RBC system is characterized by three dimensionless parameters: the Rayleigh number  $Ra =\alpha g \Delta T H^{3}/(\nu \kappa )$, the Prandtl number $Pr =\nu /\kappa$ and the aspect ratio $\varGamma = L / H$, where $L$ and $H$ are the length and height of the convection cell, $\Delta T$ is the temperature difference across the fluid layer, $g$ is the gravitational acceleration and $\alpha$, $\nu$ and $\kappa$ are, respectively, the volume expansion coefficient, kinematic viscosity and thermal diffusivity of the fluid.
A fascinating feature of RBC is the existence of the well-defined large-scale circulation (LSC or main vortex) which has the size of the convection cell (Krishnamurti & Howard Reference Krishnamurti and Howard1981; Cioni, Ciliberto & Sommeria Reference Cioni, Ciliberto and Sommeria1997; Xi, Lam & Xia Reference Xi, Lam and Xia2004). It is found that LSC can spontaneously and randomly reverse its flow direction. Due to its putative connection to various similar reversal phenomena existing in the atmosphere (Van Doorn et al. Reference Van Doorn, Dhruva, Sreenivasan and Cassella2000), and in the outer core of the Earth (Glatzmaier et al. Reference Glatzmaier, Coe, Hongre and Roberts1999), the reversal of LSC has attracted much attention over the last two decades (Sreenivasan, Bershadskii & Niemela Reference Sreenivasan, Bershadskii and Niemela2002; Araujo, Grossmann & Lohse Reference Araujo, Grossmann and Lohse2005; Benzi Reference Benzi2005; Brown & Ahlers Reference Brown and Ahlers2007; Xi & Xia Reference Xi and Xia2007; Liu & Zhang Reference Liu and Zhang2008; Sugiyama et al. Reference Sugiyama, Ni, Stevens, Chan, Zhou, Xi, Sun, Grossmann, Xia and Lohse2010; Assaf, Angheluta & Goldenfeld Reference Assaf, Angheluta and Goldenfeld2011; Vasilev & Frick Reference Vasilev and Frick2011; Chandra & Verma Reference Chandra and Verma2013; Huang et al. Reference Huang, Wang, Xi and Xia2015; Ni, Huang & Xia Reference Ni, Huang and Xia2015; Podvin & Sergent Reference Podvin and Sergent2015; Wang et al. Reference Wang, Xia, Wang, Sun, Zhou and Wan2018; Castillo-Castellanos et al. Reference Castillo-Castellanos, Sergent, Podvin and Rossi2019; Chen et al. Reference Chen, Huang, Xia and Xi2019; Chen, Wang & Xi Reference Chen, Wang and Xi2020; Xu, Chen & Xi Reference Xu, Chen and Xi2021; Zhang et al. Reference Zhang, Chen, Xia, Xi, Zhou and Chen2021; Zhao et al. Reference Zhao, Wang, Wu, Chong and Zhou2022). In spite of extensive studies, a good understanding regarding the reversal of LSC is still elusive. According to previous studies, the reversal of the LSC is accomplished as follows: the two corner vortices which develop in diagonally opposing corners grow in size and amplitude, squeeze and break up the main vortex (Sugiyama et al. Reference Sugiyama, Ni, Stevens, Chan, Zhou, Xi, Sun, Grossmann, Xia and Lohse2010), then these developed corner vortices connect to each other and form a new main vortex (or LSC) and the two small vortices originating from the breaking of the main vortex now sit in another pair of diagonally opposing corners. In this way a reversal is accomplished. Through flow visualization (Sugiyama et al. Reference Sugiyama, Ni, Stevens, Chan, Zhou, Xi, Sun, Grossmann, Xia and Lohse2010; Chandra & Verma Reference Chandra and Verma2013; Kar et al. Reference Kar, Kumar, Das and Lakkaraju2020; Xu et al. Reference Xu, Chen and Xi2021), one can find that the above-mentioned two stages of reversal (breaking and reconnection) both take place at the central region of the convection cell. Hence it is natural to ask how an obstructed cell centre affects the reversal process as the obstruction at the centre may affect the breaking and reconnection processes.
Besides, it is also interesting to see whether an obstructed centre modifies the heat transport process of RBC. This topic has received significant interest, as evidenced by a variety of experimental attempts, including: inserting artificial structures into the convection domain (Zhang & Xia Reference Zhang and Xia2023), resulting in enhanced heat transfer and a stronger flow field simultaneously; laterally confining the convection cell (Huang et al. Reference Huang, Kaczorowski, Ni and Xia2013), which led to a notable heat transfer enhancement achieved by replacing the LSC with a plume-controlled flow field; removing the core region from a cylindrical cell, where Xie, Ding & Xia (Reference Xie, Ding and Xia2018) revealed a flow topology transition of the LSC from a high-heat-transfer-efficiency quadrupole state to a less symmetric dipole state with a lower heat-transfer efficiency. In the above-mentioned studies, heat transfer enhancement is accompanied by a change in the flow topology. In contrast to the above, some experiments have shown that even though the flow topology is strongly modified, the heat transfer efficiency remains almost unchanged. For instance, Ciliberto, Cioni & Laroche (Reference Ciliberto, Cioni and Laroche1996) added eight thin Plexiglas screens near the top and bottom plates (four of each) of the convection cell, effectively suppressing or strongly modifying the large-scale flow, with no substantial variation observed in heat transport. A similar result was also reported by Xia & Lui (Reference Xia and Lui1997). They conducted experiments on turbulent thermal convection with staggered fingers on the sidewall, resulting in a mean flow featuring a twisted, asymmetric four-roll circulation instead of the LSC, yet with only minor differences in heat transport efficiency. Based on previous results, it appears that when the flow is highly chaotic, any obstruction that leads to a more coherent flow leads to an enhanced heat transfer, whereas an obstruction of the large-scale mean flow which does not lead to a more coherent flow also does not lead to a heat transport enhancement.
Recently some studies implied that heat transfer modification is primarily linked to the thermal boundary layers, while modifying the thermal boundary layer may not necessarily result in significant changes to the large-scale flow structure. Consequently, one efficient approach to enhance heat transfer is by directly perturbing the thermal boundary layers. This can be achieved through methods such as by introducing rough surfaces (Du & Tong Reference Du and Tong1998; Wei et al. Reference Wei, Chan, Rui, Zhao and Xia2014; Xie & Xia Reference Xie and Xia2017), inserting plates (Bao et al. Reference Bao, Chen, Liu, She, Zhang and Zhou2015; Liu & Huisman Reference Liu and Huisman2020), tilting the convection cell (Zwirner & Shishkina Reference Zwirner and Shishkina2018; Zwirner et al. Reference Zwirner, Khalilov, Kolesnichenko, Mamykin, Mandrykin, Pavlinov, Shestakov, Teimurazov, Frick and Shishkina2020) or introducing a vibration (Wang, Zhou & Sun Reference Wang, Zhou and Sun2020). Moreover, heat transfer can also be enhanced through other means, such as introducing phase changes (Lakkaraju et al. Reference Lakkaraju, Stevens, Oresta, Verzicco, Lohse and Prosperetti2013; Wang, Mathai & Sun Reference Wang, Mathai and Sun2019), changing the properties of the working fluids (Buongiorno Reference Buongiorno2009; Benzi & Ching Reference Benzi and Ching2018) or shearing the boundaries (Xu, Xu & Xi Reference Xu, Xu and Xi2023).
Given that the obstruction in our study is located far from both the top and bottom boundaries, we anticipate that the thermal boundary layers at these boundaries are minimally affected by the obstruction. Consequently, it is of great interest to investigate how the global heat transfer process responds to the presence of the obstruction.
In this paper, we present an experimental study using a quasi-two-dimensional rectangular cell with a cylindrical obstruction at the cell centre as shown in figure 1. We study how the obstructed centre modifies the heat transfer, flow topology and reversal of the LSC. It is found that heat transfer is greatly enhanced especially in the low- $Ra$ regime, while the reversal of the LSC is greatly reduced. Detailed particle image velocimetry (PIV) measurements reveal that the enhancement of the heat transfer and reduction of the flow reversal rate are all originated from the topology change of the LSC due to the addition of the obstruction at the centre of the convection cell.

Figure 1. Schematic illustration of the convective cell with its centre obstructed by a cylinder. Right: side view.
The rest of the paper is organized as follows. In § 2, we describe the experimental set-up. In § 3, we present the experimental results and discussions. Finally, the conclusions of the study are drawn in § 4.
2. Experimental set-up
Two convection cells of different sizes were used in our experiments. The details of the two cells have been described elsewhere (Chen et al. Reference Chen, Huang, Xia and Xi2019, Reference Chen, Wang and Xi2020). The convection cell consists of copper top and bottom plates and a Plexiglas sidewall. The height ( $H$), length ( $L$) and width ( $W$) of the small (large) cell are $6.3$ cm ( $12.6$ cm), $6.3$ cm ( $12.6$ cm) and $1.9$ cm ( $3.8$ cm), respectively. Thus, the two cells both have fixed aspect ratios which are $\varGamma = L/H = 1$ and $\varGamma _{lateral} = W/L = W/H = 0.3$. The temperature of the top plate is controlled by a refrigerated circulator (Polyscience PP15R-40-A12Y) which constantly removes heat from the top plate through the chambers embedded in it. The temperature stability of the refrigerated circulator is $0.005\,^{\circ }$C. Two silicon rubber film heaters connected in series are sandwiched to the backside of the bottom plate to provide constant and uniform heating. A DC power supply (Xantrex XFR 300-9) with $99.99\,\%$ long-term stability is used to provide the heating power. Twelve thermistors of 2.5 mm in diameter embedded in the top and bottom plates are used to measure the temperatures. The arrangement of the six thermistors in each plate can be seen in figure 1. Six thermistors in each plate are divided into three pairs, and they are equally spaced along the $L$ direction at $L/4$, $L/2$ and $3L/4$ from left to right. The two thermistors in each pair are $W/4$ away from the central line in the $W$ direction.
To manipulate the main vortex of the flow we obstruct the central region of the cell by gluing a solid Plexiglas cylinder at the centre of the cell, as schematically shown in figure 1. The thickness of the cylinder insert equals the width  $W$ of the cell; thus there is no gap between the cylinder and the front and back sidewalls. To understand how the main vortex reacts to the size of the cylindrical obstruction, we have used cylinders with different diameters: $D = 0.1L$, $0.2L$, $0.5L$ and $0.8L$. The thermal conductivity of the Plexiglas is around $0.19\ {\rm W}\ ({\rm m}\, {\rm K})^{-1}$ at $20\,^{\circ }$C, which is about one-third of that of water, and is even smaller than the effective thermal conductivity due to the convection of water. Thus the heat transfer between the fluid and the cylinder insert is negligible and cannot account for the heat transfer enhancement that we show in § 3.1. The working fluid is degassed water with mean temperature of $28\,^{\circ }$C, which gives $Pr = 5.7$ and the experiments were conducted over the $Ra$ range of $2\times 10^7$ to $2\times 10^9$. To reduce the influence of surrounding temperature fluctuations and minimize heat leakage, during the heat transport measurements, the convection cell was wrapped with 4 cm thick Styrofoam sheets for thermal insulation. In addition, the cell was placed above a copper basin, which contains three layers of wood to prevent heat leakage. Under the basin, a heater was placed to keep the temperature of the basin and bottom plate the same. Finally, the whole convection cell and the basin were placed in a home-made thermostat, where the temperature of the thermostat is set to the temperature of the centre of the convection cell.
The PIV technique is used to measure the flow field in the vertical mid-plane in the RBC cell. All the PIV measurements were conducted in the thermostat box. The PIV system consists of a dual Nd:YAG laser (Beamtech Vlite-200) with a power output of 200 mJ per pulse, a CCD camera (Flowsense EO 4M) with 16-bit dynamic range and spatial resolution of  $2048 \times 2048$ pixels, a synchronizer and control software that includes a PIV analysis platform (Dantec Dynamic Studio). A laser sheet with a thickness of approximately $1$ mm illuminates the seed particles in the vertical mid-plane of the RBC cell. The seeding particles are $5\ \mathrm {\mu }$m polyamide seeding particles, with a density of $1.02\unicode{x2013}1.05\ {\rm g} \ {\rm cm}^{-3}$. The volume fraction of the seeding particles is less than $0.1\,\%$. The seeding particles do not influence the flow topology. During the calculation of the velocity map, we applied a mask to snapshots to exclude the cylindrical obstruction. The diameter of the mask equals the size of the cylindrical obstruction. Each snapshot was adaptively (Adaptive PIV method provided by Dantec) divided into an interrogation area of $64 \times 64$ pixels with a $50\,\%$ overlap. Each vector corresponds to a region of $32 \times 32$ pixels. The number of velocity vectors and the spatial resolution in both the $x$ and the
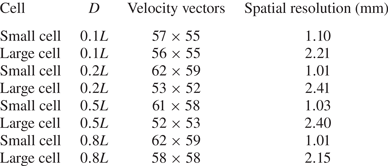
  $z$ directions of the calculated velocity map for four different cylindrical obstruction can be found in table 1. Here for simplicity the number of velocity vectors includes the zero-velocity vectors inside the cylinder insert. Each PIV measurement lasted for at least 2 hours and at least 7200 snapshots were acquired at a sampling rate of 1 Hz.
Table 1. The number of velocity vectors and the spatial resolution of the velocity map for the four different cylindrical obstructions.
3. Results and discussion
3.1. Heat transfer features
We first study the effect of the obstructed centre on the heat transport efficiency of the system. Figure 2(a) shows a log–log plot of Nusselt number  $Nu$ as a function of $Ra$ for the four different cylindrical obstructions. Here, $Nu$ is calculated by $Nu = Q/(\lambda \Delta T/H)$, where $Q$ is the heat flux, which is the power provided by the heaters embedded in the bottom plate divided by its surface area, and $\lambda$ is the thermal conductivity of the working fluid. For comparison, we also plot the Nusselt number $Nu_0$ measured in the normal (unobstructed) cell (Chen et al. Reference Chen, Huang, Xia and Xi2019), and it can be described well by a single power law: $Nu_0 \sim Ra^{0.30}$. It can be clearly seen from figure 2(a) that when the cell centre is obstructed, the heat transport efficiency $Nu$ exhibits an overall enhancement, especially in the low- $Ra$ range. To gain a clearer insight of how the cylindrical obstruction affects the heat transport efficiency, we plot the normalized Nusselt number ( $Nu/Nu_0$) as a function of $Ra$, as shown in figure 2(b). The value of $Nu_0$ used to compensate $Nu$ in figure 2(b) is determined from a power-law fit of measured $Nu_0$. We can see that in the low- $Ra$ range, $Nu$ is greatly enhanced, the maximal enhancements being roughly $21\,\%$, $16\,\%$, $3\,\%$ and $8\,\%$, respectively, for $D = 0.8L$, $0.5L$, $0.2L$ and $0.1L$. The error bars shown in figure 2 represent the root-mean-square values of $Nu$. As can be seen in figure 2(a), the error is very small which remains inside the symbols. Even though the error bars in figure 2(b) appear to be larger, it is essential to note that the magnitude of the heat transfer enhancement cannot be attributed to the uncertainty. It also should be mentioned that the enhancement of $Nu$ in the low- $Ra$ range exhibits a non-monotonic decrease with a decrease of the diameter of cylinder obstruction and the $D = 0.2L$ case, rather than the $D = 0.1L$ case, gives a minimum enhancement of $Nu$. And with an increase of $Ra$, the enhancement becomes weaker and $Nu$ eventually converges to $Nu_0$. The obstructed cell centre does not always result in an enhancement of $Nu$: one can see that for the $D = 0.2L$ case, in the range of $10^8 \leq Ra \leq 2 \times 10^8$ $Nu$ shows a reduction of up to $3\,\%$ of heat transfer which is not observed in the $D = 0.8L$ and $D = 0.5L$ cases.

Figure 2. (a) Log–log plot of  $Nu$ as a function of $Ra$ measured in the centre-obstructed cell. Here $Nu_0$ measured in the unobstructed normal cell is also plotted for comparison. (b) Semi-log plot of $Nu/Nu_0$ as a function of $Ra$.
$Ra$.
It is unforeseen and rather counterintuitive to see such a large enhancement of heat transport for the  $D = 0.8L$ case, because in this case about $50\,\%$ of the volume of the cell is obstructed by the cylindrical obstruction and only about $50\,\%$ of working fluid (compared with the unobstructed case) works as heat carrier to transport the heat from bottom plate to top plate. Similar heat transport enhancement with less working fluid was also revealed by Huang et al. (Reference Huang, Kaczorowski, Ni and Xia2013). They found the heat transport efficiency is greatly enhanced by introducing lateral confinement to the cell, i.e. by keeping the length and height of the cell unchanged, but decrease the width of the convection cell and correspondingly change the lateral aspect ratio $\varGamma _{lateral}$. A $15\,\%$ heat transport enhancement is achieved by confining the convection cell from $\varGamma _{lateral} = 0.6$ to $0.1$. It is worth emphasizing that this $21\,\%$ heat transfer enhancement is achieved by a simple obstruction inserted into the convection cell.
3.2. Flow topology
To reveal how this enhancement of heat transfer efficiency is achieved, we look closely into the flow structures in the convection cells with cylindrical obstructions. Figure 3 shows the evolution of the typical flow fields with increasing diameter of the cylindrical obstruction around three typical  $Ra$ values, and the flow fields presented here are averaged over a short time period of one LSC turnover time $t_{E}$ to better illustrate the flow topology. Here, $t_{E}$ is obtained from the cross-correlation of temperature signals inside the top and the bottom plates. We first focus on figure 3(a–c), which shows the flow evolution with $Ra$ in the normal cell. When $Ra$ is small ( $Ra = 6.36 \times 10^7$), the flow consists of four small rolls at each corner (see figure 3a), which is referred to as a four-roll state (FRS). It should be mentioned that the FRS shown here is not the outcome of superposition of two flow fields with opposite flow directions (Chong et al. Reference Chong, Wagner, Kaczorowski, Shishkina and Xia2018). The average time used to compute figure 3(a) is 80 s. In fact, the FRS is quite stable over the entire measurement duration. Even if we average the flow field over the entire measurement period, the average flow field remains unchanged as the FRS. It is worth noting that, according to the study by Chandra & Verma (Reference Chandra and Verma2013), the direction of the FRS cannot change due to the symmetry feature in the system. When $Ra$ increases to $Ra = 1.87 \times 10^8$, as shown in figure 3(b), the flow takes a form of a tilted-ellipse-shape single roll with two small rolls enclosed inside and two other small corner rolls diagonally sitting in opposite corners, which is named an abnormal single-roll state (ASRS) (Chen et al. Reference Chen, Huang, Xia and Xi2019). When $Ra$ further increases to $Ra = 7.94 \times 10^8$, it can be seen from figure 3(c) that the flow structure is made up of a tilted-ellipse-shape single roll without any substructures in it and two corner rolls diagonally sitting in opposite corners, this kind of flow structure being referred to as a single-roll state (SRS). This transition from FRS to ASRS and then to SRS in the normal cell was previously observed by Chen et al. (Reference Chen, Huang, Xia and Xi2019).
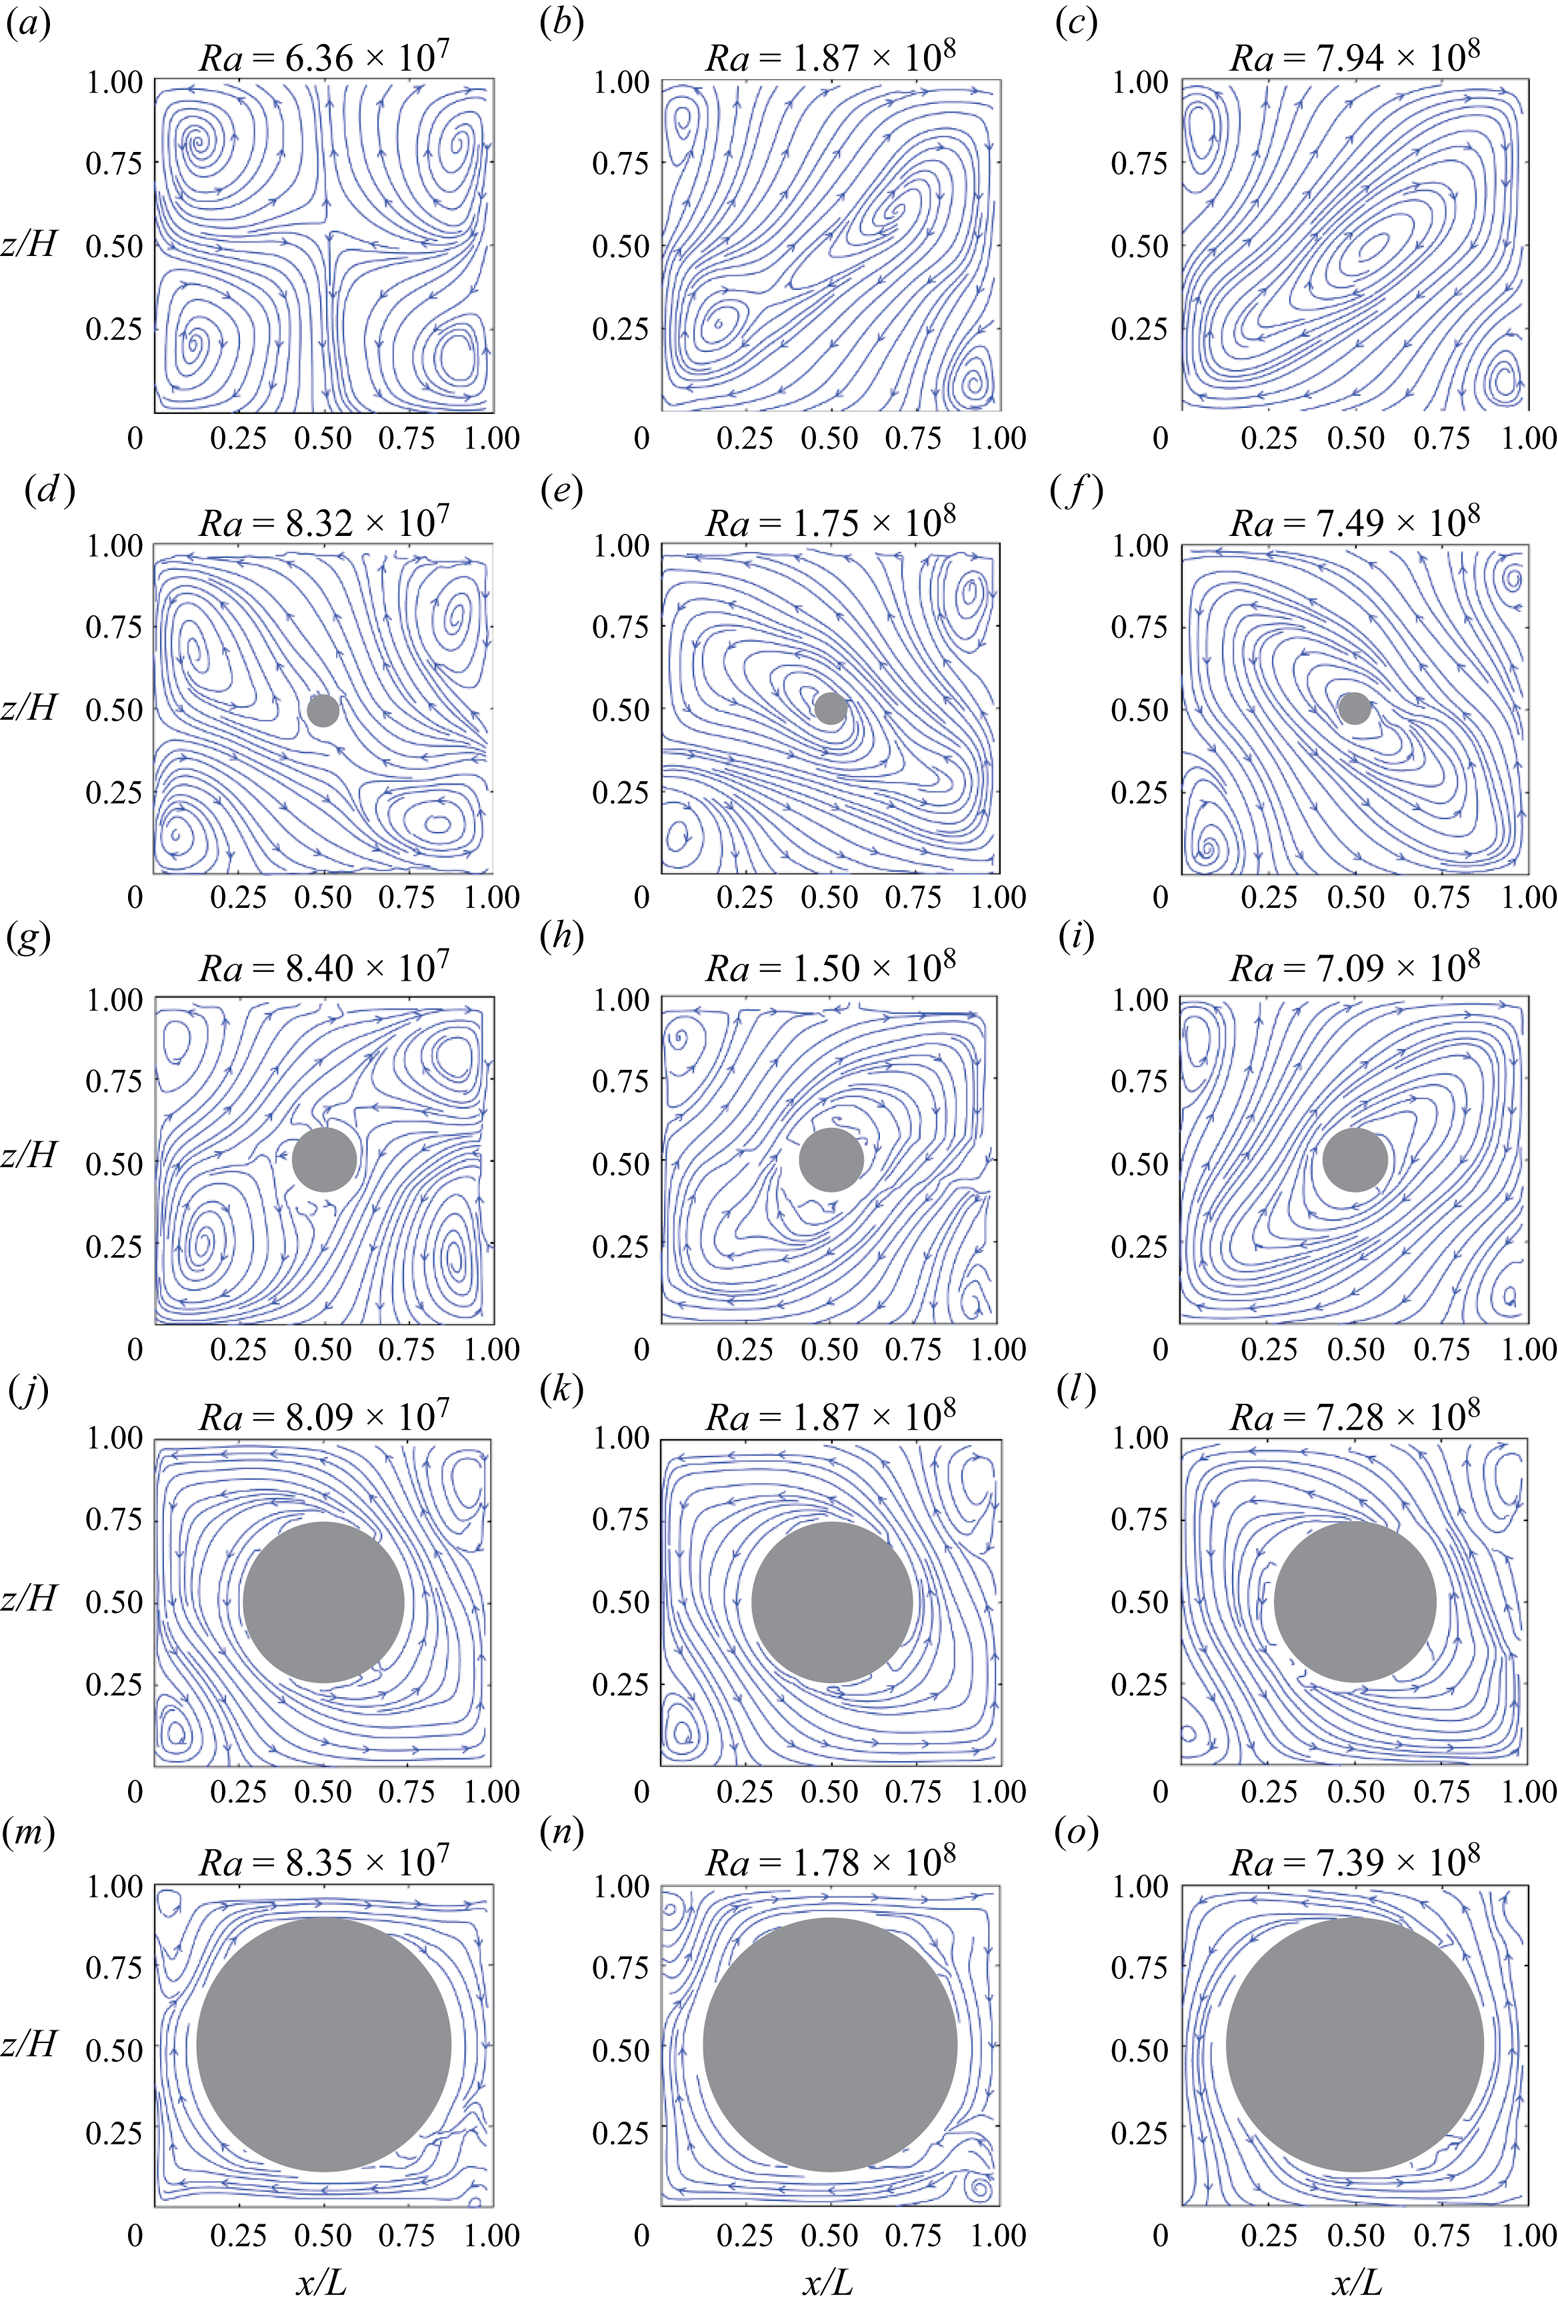
Figure 3. Evolution of flow topology in cells with obstructed centre with different size of obstruction at/around the three typical  $Ra$ values. The flow topology is illustrated by the streamlines of the short-time-averaged velocity field (averaged within one LSC turnover time $t_E$). The diameter of the cylindrical insert is (a–c) $0$ (normal cell), (d–f) $0.1L$, (g–i) $0.2L$, (j–l) $0.5L$ and (m–o) $0.8L$.
We then examine how the flow topology is modified by the cylindrical obstruction in the low- $Ra$ range ( $Ra$ is around $1 \times 10^8$). In this low- $Ra$ range the flow is in the FRS in the normal cell as shown in figure 3(a). One can clearly see from figure 3(d) that the flow becomes an ASRS when the $D = 0.1L$ cylindrical obstruction is present. For the $D = 0.2L$ case (figure 3g), the flow also takes the form of an ASRS. When the diameter of the cylinder further increases ( $D = 0.5L$, figure 3i), the flow pattern becomes a single-roll form without any substructures, i.e. SRS, and the corner rolls can also be clearly observed. If the diameter of the cylinder becomes even larger ( $D = 0.8L$, figure 3m), due to the large volume of the central region being obstructed by the cylinder, the hot (cold) plumes are forced to move up (down) peripherally with two smaller but visible corner vortices located at top-left and bottom-right corners. We conclude that in the low- $Ra$ range, the presence of the cylindrical obstruction promotes the transition of the flow from FRS to ASRS (when the cylindrical obstruction is small), and from FRS to the SRS (when the cylindrical obstruction is large). We then study the modification of the flow topology due to the cylindrical obstruction in the intermediate- $Ra$ range ( $Ra$ around $2 \times 10^8$). At this $Ra$, the flow field is in the ASRS in the normal cell. When the $D = 0.1L$ cylindrical obstruction is present (figure 3e), the flow field is promoted to the SRS. When $D$ increases to $0.2L$ (figure 3h), the main vortex becomes stronger and the two corner vortices become smaller. When $D$ further increases to $0.5L$ and $0.8L$ (figure 3k,n), the hot (cold) plumes are forced to move up (down) peripherally with two very small corner vortices. We conclude that in the intermediate- $Ra$ range, the presence of the cylindrical obstruction promotes the transition of the flow from ASRS to the SRS. When it comes to the large- $Ra$ range, the modification of flow topology is less significant, as shown in the third column of figure 3. One can see that the flow stays in the SRS when $D$ increases from $0.1L$ to $0.8L$, but with the increase of $D$, the main vortex becomes stronger, and the corner vortices become weaker.
Now, with the observed change in flow topology due to the presence of the obstruction, we can understand how the heat transport enhancement is achieved. For low  $Ra$, i.e. $Ra \leq 1 \times 10^8$, a previous study has shown that in this regime the FRS dominates the flow field (Chen et al. Reference Chen, Huang, Xia and Xi2019). While when the centre of the cell is obstructed, FRS is replaced by ASRS or SRS (depending on the diameter of cylindrical obstruction). It has been shown that the SRS is more efficient in heat transfer than the FRS (Xu et al. Reference Xu, Chen, Wang and Xi2020, Reference Xu, Xu and Xi2023); thus this change of flow topology from FRS to ASRS/SRS leads to a prominent heat transfer enhancement in the low- $Ra$ regime. For high $Ra$, i.e. $Ra \geq 5 \times 10^8$, heat transfer measurements indicate that no significant enhancement is observed and this can be explained by the fact that in this regime the flow topology does not change much (always in SRS) when the cell centre is obstructed. In the normal cell, the LSC mostly moves in the periphery of the cell (Xia, Sun & Zhou Reference Xia, Sun and Zhou2003), and very few plumes travel through the central region directly; thus the obstruction added at the central region has negligible effects on the flow.
To quantitatively study the changes in flow topology due to the addition of the cylindrical obstructions, we decompose the measured PIV velocity field using Fourier mode decomposition. Fourier mode decomposition has been widely used in the RBC community to study the evolution of flow topology (Chandra & Verma Reference Chandra and Verma2013; Wagner & Shishkina Reference Wagner and Shishkina2013; Chong et al. Reference Chong, Wagner, Kaczorowski, Shishkina and Xia2018; Wang et al. Reference Wang, Xia, Wang, Sun, Zhou and Wan2018; Chen et al. Reference Chen, Huang, Xia and Xi2019, Reference Chen, Wang and Xi2020). Here we briefly introduce some key points of Fourier mode decomposition. By projecting the flow field  $(u_x, u_z)$ onto the following artificially constructed Fourier basis:
 $$\begin{gather} u_x^{m,n} = 2\sin (m{\rm \pi} x)\cos (n{\rm \pi} z), \end{gather}$$
 $$\begin{gather}u_z^{m,n} ={-} 2\cos (m{\rm \pi} x)\sin (n{\rm \pi} z), \end{gather}$$
where  $m, n = 1, 2, 3$ are considered, we can obtain the corresponding amplitude ${A^{m,n}}(t) = {\langle {{u_x}(t)u_x^{m,n}} \rangle _{x,z}} + {\langle {{u_z}(t)u_z^{m,n}} \rangle _{x,z}}$ of Fourier mode $(m,n)$. Here $x$ and $z$ are in units of $L$. To apply Fourier mode decomposition in the centre-obstructed cell, we set the velocity vectors inside the obstructed centre to be zero. Here the Fourier mode $(m,n)$ corresponds to the flow field with $m$ rolls in the $x$ direction and $n$ rolls in the $z$ direction (see their schematic patterns in figure 4a–d) . For example, the ( $1,1$) mode represents a single-roll flow mode which has one roll in both $x$ and $z$ directions. As the first four flow modes, i.e. ( $1,1$), ( $2,1$), ( $1,2$), ( $2,2$), usually contain most of the energy in the flow, in practice we mainly focus on how these four Fourier modes evolve with $Ra$.
$Ra$.
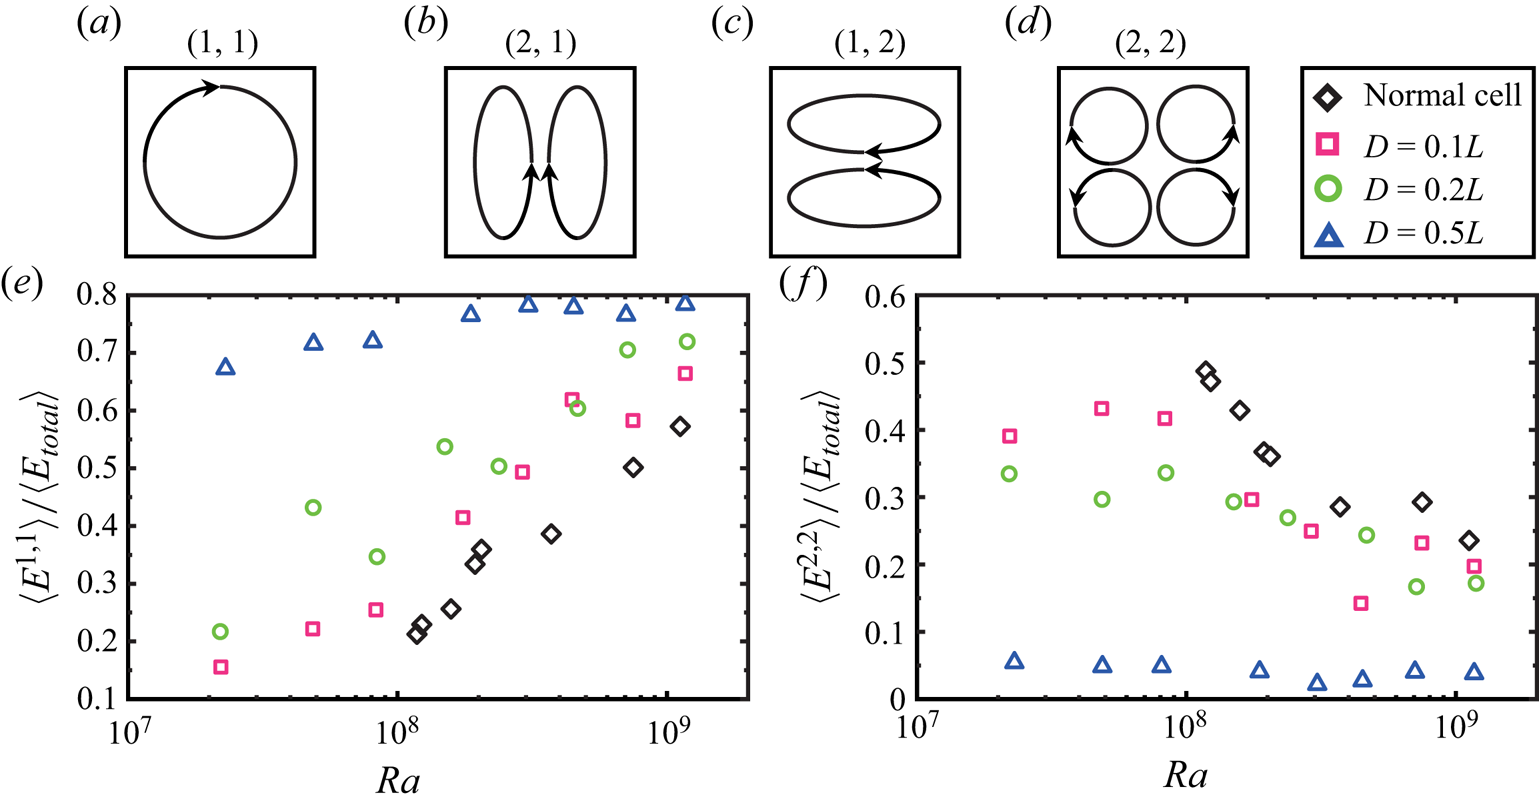
Figure 4. (a–d) Schematic patterns of the first four Fourier modes of the flow in the convection cell. Time-averaged energy contained in the ( $1, 1$) mode (e) and in the ( $2, 2$) mode (f) as a function of $Ra$ for different diameter $D$ of the obstruction at the cell centre.
In figure 4(e), we plot the energy contained in the ( $1,1$) flow mode $\langle E_{1,1} \rangle$ (normalized by the total flow energy $\langle E_{total}\rangle$) as a function of $Ra$ measured in different cases. Here, the energy contained in each of the Fourier modes is defined as $E^{m,n}(t) = {[A^{m,n}(t)]}^2$ (Xi et al. Reference Xi, Zhang, Hao and Xia2016). First of all, we can clearly see that the energy contained in the ( $1,1$) mode increases with increasing $Ra$ in both the normal cell and the centre-obstructed cell. Besides, in the centre-obstructed cells, more and more energy is contained in the ( $1,1$) mode than that in the normal cell, which implies that the main vortex is more and more energetic, especially for low $Ra$. For example, when the diameter of the cylinder insert is $D = 0.5L$, more than $70\,\%$ of energy is in the ( $1,1$) mode at $Ra \simeq 1 \times 10^8$, while in the normal cell, only $20\,\%$ of energy is in the ( $1,1$) mode. Here we do not have the data for the $D = 0.8L$ case, due to the fact that in this case the majority of the area of the cell is obstructed by the cylinder. Similarly in figure 4(f), we plot the energy contained in the ( $2,2$) mode $\langle E_{2,2} \rangle$ as a function of $Ra$ measured in different cases. It is found that the energy contained in the ( $2,2$) mode decreases with increasing $Ra$ in both the normal cell and the centre-obstructed cell. Besides, in the centre-obstructed cells, less energy is contained in the ( $2,2$) mode than that in the normal cell, which implies that the corner vortices are less energetic in the centre-obstructed cell, especially for low $Ra$.
$Ra$.
From the analysis above we have found a positive correlation between the ( $1,1$) mode and $Nu$, i.e. the enhancement of $Nu$ is due to the stronger ( $1,1$) mode as this mode is more efficient for heat transfer. Similarly we have found a negative correlation between the ( $2,2$) mode and $Nu$, i.e. the enhancement of $Nu$ is also due to the weaker ( $2,2$) mode as this mode is less efficient for heat transfer. As a result, in the low- $Ra$ range, we would expect that the enhancement of $Nu$ would decrease with diameter $D$ of the cylindrical obstruction. While the data for $D= 0.2L$ are not consistent with our expectation, the $Nu$ enhancement for $D= 0.2L$ is less than that for $D= 0.1L$. Obviously the change in flow topology (FRS is replaced by ASRS or SRS) alone cannot account for this non-monotonic decrease of maximum heat transport enhancement with decreasing $D$. The net viscous damping imposed by the cylinder surface ( $A_{vis}$) very likely plays a role. The net viscous damping can be simply evaluated by the net increased surface area induced by the cylindrical obstruction, which is $(0.3L {\rm \pi}D - 0.5 {\rm \pi}D^2) = 0.5 {\rm \pi}(0.6LD - D^2)$, where $0.3L {\rm \pi}D$ is the curved surface area of the cylinder which is directly exposed to the working fluid and $0.5 {\rm \pi}D^2$ is the area of the two flat end surfaces of the cylinder which are exposed to the working fluid. As $A_{vis} \sim 0.6LD - D^2$, it is a quadratic function. The maximum $A_{vis}$ occurs at $D = 0.3L$, where the viscous damping would be the strongest. As a result, the heat transfer efficiency $Nu$ would be reduced the most. When $D$ becomes larger or smaller than $0.3L$, $A_{vis}$ decreases; thus the reduction of $Nu$ due to the viscous damping would be less. With the combined effects of the monotonic increase of the coherence of the flow and the quadratic dependence of the increased net surface area with the diameter of the cylinder, now we can understand why the $D = 0.2L$ case, instead of the $D = 0.1L$ case, gives the minimum heat transport enhancement. Certainly, the evaluation of net viscous damping here is quite crude and we do not take the change of flow topology into account, but the simple assumption generally explains our experimental results.
3.3. Flow reversals
In this section, we study how the reversal of the LSC is affected by the obstruction at the cell centre. To detect the reversal of the LSC, we use the temperature contrast method (Sugiyama et al. Reference Sugiyama, Ni, Stevens, Chan, Zhou, Xi, Sun, Grossmann, Xia and Lohse2010; Ni et al. Reference Ni, Huang and Xia2015; Huang & Xia Reference Huang and Xia2016; Chen et al. Reference Chen, Huang, Xia and Xi2019), i.e. identify the reversal event through the temperature contrast  $\delta _T = T_{{left}} - T_{{right}}$, where $T_{{left}}$ and $T_{{right}}$ are the temperatures measured by the thermistors embedded on the left- and right-hand sides of the bottom plate. We employed commonly used threshold criteria, just as in many previous studies (Huang & Xia Reference Huang and Xia2016; Chen et al. Reference Chen, Huang, Xia and Xi2019, Reference Chen, Wang and Xi2020). The criteria, which are based on the amplitude and duration of the temperature contrast $\delta _T$, are the following. The first criterion is that the two circulation states of the LSC (clockwise direction and counter-clockwise direction) should be clearly distinguished from each other. This implies that the probability distribution function (PDF) of $\delta _T$ should have two peaks (two most probable values) with each peak corresponding to one circulation state, and the distance between the two peaks in the PDF should be larger than the root-mean-squared value of $\delta _T$, so that the two peaks can be clearly distinguished. The second criterion is that when the flow changes from one state to the other, $\delta _T$ should first cross over the peak corresponding to the current state then cross over the peak corresponding to the other state, i.e. the value of $\delta _T$ should be larger (smaller) than the higher (lower) peak value of $\delta _T$ in the PDF. The third criterion is that the flow should stay at the new state for more than one turnover time of the LSC. Figure 5 shows 50-hour-long time traces of temperature contrast $\delta _T$ measured in cells with four different sizes of cylindrical obstructions. From top to bottom, the diameter of cylindrical obstruction increases from $D = 0.1L$ to $D = 0.8L$. One can easily see that with increasing $D$, it is harder for reversal to occur. To compare, it was previously found in normal cells (Chen et al. Reference Chen, Huang, Xia and Xi2019), for $Ra = 1.1 \times 10^8$, $Pr = 5.7$, that more than 100 flow reversals occur in a single day. With the $D = 0.1L$ cylindrical obstruction, there are still 37.5 reversals within a day on average. When the diameter of the cylindrical obstruction increases to $D = 0.2L$, only 14 reversals have been identified in 50 hours. When $D$ becomes $0.5L$ and $0.8L$, no reversal can be observed in the 50-hour-long measurements. In addition to the reduced flow reversal rates, one can also observe the larger magnitude of $\delta _T$ in figure 5(d). This larger magnitude results from the much more coherent flow structure induced by the $0.8L$ obstruction, which is shown in figure 3.

Figure 5. Time traces of temperature contrast  $\delta _T$ for different diameter $D$ of the cylindrical obstruction but almost the same $Ra$: (a) $Ra = 9.74 \times 10^7$, $D = 0.1L$; (b) $Ra = 9.12 \times 10^7$, $D = 0.2L$; (c) $Ra = 9.41 \times 10^7$, $D = 0.5L$; (d) $Ra = 9.51 \times 10^7$, $D = 0.8L$. The dashed lines in (a,b) indicate the two flow states.

Figure 6. Flow reversal frequency  $f$ (normalized by $1/t_E$) as a function of $Ra$ for the $D = 0.1L$ obstruction. Reversal frequency measured in a normal cell (Chen et al. Reference Chen, Huang, Xia and Xi2019) is also plotted for comparison. The two lines are the power-law fits to the normal cell data and the centre-obstructed cell data and the vertical dashed lines indicate the two transitional $Ra$ values, respectively.
It was previously found that the flow reversal frequency decreases in a power-law manner with increasing  $Ra$ (Chen et al. Reference Chen, Huang, Xia and Xi2019), while even at the lowest $Ra$ in our experiments, the reversal frequencies of $D = 0.2L$, $0.5L$ and $0.8L$ cases are very low; therefore it is time-consuming to acquire enough reversal statistics for these cases. In our measurements, in cases with higher reversal frequency (with low $Ra$ or small $D$), we typically require at least 100 reversal events for analysis. However, for those cases with lower reversal frequency (high $Ra$ or large $D$), acquiring a large number of reversal events can be extremely challenging. In such a situation, we extend the measurement to at least two days to obtain at least five events. Thus below we only show the results of reversal frequency measured in the $D = 0.1L$ case. Figure 6 shows the normalized reversal frequency $f$ as a function of $Ra$ for $D = 0.1L$, $Pr = 5.7$, where $f$ is defined as the average number of reversal events per second. To compare the reversal frequency $f$ measured from different cells, we use $1/t_E$ to non-dimensionalize the data. For comparison, the data measured in the normal cell are also plotted. The first feature one can see from figure 6 is that the reversal frequency is greatly reduced in cells with an obstructed central region, reduced by $80\,\%$ on average. The second feature one can see is that $f$ in the $D = 0.1L$ cell decreases with $Ra$, i.e. it is harder for reversal to occur with increasing $Ra$, which is consistent with that in the normal cell (Sugiyama et al. Reference Sugiyama, Ni, Stevens, Chan, Zhou, Xi, Sun, Grossmann, Xia and Lohse2010; Chen et al. Reference Chen, Huang, Xia and Xi2019) and also in a corner-less cell (Chen et al. Reference Chen, Wang and Xi2020). Meanwhile, one can see that $f$ in the $D = 0.1L$ cell extends to lower $Ra$ range which agrees with the flow topology change due to the central obstruction. In this low- $Ra$ range in the normal cell the flow is in the FRS, and thus there is no reversal of the flow. In the centre-obstructed cell the FRS is promoted to the SRS, and thus flow reversal is possible. The third feature one can see is that, similar to the normal cell case, the reversal frequency data in the $D = 0.1L$ cell exhibit two distinct regimes separated by a transitional $Ra$ ( $Ra_{t}$): a slow-decay regime and a fast-decay regime, with different scaling relationships. The scaling exponents of the two distinct regimes are $ft_E \sim Ra^{-1.73}$ ( $\,ft_E \sim Ra^{-1.06}$ in the normal cell) and $ft_E \sim Ra^{-2.87}$ ( $\,ft_E \sim Ra^{-3.03}$ in the normal cell) and $Ra_{t}$ is around $1 \times 10^8$ ( $Ra_{t} = 2 \times 10^8$ in the normal cell). One can see that the scaling exponents in the corresponding regime do not change too much from the normal cell to the centre-obstructed cell.
To gain quantitative relationships between the flow topology and reversal frequency, we study the evolution of different Fourier modes with  $Ra$ for different sizes of the cylindrical obstructions. In figure 7, we show the mean energy $\langle E^{m,n}(t) \rangle$ contained in each of the first four modes as a function of $Ra$ for both the $D = 0.1L$ cell and the normal cell. Previously we know that in the normal cell (as shown in figure 7b) both the ( $2,1$) and ( $1,2$) modes are negligibly weak over the whole $Ra$ range and the ( $1,1$) and ( $2,2$) modes dominate the flow field. Meanwhile, the $Ra$ dependencies of the ( $1,1$) and ( $2,2$) modes show opposite trends and consequently there exists a cross-over $Ra$ which had been found to be identical to the transitional $Ra$ in the reversal frequency (Chen et al. Reference Chen, Huang, Xia and Xi2019). It should be noted that the dominance of the ( $2,2$) mode does not lead to a FRS. Previous study (Chen et al. Reference Chen, Huang, Xia and Xi2019) had revealed that although the ( $2,2$) mode overtakes the ( $1,1$) mode at low $Ra$, the flow structure still takes the form of a single roll (LSC) but with substructures inside, and thus this flow state was named as an ASRS. In the ASRS regime, the ( $2,2$) mode dominates the flow field, yet the energy contained in the ( $2,2$) mode remains below 50 $\%$. As $Ra$ decreases further, more of the energy shifts to the ( $2,2$) mode. For instance, when 60 $\%$ of the energy is contained in the ( $2,2$) mode, the flow field is in the FRS, and LSC no longer exists. Because the ( $1,1$) and the ( $2,2$) modes are mostly contributed by the main vortex and corner vortices respectively, the evolution of the ( $1,1$) and the ( $2,2$) modes is essentially consistent with the flow topology transition shown in figure 3(a–c), i.e. the transition from FRS to ASRS and finally to SRS. Hence one important conclusion drawn for the normal cell is the one-to-one correspondence between the transition of reversal rate and the transition of flow topology, which implies the transition of reversal frequency originates from the transition of flow topology (Chen et al. Reference Chen, Huang, Xia and Xi2019). In the cell with the obstructed centre, similar trends of the ( $1,1$) and ( $2,2$) modes can be found, as shown in figure 7(a) for the $D = 0.1L$ case. There is also a cross-over $Ra$ between the ( $1,1$) and ( $2,2$) modes, and the cross-over $Ra$ is very close to $Ra_{t}$ of the reversal frequency (also plotted in figure 7(a) as a dot-dashed line). Besides, the flow topology evolution exhibited in figure 3 can also be essentially described by the Fourier mode evolution with $Ra$. This implies that the one-to-one correspondence between the transition of reversal frequency and the transition of flow topology found in the normal cell also pertains in the centre-obstructed cell and this provides further evidence of the general mechanism responsible for the transition of the reversal frequency.

Figure 7. Time-averaged energy contained in each flow mode as a function of  $Ra$ measured in (a) centre-obstructed cell ( $D = 0.1L$) and (b) normal cell. The dot-dashed lines indicate the transitional $Ra$ for the reversal frequency obtained from figure 6. The normal cell data are from Chen et al. (Reference Chen, Huang, Xia and Xi2019) for comparison.
Previously we have found that the transition of the scaling of the frequency of the flow reversal is controlled by the transition of the stability of the ( $1,1$) mode in the unobstructed normal cell (Chen et al. Reference Chen, Huang, Xia and Xi2019). Now in the centre-obstructed cell we have also found a transition of the flow reversal frequency, it is natural to ask whether this transition is also controlled by the same mechanism, i.e. the transition of the stability of the ( $1,1$) mode. To answer this question we examine the stability of the Fourier modes in the obstructed cells. The stability $S^{m,n}$ of the $(m,n)$ mode is defined as the ratio of the mean and the root-mean-square value of the amplitude of the $(m,n)$ mode $\langle A^{m,n}\rangle / \sigma _{A^{m,n}}$ (Chen et al. Reference Chen, Huang, Xia and Xi2019). According to the definition, a larger $S^{1,1}$ means a more stable main vortex; similarly a larger $S^{2,2}$ means more stable corner vortices. In figure 8, we plot the normalized $Ra$ dependence of the stability of the ( $1,1$) and ( $2,2$) modes in the $D = 0.1L$ cell, and for comparison the data measured in the normal cell are also plotted. One can see that the magnitude of $S^{1,1}$ in the $D = 0.1L$ obstruction case is very close to that in the normal cell case. In addition, the scaling of $S^{1,1}$ (with $Ra$) is also divided into two scaling regimes and the exponents of the slow increase and the fast increase are very close to those of the normal cell case. This implies that the transition of the reversal frequency scaling (with $Ra$) in the centre-obstructed cell is indeed also controlled by the transition of the stability of the ( $1,1$) mode. Moreover, in the centre-obstructed cell the transitional Rayleigh number $Ra_{tr}$ for the reversal frequency and that for the change of the stability of the ( $1,1$) mode are also almost the same.

Figure 8. (a) The stability of the ( $1,1$) mode $S^{1,1}$ and (b) the stability of the ( $2,2$) mode $S^{2,2}$ as functions of the normalized $Ra$ for the centre-obstructed cell ( $D = 0.1L$) and the normal cell. The solid lines in (a) are the power-law fits. Data from both the $D = 0.1L$ cell and the normal cell are included for the fit and two blue points which are very close to the transition $Ra$ are not included in the fitting. The normal cell data are from Chen et al. (Reference Chen, Huang, Xia and Xi2019) for comparison.
If we check figure 4 again, one may realize that the small enhancement of  $\langle E^{1,1}\rangle$ and small reduction of $\langle E^{2,2}\rangle$ in the $D = 0.1L$ cell (compared with that in the normal cell) may not match the very large reduction in reversal frequency shown in figure 6. In figure 8(b), we show $S^{2,2}$ as a function of $Ra$, and one can see that the values of $S^{2,2}$ show a great reduction compared with those in the normal cell, which means that the ( $2,2$) mode in the obstructed cell is less stable than that in the normal cell. As the reversal is accomplished by the corner vortices squeezing the main vortex, a stronger main vortex (( $1,1$) mode), weaker corner vortices (( $2,2$) mode), together with the less stable corner vortex (( $2,2$) mode) will result in a great reduction of the reversal frequency. Thus the great reduction of the reversal frequency in the obstructed cell is attributed to the combined effects of the enhanced energy contained in the ( $1,1$) mode, reduced energy contained in the ( $2,2$) mode and the reduced stability of the ( $2,2$) mode.
Moreover, it should be noted that the above discussion only gives an implication that the main-vortex-breaking stage of the reversal process is strongly affected by the cylindrical obstruction; however, whether the obstruction affects the corner vortex connection process is still not known to us. Our conjecture is that the existence of the obstruction at the centre of the cell would obstruct the two corner vortices from connecting. Unfortunately due to the extremely low frequency of the reversal, we are not able to catch one reversal process during our flow visualization; thus we are not able to give an accurate answer to this question and this is definitely an important aspect waiting for further study.
4. Conclusions
In summary, we have conducted an experimental study of turbulent thermal convection in a quasi-two-dimensional rectangular cell with an obstruction at the cell centre. We observed a great heat transport enhancement of up to  $21\,\%$ compared with that in a normal cell in the low- $Ra$ regime. We emphasize that this $21\,\%$ enhancement is achieved by only half the volume of the working fluid compared with the normal cell, which is rather surprising and this suggests the great potential and capability of enhancing heat transport with an obstruction. It should be noted that this obstruction method is very simple and does not involve phase changes or external forces.
Through flow visualization, we revealed that the very large enhancement of heat transfer in the low- $Ra$ regime is due to the obstruction-induced change of the flow topology from FRS to ASRS or SRS (depending on the size of the obstruction). Among these three flow states, the FRS is believed to be less efficient in heat transfer compared with the ASRS or SRS. In contrast, in the high- $Ra$ regime, the flow topology is not sensitive to the addition of the obstruction, and as a result the change of heat transport efficiency is barely measurable. It is found that the frequency of the reversal of the LSC is greatly reduced due to the presence of the obstruction, and the reduction is stronger with the increasing size of the cylindrical obstruction. We have measured the $Ra$ dependence of flow reversal frequency for the $D = 0.1L$ obstruction case. For this case, on average the reversal frequency is reduced by ${\sim }80\,\%$ compared with that in the normal cell. Despite the reduction in the reversal frequency, the measured reversal frequency in the $D = 0.1L$ case also exhibits a transition with two distinct regimes separated by a transitional $Ra$ ( $Ra_{t}$): a slow-decay regime followed by a fast-decay regime, which is consistent with that in the normal cell. Meanwhile, the scaling exponents of the two regimes do not show distinct differences between the normal cell and the centre-obstructed cell, especially for the fast-decay regime, indicating that the reversals in the normal cell and the centre-obstructed cell are governed by the same mechanism. Through further analysis of the stability of the ( $1,1$) and the ( $2,2$) modes in the normal cell and the centre-obstructed cell, we revealed that the reduction of reversal frequency is associated with the reduction of the stability of the ( $2,2$) mode (or corner vortices) in the centre-obstructed cell.
Funding
This work was supported by the National Natural Science Foundation of China (NSFC) under grant nos. 12125204 and 12388101, the China Postdoctoral Science Foundation under grant no. 2021M702077 and the 111 project of China (no. B17037).
Declaration of interests
The authors report no conflict of interest.


