


The Cenozoic record of Earth's history is marked by the major shift from greenhouse to icehouse conditions. The Palaeocene–Eocene Thermal Maximum (PETM) at ~56 Ma is regarded as one of the most profound global warming events during the Cenozoic that released carbon comparable to modern sources (Zachos et al., Reference Zachos, Pagani, Sloan, Thomas and Billups2001; Rohl et al., Reference Röhl, Westerhold, Bralower and Zachos2007; Westerhold et al., Reference Westerhold, Röhl, McCarren and Zachos2009; Murphy et al., Reference Murphy, Farley and Zachos2010). The global marine and terrestrial record of the warming during the Palaeocene–Eocene (P–E) transition clearly shows five transient hyperthermal events that are marked by negative carbon isotope excursions (CIEs), namely the PETM, the Eocene Thermal Maximum 2 (ETM2) or H1 and three others known as H2, I1 and I2. Of these events, the first two (i.e. PETM and ETM2) are the major CIEs, whereas the others demarcate minor CIEs (Dickens et al., Reference Dickens, O'Neil, Rea and Owen1995, Reference Dickens, Castillo and Walker1997; Westerhold et al., Reference Westerhold, Marwan, Drury, Liebrand, Agnini and Anagnostou2020). Over a short interval of 150,000 years during the PETM, the average global temperature rose by 5–10°C together with acidification of the oceans and abrupt change in the hydrological cycle (Wing et al., Reference Wing, Harrington, Smith, Bloch, Boyer and Freeman2005; Zachos et al., Reference Zachos, Röhl, Schellenberg, Sluijs, Hodell and Kelly2005; Röhl et al., Reference Röhl, Westerhold, Bralower and Zachos2007; Secord et al., Reference Secord, Gingerich, Lohmann and MacLeod2010; Cui et al., Reference Cui, Kump, Ridgwell, Charles, Junium and Diefendorf2011; McInerney & Wing, Reference McInerney and Wing2011).
Over the last few decades, the PETM and the subsequent hyperthermal events have been reported on extensively, but mainly with regards to mid-range and high latitudes. These hyperthermal events influenced the marine and terrestrial ecosystems of the Earth significantly (Kennett & Scott, Reference Kennett and Scott1991; Koch et al., Reference Koch, Zachos and Gingerich1992; Zachos et al., Reference Zachos, Wara, Bohaty, Delaney, Petrizzo and Brill2003, Reference Zachos, Schouten, Bohaty, Quattlebaum, Sluijs and Brinkhuis2006; Smith et al., Reference Smith, Wing and Freeman2007; Elling et al., Reference Elling, Gottschalk, Doeana, Kusch, Hurley and Pearson2019). For example, the warming during the P–E transition resulted in a rapid depletion of the δ13C (–3‰ to –4‰), acidification of the oceans, changes in the ocean circulation, and the benthic extinction in the marine realm (Kennett & Scott, Reference Kennett and Scott1991).
The terrestrial sedimentary record of the Earth is also marked by enhanced silicate weathering and an abundance of kaolinite (Ka) in P–E transition sediments, with examples from the North Sea Basin of Europe, the Tethys Sea, north-west Argentina, sections of the Bass River and Williston Basin in the USA (Cramer et al., Reference Cramer, Aubry, Miller, Olsson, Wright and Kent1999, Bolle & Adatte, Reference Bolle and Adatte2001, Clechenko et al., Reference Clechenko, Kelly, Harrington and Stiles2007; Kemp et al., Reference Kemp, Ellis, Mounteney and Kender2016; Do Campo et al., Reference Do Campo, Bauluz, Del Papa, White, Yuste and Mayayo2018). The terrestrial record of the Qaidam Basin, north-west China, has been explored for clay mineralogical details of the Early Eocene Climate Optimum (EECO) in the interval 53–49 Ma, which also confirmed elevated temperatures and increased chemical weathering controlled by global climatic changes (Wang et al., Reference Wang, Hong, Song, Yin, Li, Zhang and Ji2011; Zhao et al., Reference Zhao, Wang, Hong, Algeo, Yin and Ji2021). The Bighorn Basin in the USA is marked by contrasting results in comparison to the nearby Williston Basin, as it is characterized by the dominance of physical weathering and erosion over chemical weathering (Wang et al., Reference Wang, Adriaens, Hong, Elsen, Vandenberghe and Lourens2017; Ji et al., Reference Ji, Wang, Hong, Yin, Zhao and Xu2023).
The terrestrial sedimentary record of the PETM reported from various parts of the world shows a close correspondence and equivalence with marine records (Koch et al., Reference Koch, Zachos and Gingerich1992). For example, the palaeosols that formed during the P–E transition are also marked by warming, increased chemical weathering and depletion of δ13C similar to marine records (Koch et al., Reference Koch, Zachos and Gingerich1992). Biotic life across the continents was also influenced by the rapid warming during the P–E transition and is characterized by a dramatic shift in the vegetation from a mixed angiosperm–conifer flora to a purely angiosperm flora (Pagani et al., Reference Pagani, Pedentchouk, Huber, Sluijs, Schouten and Brinkhuis2006; Schouten et al., Reference Schouten, Woltering, Rijpstra, Sluijs, Brinkhuis and Damsté2007; Smith et al., Reference Smith, Wing and Freeman2007).
In light of the available terrestrial record of the PETM and EECO, it is necessary to address the critical issues regarding research into the P–E transition warming: (1) most of the reports on the PETM and subsequent hyperthermals are mainly from high latitudes, but there is less research exploring the lower latitudes and equatorial regions of the past (Jaramillo, Reference Jaramillo2002; Handley et al., Reference Handley, O'Halloran, Pearson, Hawkins, Nicholas and Schouten2012; Frieling et al., Reference Frieling, Gebhardt, Huber, Adekeye, Akande and Reichart2017, Reference Frieling, Reichart, Middelburg, Röhl, Weterhold, Bohaty and Sluijs2018); (2) despite there being valuable information about the PETM and subsequent hyperthermals at the global level, information on the tropical regions remains limited; (3) the exact causal relationship regarding the warming between the lower and higher latitudes is still far from completely understood; (4) the possible similarities or differences in warming, wetting and increases in weathering at the higher and lower latitudes are not known; (5) clay mineral responses to weathering during hyperthermals in the palaeotropics are not known; and (6) there are many reports that indicate P–E hyperthermals are similar to modern increases in temperature and pCO2 in the atmosphere, but in the lower latitudes this information is still not known.
Thus, it is necessary to address such issues using various proxies and to unravel the physical, chemical and biological details of the PETM from the lower latitudes and the equatorial regions of the past. A detailed understanding of the PETM and subsequent warming events in lower latitudes is crucial to define the pole-to-equatorial gradient of the temperature increase, the latitudinal variation of the pCO2 forcing and the extent and intensity of chemical weathering on the surface of the Earth. Therefore, the present study of Akli Formation sediments is of great importance because it represents a near-equatorial location during the P–E transition period. The main objective of the present study is to explore the clay mineralogy of the P–E transient sediments showing extreme climatic conditions at 150–200 ky intervals and to test the responses of clay minerals to intense climatic stress at the global level. In this study, we have used detailed clay mineralogy to explore the PETM and subsequent hyperthermal events in a 32 m-thick succession of the Akli Formation, Barmer Basin. This work highlights the PETM details of near-equatorial regions in the past in terms of clay mineralogical changes and their relationship with increased chemical weathering, warming and wetting in the equatorial region of the past. Furthermore, this work on clay mineral evidence from the PETM provides a valuable addition to the available biotic and carbon isotopic evidence of the hyperthermals recorded in the Himalayas and western India (Prasad et al., Reference Prasad, Farooqui, Tripathi, Garg and Thakur2009; Samanta et al., Reference Samanta, Bera, Ghosh, Bera, Filley and Pande2013; Sreenivasan et al., Reference Sreenivasan, Bera, Samanta and Vadlamani2018; Gupta & Kumar, Reference Gupta and Kumar2019; Khozyem et al., Reference Khozyem, Adatte, Keller and Spangenberg2021; Choudhury et al., Reference Choudhury, Banerjee, Khanolkar, Saraswati and Meena2021).
Materials and methods
Geological setting of the study area
The Barmer Basin constitutes a part of the West Indian Rift System (WIRS) and is critical to understanding the tectonic and geological evolutionary history of the WIRS (Biswas, Reference Biswas1982; Gombos et al., Reference Gombos, Powell and Norton1995; Compton, Reference Compton2009; Bladon et al., Reference Bladon, Clarke and Burley2015). The Barmer Basin is a failed continental rift basin 200 km long, 40 km wide and 6 km deep (Fig. 1). It is filled with fluvial, lacustrine and marine-influenced sediments of Neoproterozoic to Cenozoic age (Dasgupta, Reference Dasgupta, Venkatachala and Sastri1974; Tripathi et al., Reference Tripathi, Singh and Sisodia2003, Reference Tripathi, Kumar and Srivastava2009; Bladon et al., Reference Bladon, Clarke and Burley2015). The pre-rift sediments include the Neoproterozoic–Early Cambrian of Birmania Formation and the Jurassic Lathi and Jaisalmer formations. The Sarnu, Barmer and Fatehgarh formations are the syn-rift sediments that were deposited during the Cretaceous period. Finally, the Mata-Ji-ka Dunger Formation and the Akli Formation are the post-rift sediments of the Palaeogene period (Dasgupta, Reference Dasgupta, Venkatachala and Sastri1974; Tripathi et al., Reference Tripathi, Singh and Sisodia2003, Reference Tripathi, Kumar and Srivastava2009).

Figure 1. (a) Rift basins of western India (after Bladon et al., Reference Bladon, Clarke and Burley2015) and location of the Giral lignite mine in Barmer Basin. (b) Geological map of the Barmer Basin and location of the Giral lignite mine (after Sisodia & Singh, Reference Sisodia and Singh2000). (c) Lithostratigraphy of the Barmer Basin (after Sisodia & Singh, Reference Sisodia and Singh2000). (d) Google Earth image of the Giral lignite mine and the studied section.
The geological setting of the Barmer Basin shows that sediments of the Akli Formation were mainly sourced from the Malani Igneous Suite (Fig. 1). The igneous suite of ~750 Ma consists mainly of an extrusive phase of rhyolitic rocks and stratified tuffs that were later intruded by granite and rhyolitic porphyry dykes (Eby & Kochhar, Reference Eby and Kochhar1990; Maheshwari et al., Reference Maheshwari, Sial, Coltorti, Chittora and Cruz2001; Gregory et al., Reference Gregory, Meert, Bingen, Pandit and Torsvik2009). The extrusive rhyolitic phase is generally aphyric in nature, with a few phenocrysts of quartz (Q) and K-feldspar (Eby & Kochhar, Reference Eby and Kochhar1990; Maheshwari et al., Reference Maheshwari, Sial, Coltorti, Chittora and Cruz2001).
The P–E transition sediments of the Akli Formation, Barmer Basin, are ~265 m thick and overlie the Mata-Ji-ka Dunger Formation in the uppermost part of the Barmer Basin (Fig. 1). The Giral mine (26°04′ N latitude, 71°16′ E longitude) exposes the best representative section of the Akli Formation and has been studied extensively for pollen and vertebrate fauna (Tripathi et al., Reference Tripathi, Singh and Sisodia2003; Rana et al., Reference Rana, Kumar, Singh and Rose2005). The Giral mine section comprises a 32 m-thick succession of alternating bands of bentonite, carbonaceous clay, grey to reddish clay and lignite (Tripathi et al., Reference Tripathi, Singh and Sisodia2003, Reference Tripathi, Kumar and Srivastava2009; Rana et al., Reference Rana, Kumar, Singh and Rose2005). The palynological and vertebrate palaeontological evidence suggests that the Akli Formation sediments were deposited in coastal floodplains with frequent marine excursions and mangrove-dominated vegetation of the tropics (Naskar & Baksi, Reference Naskar and Baksi1976; Pareek, Reference Pareek1981, Reference Pareek1984; Tripathi et al., Reference Tripathi, Singh and Sisodia2003, Reference Tripathi, Kumar and Srivastava2009; Rana et al., Reference Rana, Kumar, Singh and Sinha2006; Singh, Reference Singh2015; Nagori & Khosla, Reference Nagori and Khosla2019; Prasad et al., Reference Prasad, Uddandam, Agrawal, Bajpai, Singh and Mishra2020; Khozyem et al., Reference Khozyem, Adatte, Keller and Spangenberg2021).
The sedimentological features of the 32 m section of the Giral mine section show that it comprises horizontally bedded metre-scale lignite, clay, silty clay, silty loam, sandy loam and fine sand beds (Fig. 2 & Table 1). The lignite beds occur mainly in the lowermost parts (L1 and L2) and are followed by 24 beds of clay, silty clay, silty loam, sandy loam and fine sand and thin lignite units. The clay, silty clay and silty loam units constitute a major part (i.e. ~25.5 m in bed nos. 1–3, 6–7 and 8–24), whereas the sandy loam and fine sand units constitute only up to ~3 m (i.e. bed nos. 4, 5 and 7) at 18–22 m depth of the section (Fig. 2). The beds are either laminated or massive and are defined by varying thicknesses, textures, colours and varying abundances of gypsum and charcoal (Table 1). The silty clay bed nos. 7, 11, 13 and 23 at 17, 12, 9 and 0.5 m depths, respectively, are characterized by millimetre-scale laminations of light and dark colours, whereas all other beds are massive (Table 1).
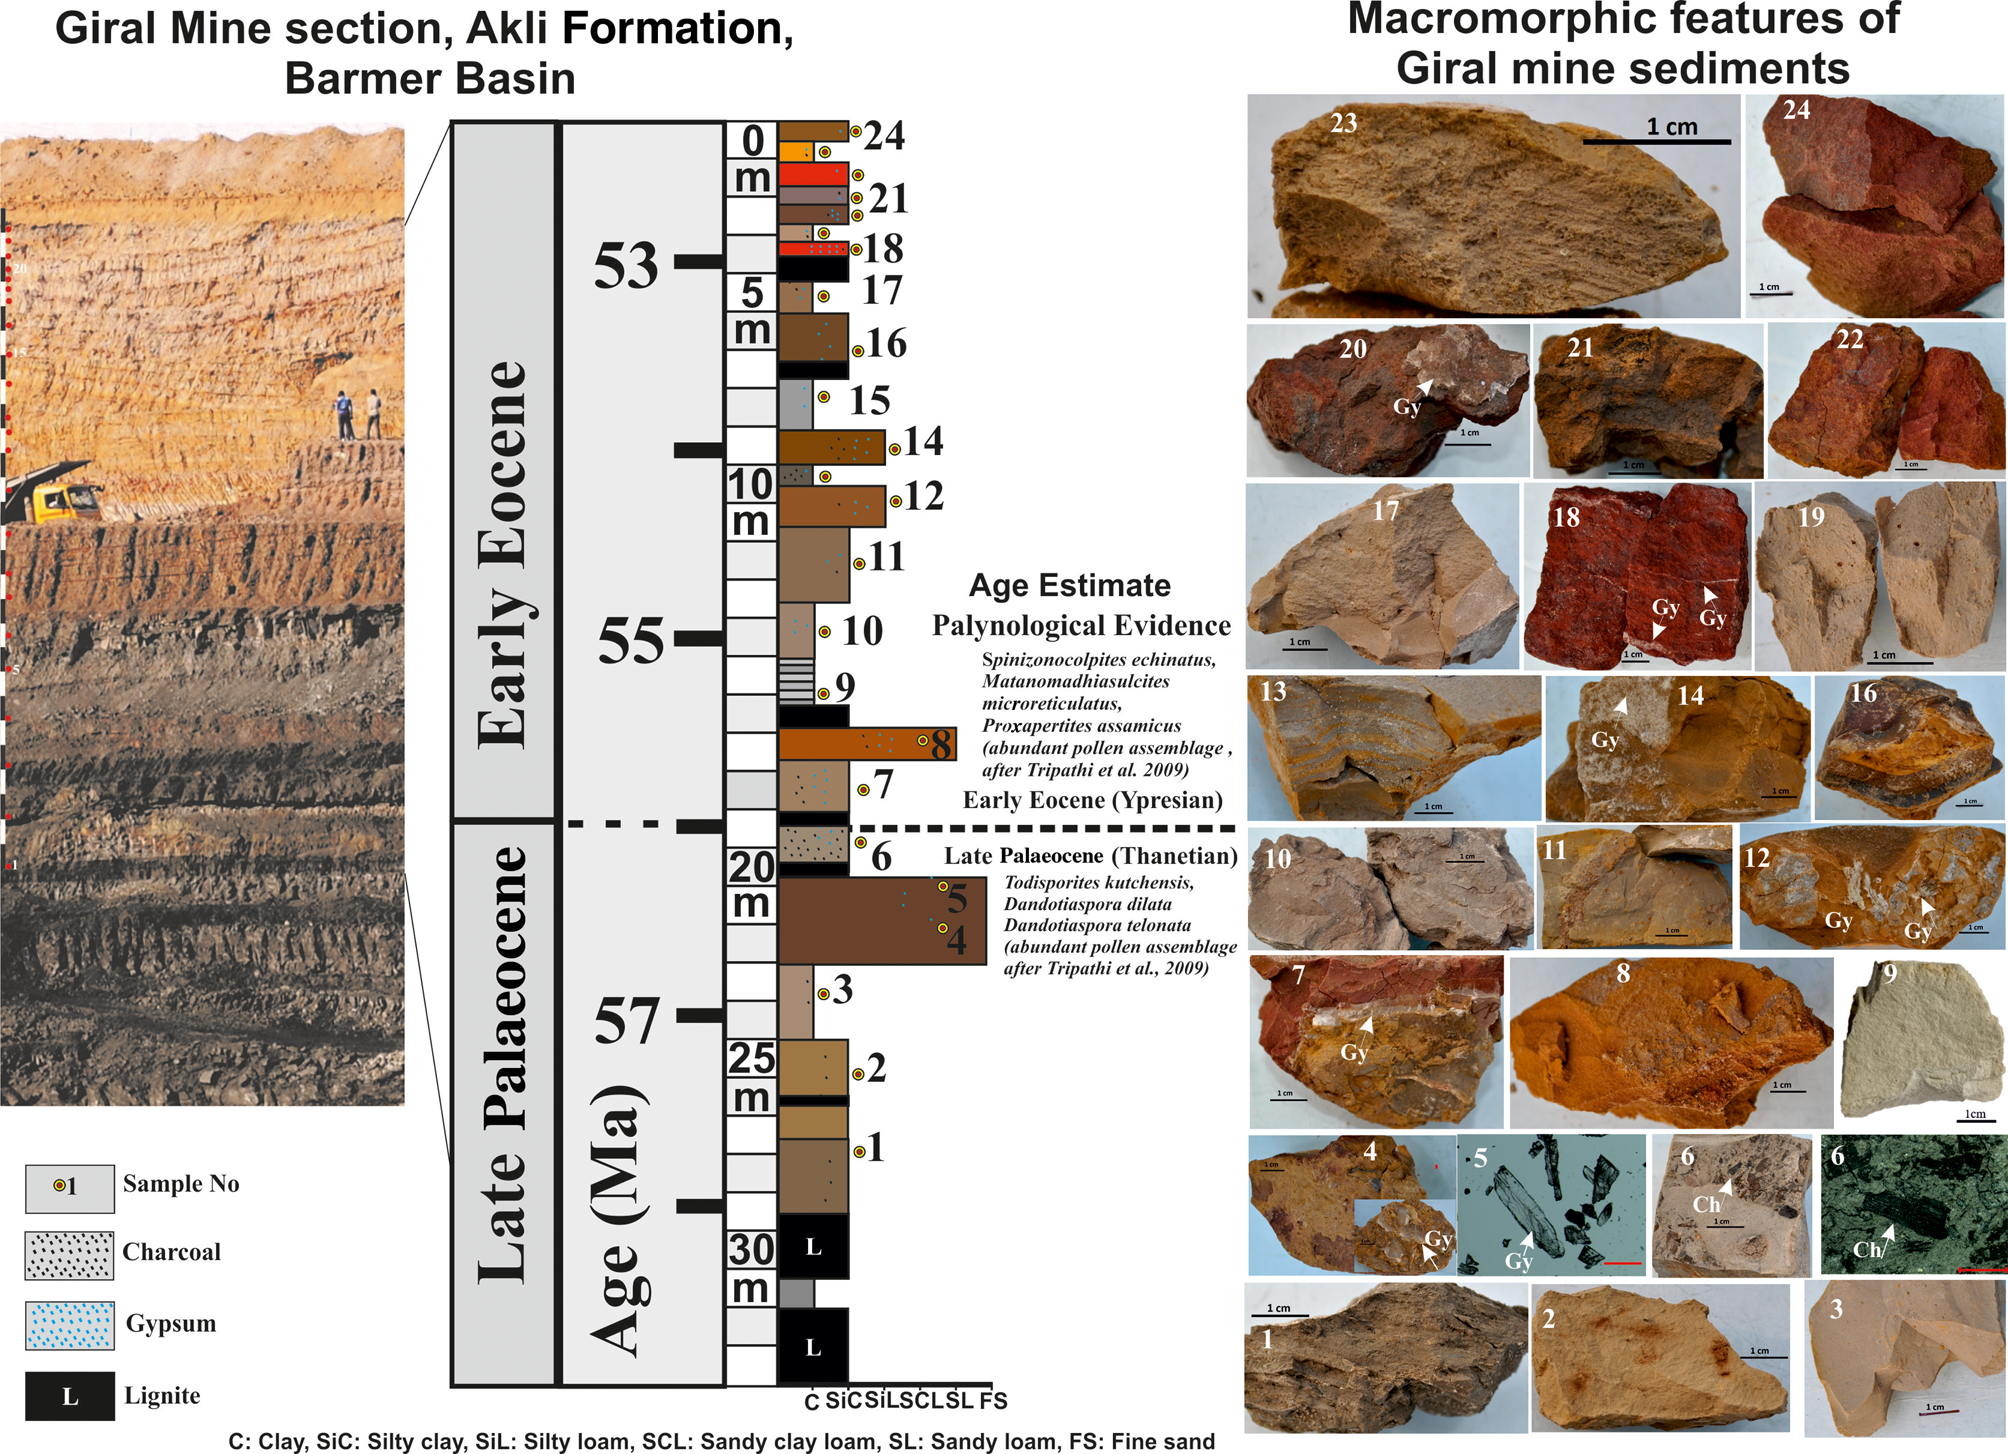
Figure 2. Lithology of the 32 m studied section of the Giral mine showing the P–E transition (age estimate based on Thanetian–Ypresian characteristic pollen assemblages) and 24 representative beds and their macroscopic features. The colour, texture, structure, charcoal (Ch) and gypsum (Gy) contents based on the present study are summarized in Table 1.
Table 1. Macroscopic features of the 24 beds in the 32 m Giral mine section of the Akli Formation, Barmer Basin.

Age constraints
The palynological assemblage, vertebrate fauna and δ13C curve of the studied section and their global correlation provide the age constraints of the Akli Formation. The palynological evidence from the Akli Formation is comparable to P–E assemblages of India and elsewhere (Naskar & Baksi, Reference Naskar and Baksi1976; Tripathi Reference Tripathi1993, Reference Tripathi1995, Reference Tripathi1997; Tabaei & Singh, Reference Tabaei and Singh2002; Tripathi et al., Reference Tripathi, Singh and Sisodia2003, Reference Tripathi, Kumar and Srivastava2009; Singh, Reference Singh2015; Khanolkar & Sharma, Reference Khanolkar and Sharma2019). The palynological assemblages of the Akli Formation were used to establish two informal palynozones demarcating late Palaeocene and Early Eocene sediments (Tripathi Reference Tripathi1993, Reference Tripathi1995, Reference Tripathi1997; Tripathi et al., Reference Tripathi, Singh and Sisodia2003, Reference Tripathi, Kumar and Srivastava2009). The two distinct palynozones are separated at ~20 m depth of the Giral mine section (Tripathi et al., Reference Tripathi, Singh and Sisodia2003, Reference Tripathi, Kumar and Srivastava2009). The lower palynozone is defined by pteridophytic spores and dinoflagellate cysts consisting of the major taxa Lygodiumsporites eocenicus, Todisporites kutchensis and Dandotiaspora dilata, of which Dandotiaspora is considered to be the most characteristic marker of the Palaeocene to Early Eocene age (Naskar & Baksi, Reference Naskar and Baksi1976; Tripathi et al., Reference Tripathi, Singh and Sisodia2003, Reference Tripathi, Kumar and Srivastava2009). The upper palynozone is characterized by angiosperm pollens consisting of Spinizonocolpites echinatus, Matanomad-hiasulcites microreticulatus, Proxaperites cursus, Proxaperites microreticulatus, Kapurdipollenites gemmatus and Retiverrumonosulcites barmerensis (Tripathi et al., Reference Tripathi, Singh and Sisodia2003, Reference Tripathi, Kumar and Srivastava2009). The lower palynozone assemblage indicates a Late Palaeocene (Thanetian) age for these sediments as the assemblage either dwindles or disappears completely in the Early Eocene (Tripathi et al., Reference Tripathi, Singh and Sisodia2003, Reference Tripathi, Kumar and Srivastava2009). The upper palynozone is typically characterized by species of Spinizonocolpites, an extinct Nypa-like pollen of palms of Early Eocene (Ypresian) age (Tripathi et al., Reference Tripathi, Singh and Sisodia2003, Reference Tripathi, Kumar and Srivastava2009). Nypa pollens were the most widespread pollens globally during the Eocene, but the onset of cooling during the Late Eocene resulted in their decline and extinction (Morley, Reference Morley2000; Pocknall et al., Reference Pocknall, Clowes and Jarzen2022). The presence of Nypa pollens in sediments indicates a mangrove environment in tidal mud flats (Chaloner, Reference Chaloner and Drake1968; Morley, Reference Morley2000; Pocknall et al., Reference Pocknall, Clowes and Jarzen2022).
The vertebrate fossils recovered from the Giral mine section and the adjoining lignite mines of the Barmer Basin and their global correlation also provide the age of the Akli Formation (Rana et al., Reference Rana, Kumar, Singh and Rose2005; Rose et al., Reference Rose, Smith, Rana, Sahni, Singh, Missiaen and Folie2006; Smith et al., Reference Smith, Kumar, Rana, Folie, Solé and Noiret2016; Rajkumari & Prasad, Reference Rajkumari and Prasad2020). The vertebrate fossils in the Giral and the adjoining mines support a Thanetian age for the lower palynozone of the Giral mine section (Rajkumari & Prasad, Reference Rajkumari and Prasad2020). The vertebrate fauna of the Akli Formation show their wide palaeogeographical distribution in the Late Palaeocene sediments of the USA, Europe, Africa and Asia (Arambourg, Reference Arambourg1952; Noubhani & Cappetta, Reference Noubhani and Cappetta1997; Knight et al., Reference Knight, Cicimurri and Purdy2007; Cappetta, Reference Cappetta2012; Ebert & Stehmann, Reference Ebert and Stehmann2013; Rajkumari & Prasad, Reference Rajkumari and Prasad2020).
The global reference curves of the carbon (δ13C) and oxygen (δ18O) isotope compositions of the benthic foraminifera demonstrate sharp but negative shifts in the isotopes during the Palaeogene hyperthermals (Westerhold et al., Reference Westerhold, Marwan, Drury, Liebrand, Agnini and Anagnostou2020). The PETM and the subsequent Early Eocene hyperthermals (EECO) are defined by a sharp depletion of δ13C up to –3‰ from background values (Westerhold et al., Reference Westerhold, Marwan, Drury, Liebrand, Agnini and Anagnostou2020). The δ13C curves of the Giral mine sections and five neighbouring sections show a remarkable consistency with global reference curves (Westerhold et al., Reference Westerhold, Marwan, Drury, Liebrand, Agnini and Anagnostou2020; Khozyem et al., Reference Khozyem, Adatte, Keller and Spangenberg2021). The high-resolution δ13Corg data of the 32 m studied section is marked by a sharp depletion of approximately –3‰ at 19–22 m depth and then again a depletion of approximately –2.5‰ at 2–3 m depth (Khozyem et al., Reference Khozyem, Adatte, Keller and Spangenberg2021). The δ13C curve of the studied section is consistent with the global reference curve, and the depletion of δ13C at 19–22 m depth defines the PETM at 56 Ma, whereas the next depletion of δ13C at 2–3 m depth defines the ETM2 (Khozyem et al., Reference Khozyem, Adatte, Keller and Spangenberg2021). Based on the above palaeontological evidence and the δ13C curve, the studied Giral mine section of the Akli Formation represents P–E transition sediments and the ~20 m depth of the section represents the Late Palaeocene (Thanetian)–Early Eocene (Ypresian) boundary, providing an important archive of the Palaeogene hyperthermals.
Bulk mineralogical composition
The 32 m Giral mine section was explored at the site for macroscopic features such as the structure, texture, colour and thickness of beds/laminations and the presence of carbonates, charcoal, and gypsum to construct a lithology using standard procedures (Stow, Reference Stow2005; Nichols, Reference Nichols2009). Representative samples from 24 different beds were used for clay mineralogical studies. The pH of all representative samples was measured using a 1:2 soil:water ratio (Jackson, Reference Jackson1975).
X-ray diffraction (XRD) was used for bulk mineralogy and clay mineralogy of total clay (TC; <2 μm) and fine clay (FC; <0.2 μm) fractions of all 24 representative samples (Jackson, Reference Jackson1975; Wilson, Reference Wilson1987). For bulk mineralogy, powdered samples (~100 mesh) were analysed using XRD as a non-orientated powder with Cu-Kα radiation in the range 3–70°2θ with a scanning speed of 1°2θ min–1 in continuous acquisition mode using a PANalytical X'Pert powder X-ray diffractometer (Malvern Panalytical, UK) at the Department of Geology, University of Delhi. The XRD traces of the non-oriented powders of 24 samples were examined following Wilson (Reference Wilson1987) for identification and to determine the various proportions of clay minerals (smectite (Sm): 14–15 Å; kaolin: 7 Å; mica (M): 10 Å), non-clay mineral silicates (Q: 3.34 Å; feldspar (F): 3.2 Å), iron oxide minerals (hematite, Fe2O3: 2.69 Å; goethite, α-FeO(OH): 2.45 Å; ferrihydrite, Fe2O3.0.5(H2O): 2.56 Å; feroxyhyte, δ-FeO(OH): 1.67 Å; lepidocrocite, γ-FeO(OH): 3.29 Å; maghemite, γ-Fe2O3: 2.51 Å; magnetite, Fe3O4: 2.53 Å), Mn oxide minerals (2.02 Å) and gypsum (CaSO4.2H2O: 2.34 Å). The relative abundances of these minerals were determined by measuring peak areas or integrated intensities for each mineral, and the sum of peak areas of all identified minerals was taken as 100%. The total amount of iron oxide mineral phases in the XRD traces was compared with the total iron oxide determined using X-ray fluorescence (XRF) analysis, and only variations of <±5% were detected.
Clay mineralogical analysis
For clay mineralogy, the TC (<2 μm) and FC (<0.2 μm) fractions of the sediments were separated using the pipette method after the removal of organic carbon, carbonate and free iron following the procedure of Jackson (Reference Jackson1979). Orientated clay fractions of TC and FC were subjected to XRD analysis in the 3–30°2θ range using the abovementioned equipment at the University of Delhi. The clay fractions were saturated with Ca and solvated with ethylene glycol (Ca-Eg), and the K-saturated samples were heated to 25°C, 110°C, 330°C and 550°C. The identification of the clay minerals was done following Jackson (Reference Jackson1979). The Sm is characterized by 14.0–15.0 Å (001) XRD peaks in Ca-saturation that increase to 17.0–19.0 Å upon solvation with ethylene glycol (Ca-Eg) at ambient temperature. Upon K-saturation and heating, the 001 peak of Sm shifts gradually to 12.0–13.0 Å at 25°C, 11.0–12.0 Å at 110°C, 10.5–11.5 at 330°C and finally to 10 Å (001) and 5 Å (002) at 550°C. The Ka is characterized by 7.20 Å (001) and 3.57 Å (002) peaks in Ca-saturation that are not affected either by solvation with ethylene glycol (Ca-Eg) at ambient temperature or by K-saturation and heating at 25°C, 110°C and 330°C, but they collapse at 550°C.
The interlayering in the 7.2 Å mineral phase was identified based on its slight shift and asymmetry towards low angles on glycolation and heating. Its broad basal reflections and absence of higher-order reflections were used to confirm kaolin (Wilson, Reference Wilson1987; Bhattacharyya et al., Reference Bhattacharyya, Pal and Deshpande1993; Srivastava et al., Reference Srivastava, Parkash and Pal1998). In the Sm component, Al-hydroxy interlayering in the Sm phase was identified based on the incomplete expansion of the 14–15 Å peaks upon glycolation and broadening of the low angle side of the 10 Å on K-saturation and heating to 550°C (Barnhisel & Bertsch, Reference Barnhisel and Bertsch1989; Bhattacharyya et al., Reference Bhattacharyya, Pal and Deshpande1993; Dietel et al., Reference Dietel, Ufer, Kaufhold and Dohrmann2019). Transformation of Sm to Ka (Sm/Ka) in the TC and FC fractions was identified based on a low-angle plateau at ~7.2 Å in the Ca-saturated samples that shifts to 8.0 Å upon glycolation (Wilson & Cradwick, Reference Wilson and Cradwick1972; Pal et al., Reference Pal, Deshpande, Venugopal and Kalbande1989; Srivastava et al., Reference Srivastava, Parkash and Pal1998). The dioctahedral or trioctahedral nature of the clay minerals was determined from 060 reflections of the randomly orientated samples (Jackson, Reference Jackson1979). The crystal orders of Sm and Ka were estimated based on the width of the first-order reflection and the presence or absence of higher-order XRD peaks (Wilson, Reference Wilson1987; Bhattacharyya et al., Reference Bhattacharyya, Pal and Deshpande1993; Srivastava et al., Reference Srivastava, Parkash and Pal1998). Semi-quantitative estimates of the clay minerals were based on the principle outlined by Gjems (Reference Gjems1967) with some modifications; namely, the same background curve was used for both solvated and ignited samples (Kapoor, Reference Kapoor1972). Accordingly, clay mineral percentages were calculated from Eg-solvated samples after measurement of the intensities of various reflections. The integrated intensities or areas of (001) peaks were measured for Sm (17 Å), Ka (7 Å), M (10 Å), Q (3.34 Å) and F (3.20 Å) and the sum of all these was taken as 100% to calculate the relative percentage of the various mineral phases.
Results
Bulk mineralogy
The bulk mineralogy determined by XRD of the randomly oriented powder samples of the 24 beds of the Giral mine section shows distinct variations in abundance of clay minerals (Sm, Ka, M), non-clay silicates (Q, F), iron oxides, Mn oxides and gypsum in each bed. The results of the bulk mineralogy are summarized in Figs 3–5 and Table 2. The bulk mineralogy of the 24 beds is characterized by varying proportions of clay minerals, non-clay silicates, iron oxides, Mn oxide and gypsum (Figs 3–5).
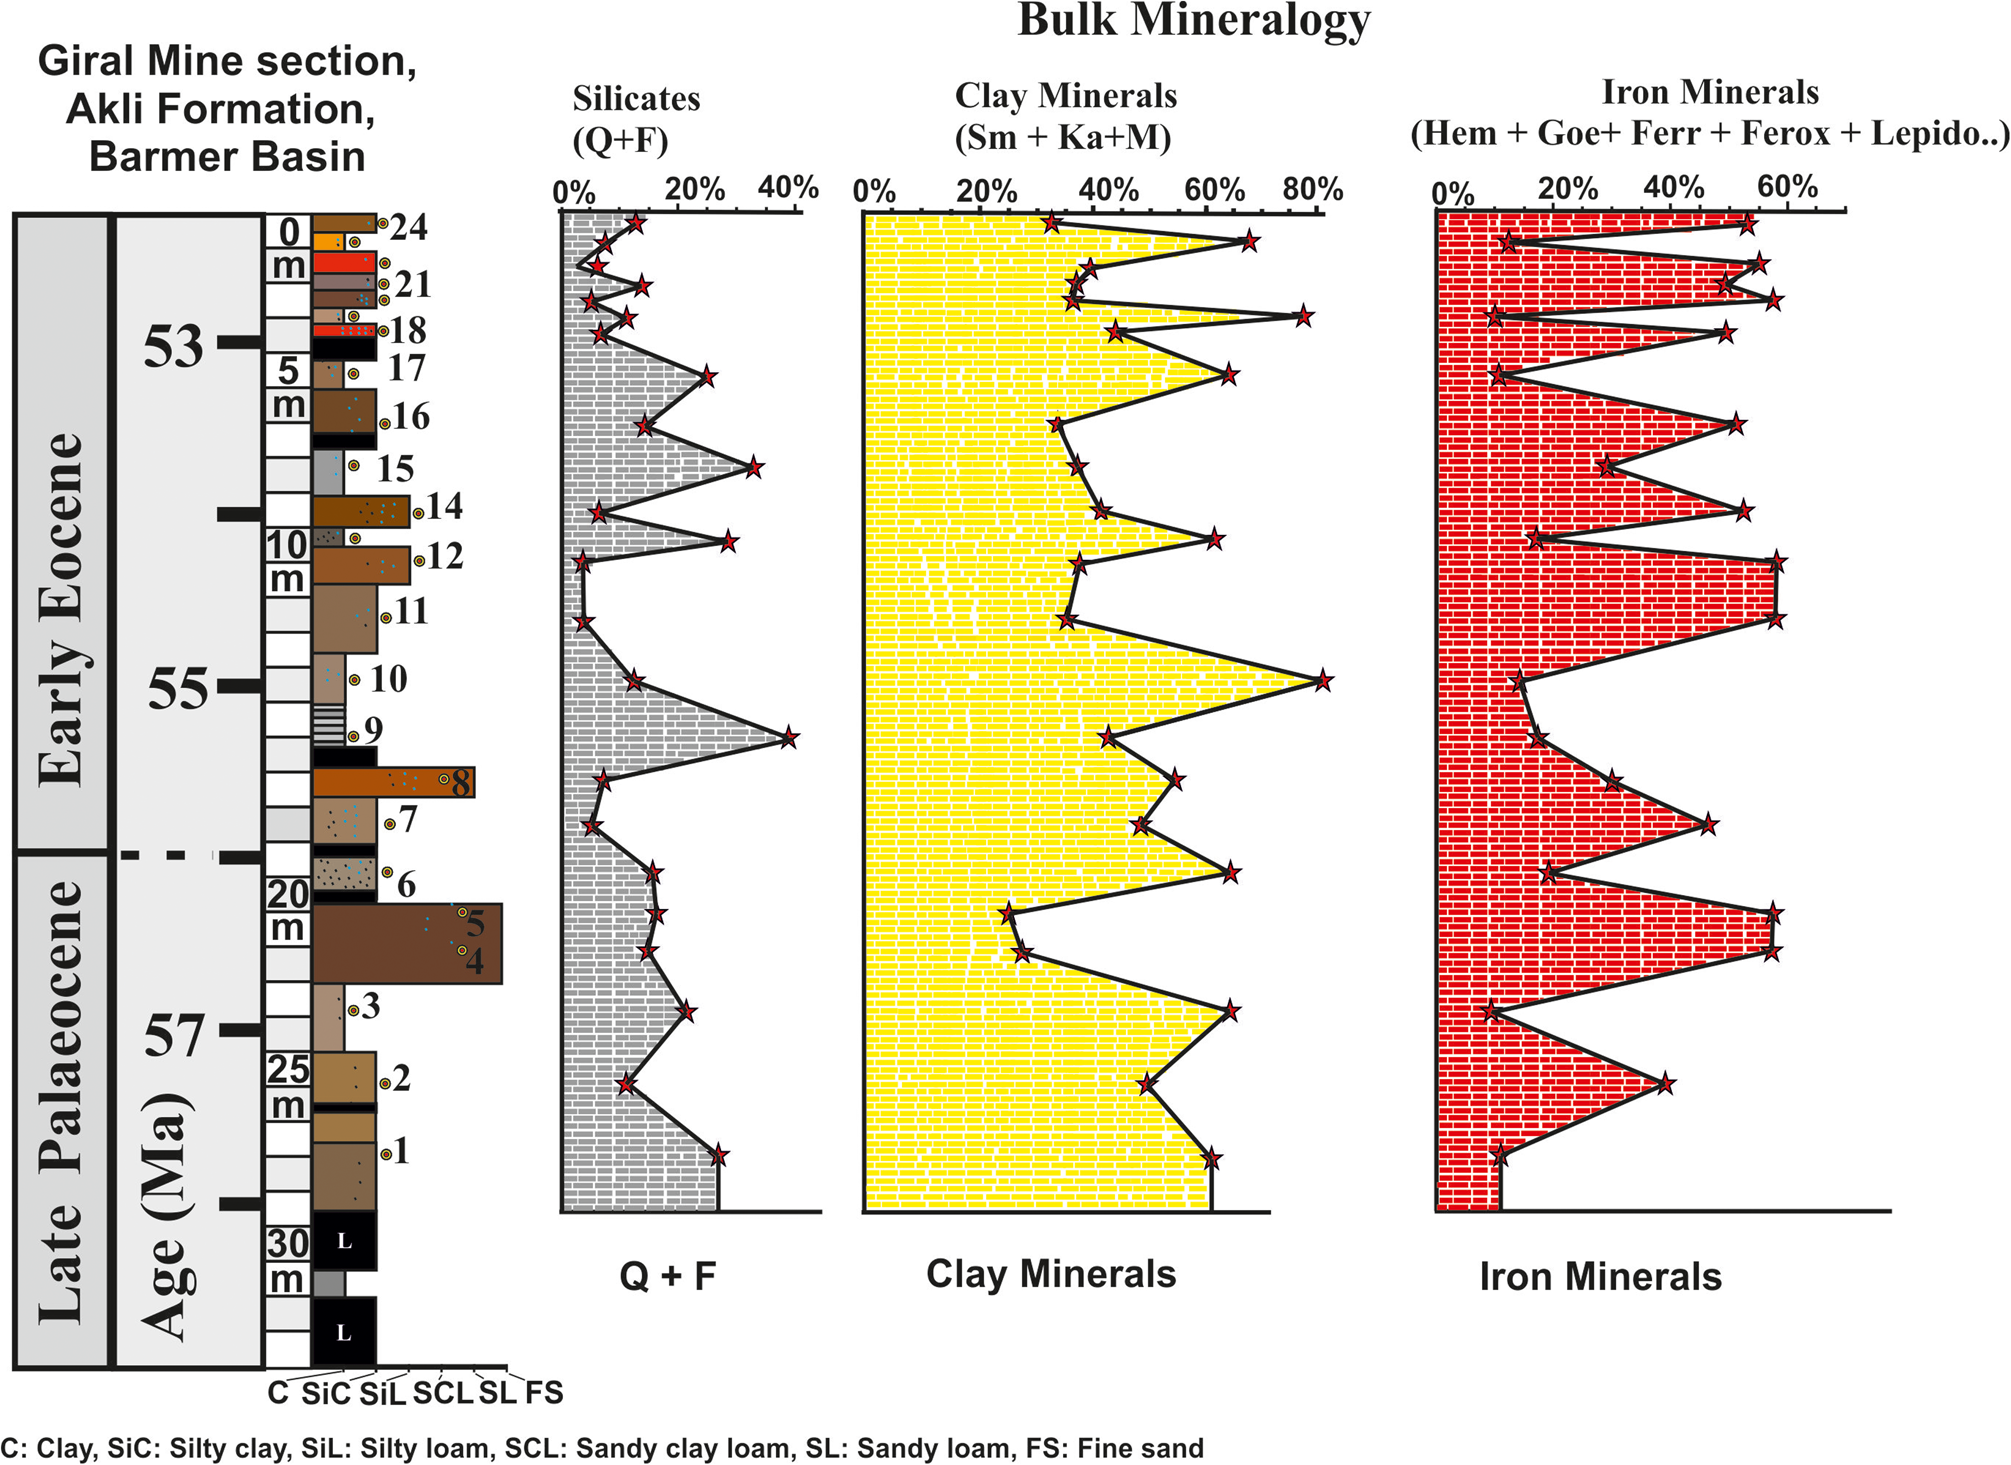
Figure 3. Bulk mineralogy of the 24 beds based on XRD of the randomly oriented powder samples showing the depth-wise distribution of the iron oxide minerals, clay minerals and non-clay silicates. Semi-quantitative estimates of the clay minerals (Sm, Ka, M), non-clay minerals (Q, F) and iron oxide minerals (hematite, goethite, ferrihydrite, feroxyhyte, lepidocrocite, maghemite, magnetite), Mn oxide (Mn3O4) and gypsum are summarized in Table 2.

Figure 4. XRD traces of random powder samples of beds 23 and 3. These beds are dominated by clay minerals (62–73%) and small amounts of iron oxide minerals (8–11%).

Figure 5. XRD traces of random powder samples of bed 4 and bed 16. These beds are dominated by iron oxide minerals (51–71%) and lesser amounts of clay minerals (18–28%).
Table 2. Bulk mineralogy based on random powder XRD of the 24 beds of the Giral mine section of the Akli Formation.

Hem = hematite (Fe2O3); Goe = goethite (α-FeO(OH)); Ferri = ferrihydrite (Fe2O3.0.5(H2O)); Ferrox = feroxyhyte (δ-FeO(OH)); Lepido = lepidocrocite (γ-FeO(OH)); Mghm = maghemite (Fe2O3, γ-Fe2O3); Mgm = magnetite (Fe3O4), Mn oxide = Mn3O4.
The clay beds consist on average of 59% clay minerals, 19% Q and F and 13% iron oxide minerals (Fig. 3 & Table 2). The silty clay beds consist on average of 43% clay minerals, 9.5% Q and F and 45% iron oxide minerals (Fig. 3 & Table 2). The silty loam beds consist on average of 28% clay minerals, 5% Q and F and 59% iron oxide minerals (Fig. 3 & Table 2). The sandy loam bed consists of 36% clay minerals, 10% Q and F and 46% iron oxide minerals (Fig. 3 & Table 2). Finally, the fine-grained sand beds consist on average of 17% clay minerals, 11% Q and F and 69% iron oxide minerals (Fig. 3 & Table 2).
The clay beds contain relatively low amounts of iron (13% average iron oxide minerals) in comparison to silty clay (45% average iron oxide minerals), silty loam (59% average iron oxide minerals), sandy loam (45.5% average iron oxide minerals) and fine-grained sands (69% average iron oxide minerals). The relative abundances of iron and manganese minerals in the 24 beds of the Giral mine follow the order hematite > goethite > ferrihydrite > feroxyhyte > lepidocrocite > magnetite > maghemite > Mn oxide (Table 2). Hematite varies from nil to 55%, goethite varies from nil to 34%, ferrihydrite varies from nil to 19%, feroxyhyte varies from nil to 11%, lepidocrocite varies from nil to 11.8%, maghemite varies from nil to 6.8%, magnetite varies from nil to 13.9% and the Mn oxide minerals vary from nil to 2.9% (Table 2).
Total clay (<2 μm) mineralogy
The mineralogy of the TC fraction (<2 μm) determined from orientated mounts is dominated by Sm and Ka, whereas M, Q and F occur in minor or trace amounts. The TC fraction mineralogy of the representative samples from 24 beds of the Giral mine section is summarized in Figs 6–8 and Table 3 and is briefly described here.
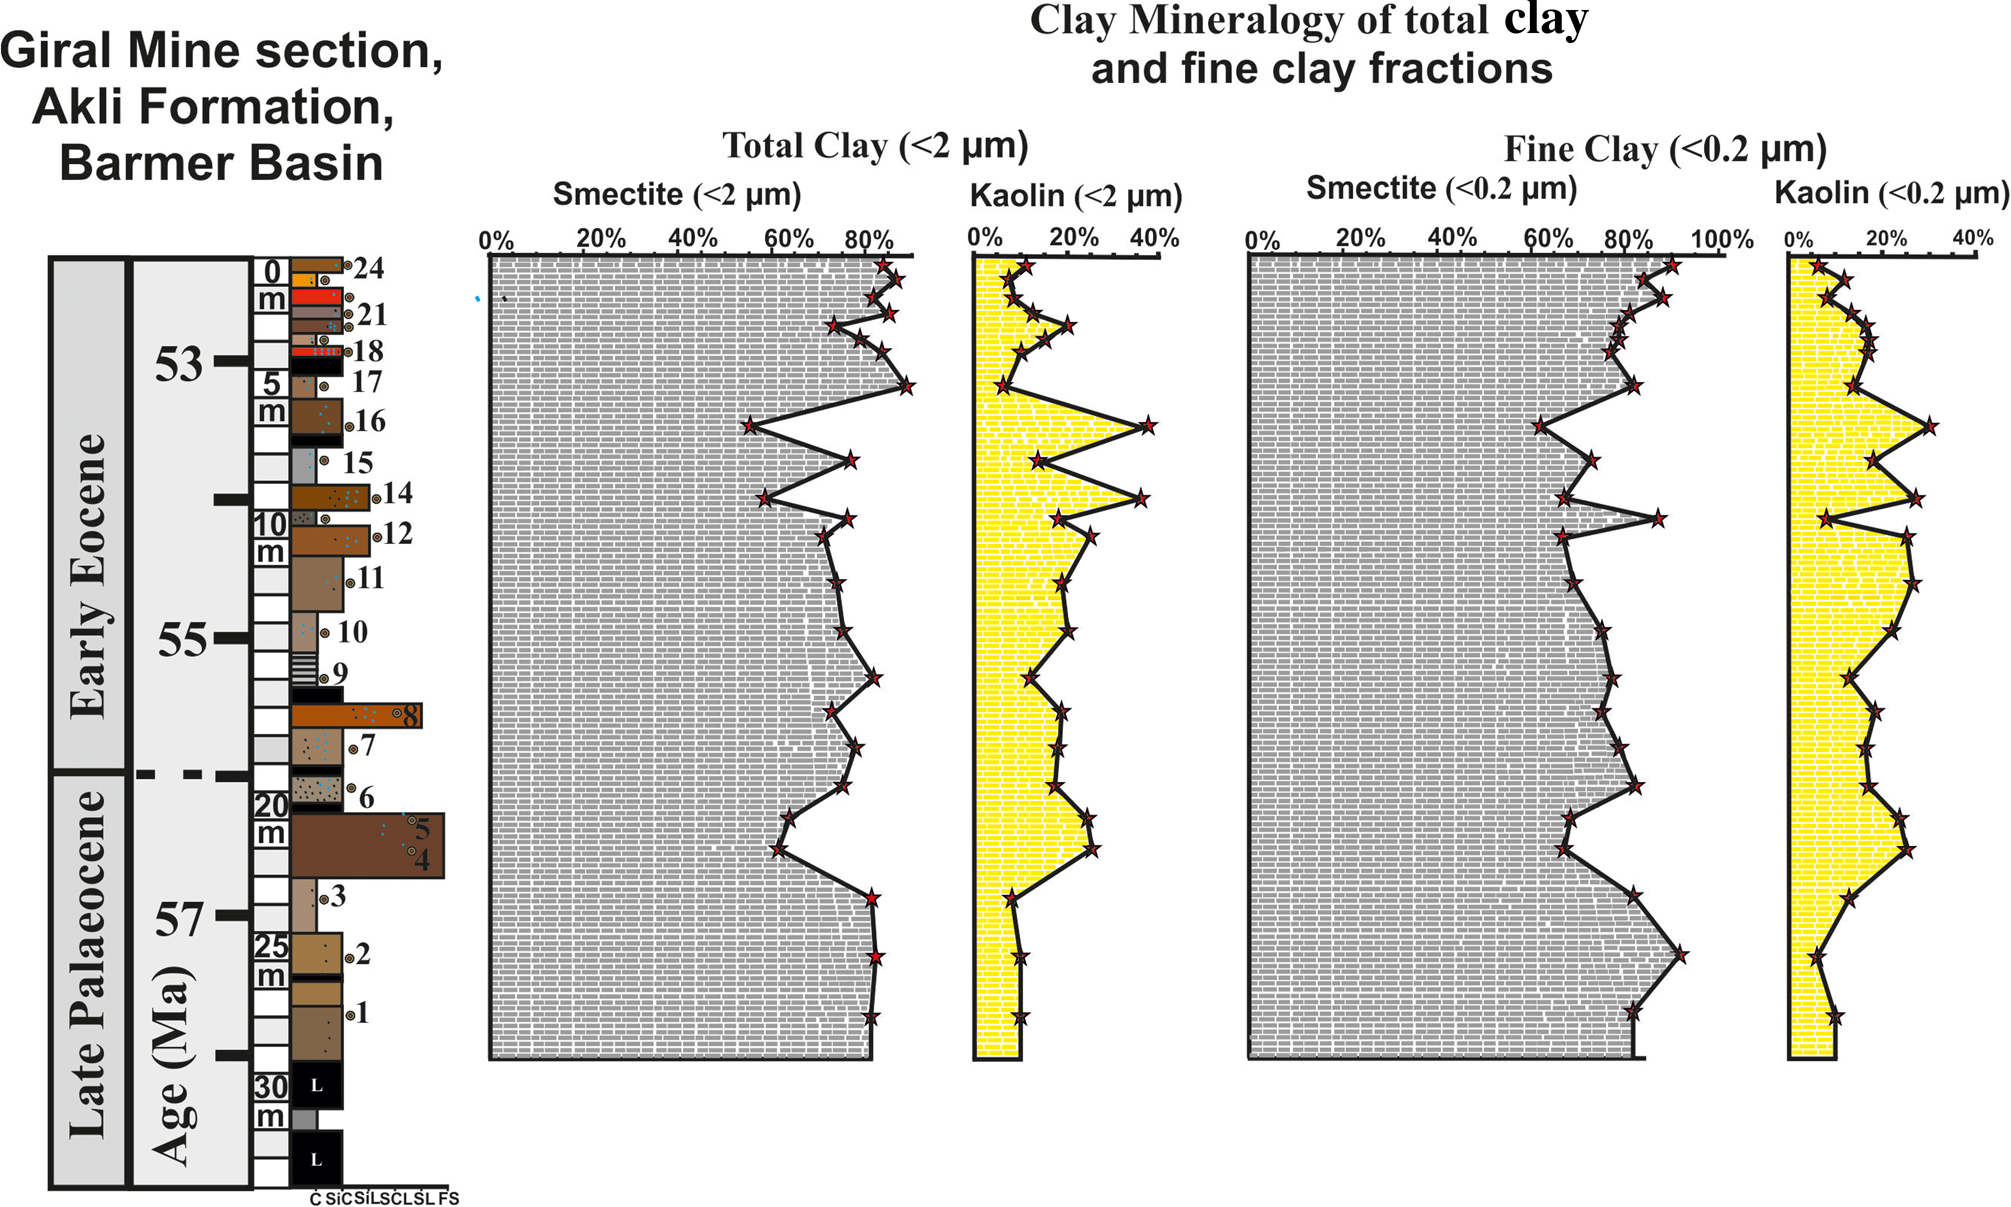
Figure 6. Depth-wise distribution of Sm and Ka in the TC (<2 μm) and FC (<0.2 μm) fractions of the 24 beds, showing abrupt increases and decreases in Ka and Sm in sediments of the Giral mine section.

Figure 7. Bed 2 XRD traces of the TC (<2 μm) and FC (<0.2 μm) fractions under various auxiliary treatments: Ca-saturation and solvation with ethylene glycol (Ca-Eg) and K-saturation and heating at 25°C, 110°C, 330°C and 550°C.

Figure 8. Bed 4 XRD traces of the TC (<2 μm) and FC (<0.2 μm) fractions under various auxiliary treatments: Ca-saturation and solvation with ethylene glycol (Ca-Eg) and K-saturation and heating at 25°C, 110°C, 330°C and 550°C.
Table 3. TC fraction (<2.0 μm) mineralogy of the 24 beds in the Giral mine sediments of the Akli Formation. Mineral abbreviations follow Table 2.

a Sm/Ka = transformation of Sm into Ka: a = <10%; b = >10%.
T = trace.
A semi-quantitative estimate of the XRD peaks shows that Sm is the main phase in all 24 beds and varies between 54 and 89% at various levels of the section (Fig. 6 & Table 3). Sm is marked by distinct trends of abrupt decrease from 81 to 60% between 23 and 20 m depth, followed by an increase from 63 to 82% between 20 and 9.5 m depth, then again it displays an abrupt decrease from 76 to 55% between 9.5 and 5.7 m depth, and then a further increase up to 89% with minor changes at the top of the section (Fig. 6 & Table 3). The Sm in most of the samples also showed Al-hydroxy interlayering and Sm/Ka interstratification in varying amounts at various levels of the section (Table 3).
Ka also occurs in all 24 beds and varies between 6 and 38% at various levels of the section (Fig. 6 & Table 3). Similarly to Sm, the Ka is also marked by distinct trends of abrupt increase or decrease, and it is anti-correlated with the Sm abundance (Fig. 9). Ka increases abruptly from 8% to 25% at 21 m depth. The increased abundance of the Ka continues from 21 to 5.5 m depth of the section, with several spikes of 25% at 21 m depth, 25% at 10 m depth, 35% at 8.5 m depth and 38% at 5.5 m depth with intervening low contents (5–8%; Fig. 6). In addition to Sm and Ka, the M, F and Q with their characteristic peaks occur in minor or trace amounts (Table 3).

Figure 9. Correlation of Sm vs Ka, total iron vs Ka and goethite vs Ka in the TC (<2 μm) and FC (<0.2 μm) fractions of the 24 beds.
Fine clay (<0.2 μm) mineralogy
The mineralogy of the FC fraction (<0.2 μm) of the 24 beds of the Giral mine section is summarized in Figs 6–8 and Table 4 and is briefly described here. Similarly to the TC fraction, the FC fraction is also marked by the dominance of Sm and Ka, with distinct trends of increases and decreases in the 32 m section (Figs 6–8 & Table 4). In the FC fraction of all 24 beds, the Sm varies between 66 and 92% at various levels (Table 4). The Sm is abundant (90–92%) in the lower part (22–27 m depth) and in the upper part (1–3 m depth) of the section (Table 4). Sm shows an abrupt decrease from ~90 to 67% at 20 m depth, which continues with minor changes up to 10 m depth (Fig. 6 & Table 4). The hydroxy interlayering in Sm is more widespread in the FC fraction. It varies from nil to 20% at various levels (Table 4). The interstratified Sm/Ka phase is an intermediate phase of the transformation of Sm into Ka and is also more abundant in the FC fraction compared to the TC fraction (Table 4).
Table 4. FC fraction (<0.2 μm) mineralogy of the 24 beds in the Giral mine sediments of the Akli Formation. Mineral abbreviations follow Table 2.

a Sm/Ka = transformation of Sm into Ka: a = <10%; b = >10%.
T = trace.
The Ka in the FC fraction occurs in all 24 samples, varying between 6 and 30% and showing abrupt to gradual changes in abundance (Table 3). Similarly to the TC fraction, the Ka in the FC fraction also shows strong anti-correlation with Sm (Fig. 9). The increase in Ka content in the FC fraction is marked by several spikes of 25% at 20–21 m depth, 26% at 10–11 m depth, 25–27% at 9 m depth and 30% at 5.5 m depth (Fig. 6 & Table 4). In addition, similarly to the TC fraction, the 7.2 Å peak of Ka in FC fraction is also marked by increased intensity and broadening during K-saturation and heating (Figs 7 & 8). The transformation of Sm into Ka in the FC fraction is much more distinct and frequent than in the TC fraction (Table 4). In addition to Sm and Ka, M, F and Q also occur in minor or trace amounts (Table 4).
The clay mineralogy of the TC and FC fractions of the 32 m Giral mine sections shows an abrupt increase in the abundance of Ka at 20–22, 10–11, 5–6 and 2–3 m depths, with corresponding decreases in abundance of Sm related to the various age intervals of the Akli Formation (Fig. 6). The age estimate of the 32 m Giral mine section shows that the varying abundances in the clay mineralogy at these depth intervals of the section correspond to: (1) pre-P–E transition (i.e. bed nos. 3 and 4), (2) during the P–E transition (i.e. bed nos. 5–8) and (3) post-P–E transition (i.e. bed nos. 12–14 and 18–20). The uppermost 2 m of the section with very high Sm (85–90%) and low Ka contents (5–11%) are similar to the lower part (25–27 m) of the section, showing high Sm (81–92%) and low Ka contents (5–10%) that characterize the pre-P–E and post-P–E clay mineralogies.
Discussion
Clay minerals in Akli Formation sediments and implications for hyperthermals in the palaeotropics
The PETM and subsequent hyperthermals have been studied extensively based on various proxies mainly in mid- to high-latitude regions (Kennet & Scott, Reference Kennett and Scott1991; Zachos et al., Reference Zachos, Wara, Bohaty, Delaney, Petrizzo and Brill2003; Wing et al., Reference Wing, Harrington, Smith, Bloch, Boyer and Freeman2005; Pagani et al., Reference Pagani, Pedentchouk, Huber, Sluijs, Schouten and Brinkhuis2006; Westerhold et al., Reference Westerhold, Röhl, McCarren and Zachos2009; Zeebe et al., Reference Zeebe, Zachos and Dickens2009). The clay mineral assemblage and in particular the increased abundance of kaolin has been considered to be one of the potential proxies reflecting hyperthermals in many mid- to high-latitude regions (Gibson et al., Reference Gibson, Bybell and Owens1993, Reference Gibson, Bybell and Mason2000; Clechenko et al., Reference Clechenko, Kelly, Harrington and Stiles2007; Kemp et al., Reference Kemp, Ellis, Mounteney and Kender2016; Tateo, Reference Tateo2020). However, the tropical environmental conditions during the PETM are not well understood, and there is a large uncertainty about the tropical ecosystem during the PETM at the global level (Jaramillo et al., Reference Jaramillo, Ochoa, Contreras, Pagani, Carvajal-Ortiz and Pratt2010; Walters et al., Reference Walters, Kemp, Hemingway, Johnston and Hodell2022). The present study reports the first clay mineral evidence of the PETM and ETM2 hyperthermals from a near-equatorial region represented by the Giral mine section of the Akli Formation. The palaeogeographical reconstruction of the Akli Formation, Barmer Basin, shows that it was located at 4.5° S in the near-equatorial region during the P–E transition (Fig. 10; after Scotese, Reference Scotese2010). Thus, the 32 m section of the Giral mine of the Akli Formation provides an important archive of the P–E transition sediments that could be used to explore the PETM and the subsequent hyperthermals in the palaeotropics.

Figure 10. (a) Palaeolatitudinal position for the present-day location of Giral lignite mine (26.0502777, 71.2669444) on the Indian Plate (501) (www.paleolatitude.org, version 2.1; after Torsvik et al., Reference Torsvik, Van der Voo, Preeden, Mac Niocaill, Steinberger and Doubrovine2012) calculated using the global apparent polar wander path where lower and upper bounds (grey) represent the 95% confidence interval. (b) A correlation of the equatorial climatic conditions of the Giral lignite mine with the palaeolatitudinal reconstruction of the Indian Plate at 60 Ma, 56 Ma (during the PETM), 40 Ma and in the present day (after Torsvik et al., Reference Torsvik, Van der Voo, Preeden, Mac Niocaill, Steinberger and Doubrovine2012).
The clay mineral record of both the TC (<2 μm) and FC (<0.2 μm) fractions of the Akli Formation is characterized by the dominance of Sm (60–92%) and Ka (5–38%). Unlike the modern sediments of the near-equatorial region, which consist mainly of Ka, the Akli Formation consists of mainly Sm and Ka because it originates from weathering of F-rich igneous rocks under tropical conditions. The Sm is montmorillonite with high Al and Fe contents. The 060 reflections of the TC and FC fractions at ~1.50 Å confirmed that Sm is dioctahedral. The chemical formula of the montmorillonite is ((Si3.52Al0.48)Al1.48Fe0.39Mg0.13)O10(OH)2)M+0.62 (Grim & Güven, Reference Grim and Güven1978).
The studied section shows abrupt changes in the abundances of Sm and Ka and the Ka:Sm ratio in pre-P–E transition, during P–E transition and post-P–E transition sediments that are related to palaeoenvironmental changes and weathering conditions in the palaeotropics (see Fig. 6 & Tables 3 & 4). The clay mineralogy of the Akli Formation suggests a 3–4-fold increase in Ka during the P–E transition in comparison to pre-P–E transition and post-P–E transition sediments (Fig. 6 & Tables 3 & 4). The 3–4-fold increase in Ka and the Ka:Sm ratio in the P–E transition sediments of the Akli Formation is attributed to increased warming and precipitation, which caused a further increase in the intensity of chemical weathering in the tropics. The increased chemical weathering during the P–E transition is suggested by the following key features: (1) the abrupt decrease in the Sm content from 90% to 60% during the P–E transition in comparison to pre-P–E and post-P–E sediments; (2) the grain-size change from silty clay or clay to loam and fine-sand during the P–E transition due to increased runoff; (3) the increased sequestration of iron oxides in sediments, which is more evident when goethite (α-FeO(OH)) is correlated with Ka (Fig. 9); (4) the abrupt occurrence of ~20% charcoal fragments in sediments at the P–E boundary (Fig. 11); (5) the abrupt appearance and increased proportion of gypsum to ~8–10%; and (6) the acidic conditions (pH 4–5) during the P–E transition in comparison to neutral pH conditions found for the pre-P–E and post-P–E sediments of the Akli Formation (Fig. 11).

Figure 11. Depth-wise distribution of iron oxide ratios (hematite + maghemite + magnetite)/(goethite + ferrihydrite + feroxyhyte), iron oxide/Ka ratios and Ka/Sm ratios in the TC and FC fractions, charcoal fragments and gypsum contents and pH in the 24 beds of the Giral lignite mine section. The clay mineralogy from this study is also compared with the δ13Corg curve of the section from Khozyem et al. (Reference Khozyem, Adatte, Keller and Spangenberg2021), demonstrating the correspondence with the Ka pulse and CIE in the Akli Formation sediments.
The abovementioned observations regarding clay minerals, iron oxide minerals, charcoal, gypsum and acidic conditions indicate further warming and wetting in the normal tropical conditions resulted in further increases to chemical weathering linked to the PETM and ETM2 hyperthermals. The clay mineralogy of the Akli Formation P–E transition sediments, showing warming, wetting and increased chemical weathering, is also well-supported by the carbon isotopic composition (δ13C) of the sediments of the studied section and the nearby lignite mines of western India (Khozyem et al., Reference Khozyem, Adatte, Keller and Spangenberg2021). The Akli Formation sediments are marked by the two prominent CIEs linked to the PETM and subsequent ETM2 hyperthermals (Khozyem et al., Reference Khozyem, Adatte, Keller and Spangenberg2021). The first 2–3‰ negative shift of δ13Corg reported by Khozyem et al. (Reference Khozyem, Adatte, Keller and Spangenberg2021), with a corresponding 3–4-fold increase in the Ka at ~20 m depth in the Akli Formation, is consistent with the PETM, whereas the second 2–3‰ negative shift of δ13Corg corresponds to another 3–4-fold increase of Ka in the upper part of the 32 m section, which is related to the ETM2 (Fig. 11). The warming and wetting interpreted here based on clay mineralogy are consistent with globally recorded warming, CIEs, acidification and an abrupt change in the hydrological cycle (Dickens et al., Reference Dickens, O'Neil, Rea and Owen1995; Zachos et al., Reference Zachos, Röhl, Schellenberg, Sluijs, Hodell and Kelly2005; McInerney & Wing, Reference McInerney and Wing2011; Westerhold et al., Reference Westerhold, Marwan, Drury, Liebrand, Agnini and Anagnostou2020). The palynological work on the Akli Formation sediments also supports this interpretation through the appearance of Nypa-like pollens during the P–E transition, a marker of warm, tropical regions (Chaloner, Reference Chaloner and Drake1968; Morley, Reference Morley2000; Tripathi et al., Reference Tripathi, Singh and Sisodia2003, Reference Tripathi, Kumar and Srivastava2009).
Equatorial Ka pulse during P–E hyperthermals in relation to mid- to high latitudes
The Ka pulse (3–4-fold increase) in sediments deposited during the PETM has been used as an important criterion defining intense chemical weathering due to enhanced warming and significant precipitation during the hyperthermals (Gibson et al., Reference Gibson, Bybell and Owens1993; Robert & Kennett, Reference Robert and Kennett1994, Reference Robert and Kennett1997; Knox, Reference Knox1996; Gawenda et al., Reference Gawenda, Winkler, Schmitz and Adatte1999; Bolle & Adatte, Reference Bolle and Adatte2001; Kemp et al., Reference Kemp, Ellis, Mounteney and Kender2016). However, most of the examples reporting a Ka pulse during the PETM are from mid- to high latitudes, except for one from low latitudes (Bolle & Adatte, Reference Bolle and Adatte2001). The mid- and high-latitude examples of the Ka pulse (Fig. 12) include: (1) the New Jersey Formation from north Atlantic coastal plains showing an increase in Ka from 4–8% to 38–58% during the PETM (Gibson et al., Reference Gibson, Bybell and Owens1993); (2) the latest Palaeocene sediment core from eastern Antarctica showing an increase of Ka in sediments from ~5% to ~30% during the PETM due to increased chemical weathering, temperature rises and increased precipitation (Robert & Kennett, Reference Robert and Kennett1994); (3) the P–E boundary events from north-west Europe and the North Sea showing an appreciable increase in the proportion of Ka (Knox, Reference Knox1996; Kemp et al., Reference Kemp, Ellis, Mounteney and Kender2016); and (4) the P–E Zumaria Series of northern Spain showing a large increase in the Ka:Sm ratio during the PETM (Gawenda et al., Reference Gawenda, Winkler, Schmitz and Adatte1999). Apart from mid- to high-latitude Ka pulses reported worldwide, the P–E transition sediments from the Tethys Sea at ~24° N palaeolatitude also show an appreciable increase of Ka due to increased chemical weathering (Fig. 12; Bolle & Adatte, Reference Bolle and Adatte2001). The Ka pulse recorded in the Akli Formation representing a near-equatorial palaeogeographical location confirms increased chemical weathering in the tropical regions during the P–E transition. Thus, the PETM and the subsequent hyperthermals occurred globally and influenced both low and mid- to high latitudes in similar ways (Carmichael et al., Reference Carmichael, Inglis, Badger, Naafs, Behrooz and Remmelzwaal2017; Walters et al., Reference Walters, Kemp, Hemingway, Johnston and Hodell2022).

Figure 12. Global paleogeography during the PETM (Thanetian/Ypresian) at 55.8 Ma with important locations where Ka pulses during the PETM have been reported together with the present study of the Giral lignite mine section, Akli Formation, Barmer Basin, on the PETM map (modified after Scotese, Reference Scotese2010). This highlights six locations during the PETM: 1 = New Jersey Formation (after Gibson et al., Reference Gibson, Bybell and Owens1993); 2 = ODP site 690B (after Robert & Kennet., Reference Robert and Kennett1992); 3 = north-western Europe (after Knox, Reference Knox1996; Kemp et al., Reference Kemp, Ellis, Mounteney and Kender2016); 4 = Zumaria Series, north Spain (after Gawenda et al., Reference Gawenda, Winkler, Schmitz and Adatte1999); 5 = North Sea Basin (after Walters et al., Reference Walters, Kemp, Hemingway, Johnston and Hodell2022); 6 = southern Tethys Sea (after Bolle & Adatte, Reference Bolle and Adatte2001). In addition, 7 = present study of the Giral mine section, India.
Genesis of Sm and Ka during P–E hyperthermals in the palaeotropics
To trace the origin of Sm and its transformation, we refer to the weathering of F-rich source rocks under humid, tropical conditions. Indeed, the formation of Sm and Ka in tropical environments is attributed to the hydrolysis of silicate minerals such as F and M during weathering (De Kimpe et al., Reference De Kimpe, Gastuche and Brindley1961; Rengasamy et al., Reference Rengasamy, Sarma, Murthy and Murti1978; Gilkes & Suddhiprakran, Reference Gilkes and Suddhiprakran1979; Anand et al., Reference Anand, Gilkes, Armitage and Hillyer1985). Sediments of the Akli Formation were sourced mainly from the Malani Igneous Suite, consisting of rhyolite, tuff and granite (Eby & Kochhar, Reference Eby and Kochhar1990; Maheshwari et al., Reference Maheshwari, Sial, Coltorti, Chittora and Cruz2001; Gregory et al., Reference Gregory, Meert, Bingen, Pandit and Torsvik2009). The palaeolatitudinal history of the Akli Formation shows that it was located at ~4.5° S in a near-equatorial position (Fig. 10). The expected temperature and precipitation anomalies over equatorial or tropical regions during the PETM indicate an increase in average temperature of ~3–5°C and a 25–50% increase in precipitation (Inglis et al., Reference Inglis, Bragg, Burls, Cramwinckel, Evans and Foster2020; Rush et al., Reference Rush, Kiehl, Shields and Zachos2021). The present-day climate in the equatorial region is marked by an 28°C average temperature, 2100 mm average precipitation and very high humidity (Meng et al., Reference Meng, Zhang, Wong and Au2016; Kristo et al., Reference Kristo, Rahardjo and Satyanaga2017). Thus, increases in temperature and rainfall during the P–E transition in the near-equatorial region must have intensified the chemical weathering that caused a 3–4-fold increase in Ka at the expense of Sm in the Akli Formation (Fig. 11).
The increased amounts of Ka at the expense of Sm can be understood by the weathering characteristics of the F-rich igneous rocks that indicate Sm as the first weathering product under humid conditions (Tardy et al., Reference Tardy, Bocquier, Paquet and Millot1973). This is in accordance with the studies of <2 μm fractions separated from weathering rinds of the basalts from central and southern India, which showed a dominance of dioctahedral Sm and very small amounts of Ka (Pal & Deshpande, Reference Pal and Deshpande1987). The presence of Ka next to excess Sm in the weathering rinds has been explained due to there being larger pores in the mineral grains (Tardy et al., Reference Tardy, Bocquier, Paquet and Millot1973; Pal & Deshpande, Reference Pal and Deshpande1987). This is also consistent with the weathering profiles of the alkali igneous rocks such as rhyolite and granite showing the dominance of Sm and a small proportion of Ka in the clay fractions due to hydrolysis of F (Harriss & Adams, Reference Harriss and Adams1966; Nesbitt & Young, Reference Nesbitt and Young1984). The great amounts of Sm after weathering of alkali extrusive rocks can be explained by the weathering kinetics of alkali volcanics and their crystalline equivalents (Nesbitt & Young, Reference Nesbitt and Young1984). Glass with an albite and K-feldspar composition is much less stable than its crystalline equivalents under ambient weathering conditions (Nesbitt & Young, Reference Nesbitt and Young1984). Under such conditions, when volcanic glass is the primary phase that undergoes weathering, the stability field of Sm is expanded greatly, which results in a larger amount of Sm as the weathering product than in the crystalline phase (White et al., Reference White, Hem and Waring1963; Nesbitt, Reference Nesbitt1977; Nesbitt & Young, Reference Nesbitt and Young1984). Hence, the large amounts of Sm (80–90%) and small amounts of Ka (5–10%) in the pre-PETM and post-PETM sediments of the Akli Formation are due to the weathering of rhyolite and granite under humid, tropical conditions (Figs 6 & 11).
The increased proportion of Ka (25–30%) during the PETM and subsequent ETM2 in sediments of the Akli Formation is attributed to warming by 3–5°C and to precipitation increasing by 25–50% in the equatorial region. This change of climate to much warmer and wetter conditions during the PETM than during the pre-PETM period resulted in more intense chemical weathering and hydrolysis of F in the rhyolite source of the Akli Formation sediments. This is also supported by increased acidic conditions (pH from 7.5 to 4 and 5), decreased Sm proportions from 85–90% to 55–60%, increased proportions of iron oxide minerals with a larger amount of goethite and unusual appearances of charcoal at ~20% in sediments deposited during the PETM (Fig. 11). In such acid-weathering environmental condition, Sm is highly unstable and transforms into 1:1 clay minerals, such as Ka (Herbillon et al., Reference Herbillon, Frankart and Vielvoye1981; Chitale & Gueven, Reference Chitale and Gueven1989; Bhattacharyya et al., Reference Bhattacharyya, Pal and Deshpande1993). The possible mechanism that explains the conversion of the 2:1 layer silicate to a 1:1 structure involves hydroxy interlayering in Sm, interstratification between Sm and Ka and direct conversion of Sm into Ka (Herbillon et al., Reference Herbillon, Frankart and Vielvoye1981; Chitale & Gueven, Reference Chitale and Gueven1989; Bhattacharyya et al., Reference Bhattacharyya, Pal and Deshpande1993). This work on the clay mineralogy of the Akli Formation shows that Sm, in general, is characterized by Al-hydroxy interlayering, as the XRD traces of the TC and FC fractions are marked by an incomplete expansion of the 14–15 Å peaks on glycolation and broadening of the low-angle side of the 10 Å on K-saturation and heating to 550°C (Fig. 7). The hydroxy interlaying in Sm is more pronounced in sediments of the Akli Formation deposited during the PETM and subsequent hyperthermals than before or after the PETM. The hydroxy interlayering in Sm is the result of an acid-weathering environment that causes the incorporation of hydroxy-Al polymeric components within the interlayer spaces of the expansible layer silicates (Barnhisel & Bertsch, Reference Barnhisel and Bertsch1989; Bhattacharyya et al., Reference Bhattacharyya, Pal and Deshpande1993; Dietel et al., Reference Dietel, Ufer, Kaufhold and Dohrmann2019).
The Sm to Ka transformation is also a common feature of the Akli Formation sediments, which is increased during the PETM and subsequent hyperthermals (Table 3). The Sm to Ka transformation in the TC and FC fractions is indicated by a low-angle plateau at ~7.0 Å in the Ca-saturated samples that shifts to 8.0 Å upon glycolation (Figs 7 & 8). Interstratified Sm/Ka has been reported from the ferruginous soils of southern India and the well-developed soils of the Gangetic Plains due to increased humidity (Pal et al., Reference Pal, Deshpande, Venugopal and Kalbande1989; Bhattacharyya et al., Reference Bhattacharyya, Pal and Deshpande1993; Srivastava et al., Reference Srivastava, Parkash and Pal1998), as well as elsewhere (Wilson & Cradwick, Reference Wilson and Cradwick1972; Norrish & Pickering, Reference Norrish and Pickering1983; Delvaux et al., Reference Delvaux, Herbillon, Vielvoye and Mestdagh1990). Because of these considerations, it is suggested here that the PETM and subsequent hyperthermal ETM2 events in the near-equatorial regions resulted in the large-scale transformation of Sm into 1:1 layer silicates through the following pathway:
Sm (after rhyolite weathering) → hydroxy interlayering (acid-weathering environment) → mixed-layer Sm/Ka (Sm to Ka transformation under a continued acid-weathering environment) → Ka
The abundant iron oxide minerals and red-coloured sediments during the Ka pulse in the Akli Formation can be explained through the dissolution kinetics of the Sm. The dissolution kinetics of the Sm-rich bentonite under acidic conditions is characterized by the release of Si, Al, Mg, Ca, Na and Fe from initial rapid to later slow rates from interlayer, tetrahedral and octahedral sheets of the Sm during its transformation into a 1:1 layer silicate (Metz et al., Reference Metz, Raanan, Pieper, Bosbach and Ganor2005; Rozalén et al., Reference Rozalén, Huertas, Brady, Cama, García-Palma and Linares2008; Marty et al., Reference Marty, Cama, Sato, Chino, Villiéras and Razafitianamaharavo2011; Robin et al., Reference Robin, Tertre, Regnault and Descostes2016). The release of interlayer cations is highly non-stoichiometric, while the release of Al, Si and Mg is stoichiometric. The release of Fe from octahedral sheets is comparable to the release of Al and Mg, but it occurs at a slower rate. However, a larger amount of Fe than expected after the dissolution was observed, which was explained due to the re-precipitation of Fe as hematite and goethite (Metz et al., Reference Metz, Raanan, Pieper, Bosbach and Ganor2005). The presence of abundant Fe as iron oxide minerals supports the relative mobility of the major elements during weathering of the igneous rocks under ambient conditions in the following order: Ca > Na> Mg > K > Si > Fe > Al > Ti (Polynov, Reference Polynov1937; Anderson & Hawkes, Reference Anderson and Hawkes1958; Lasaga et al., Reference Lasaga, Soler, Ganor, Burch and Nagy1994). The Fe released during the decomposition of the primary minerals is quite immobile, forms stable iron oxides/oxyhydroxides such as ferrihydrite, goethite and hematite and causes the reddish colour in soils and sediments (Birkeland, Reference Birkeland1999; Churchman, Reference Churchman and Summer2000). This explains why the Ka pulses during the PETM and ETM2 in the Akli Formation are accompanied by large amounts of iron oxide minerals and red-coloured sediments (Fig. 2 & Table 1). This is consistent with weathering under humid, tropical conditions marked by intense chemical weathering of the primary minerals, accounting for the large amounts of iron oxides in these soils and sediments (Kronberg et al., Reference Kronberg, Fyfe, McKinnon, Couston, Filho and Nash1982; Chandran et al., Reference Chandran, Ray, Bhattacharyya, Srivastava, Krishnan and Pal2005; Simas et al., Reference Simas, Schaefer, Fernandes Filho, Chagas and Brandão2005; Morón et al., Reference Morón, Fox, Feinberg, Jaramillo, Bayona, Montes and Bloch2013).
It is suggested that warming and wetting resulted in the large-scale transformation of the Sm along with the release of great amounts of Fe that formed iron oxide minerals (Figs 4 & 5 & Table 2). This is consistent with the greater concentration of iron oxide minerals in P–E transition palaeosols from the Bogota Basin of Colombia due to the increased rate of weathering and pedogenesis (Morón et al., Reference Morón, Fox, Feinberg, Jaramillo, Bayona, Montes and Bloch2013). The anomalously high concentrations of fine-grained iron oxide minerals at the P–E boundary sediments of Wilson Lake, New Jersey, also provide evidence for increased chemical weathering during the PETM, which resulted in the greater production of iron oxides in these sediments (Lippert & Zachos, Reference Lippert and Zachos2007).
Forest fires and charcoal during the PETM in the palaeotropics
The unusually high proportion of charcoal in sediments of the Akli Formation during the P–E transition is related to large-scale forest wildfires. This finds support from the great amounts of charcoal fragments in the PETM sediments across the globe due to repeated fires at local to regional scales as an environmental response to warming during the hyperthermals (Scott, Reference Scott2000; Crosdale, et al., Reference Crosdale, Sorokin, Woolfe and Macdonald2002; Kurtz et al., Reference Kurtz, Kump, Arther, Zachos and Paytan2003; Collinson, et al., Reference Collinson, Steart, Scott, Glasspool and Hooker2007). For example, unusually high concentrations of macroscopic charcoal fragments in the Cobham Lignite of England are consistent with the CIE at the P–E boundary (Scott, Reference Scott2000; Collinson, Reference Collinson2001, Collinson et al., Reference Collinson, Hooker and Groecke2003). In addition, some of the Palaeocene Russian coals are also unusually rich in charcoal, suggesting wildfires due to warming (Crosdale et al., Reference Crosdale, Sorokin, Woolfe and Macdonald2002). To test the wildfire hypothesis at the PETM, two Ocean Drilling Program (ODP) cores with a continuous PETM record from the Bass River site (ODP, Leg 174AX), New Jersey Margin, and Shatsky Rise (ODP 1210B) were explored to understand the causal relationship underlying the charcoal at the P–E boundary (Moore & Kurtz, Reference Moore and Kurtz2008). Both sites show an unusually large amount of charcoal fragments in sediments, consistent with the CIE during the PETM (Moore & Kurtz, Reference Moore and Kurtz2008). It was concluded that biomass burning was an environmental response to increased temperatures during the PETM and not the reason for the PETM (Moore & Kurtz, Reference Moore and Kurtz2008).
The abrupt appearance of macroscopic charcoal fragments in lower parts of the section at amounts of ~20% in sediments of the Akli Formation is consistent with the Ka pulse at the PETM (Figs 2 & 11). The charcoal again appears (5–7%) in upper parts of the section during the subsequent ETM2 hyperthermal (Figs 2 & 11). The presence of charcoal in this near-equatorial location during the P–E transition supports the notion that widespread wildfires were caused by unusual warming during the PETM and subsequent ETM2. The large amounts of charcoal fragments during the PETM and ETM2 are also consistent with the reports of 10–20% inertinite in the Early Palaeogene lignites of Gujrat and Rajasthan, western India (Rajak et al., Reference Rajak, Singh and Singh2019). The large amounts of charcoal in the Early Palaeogene lignites of western India are comparable with those of the southern England, New Jersey and Schoningen lignites that characterise the PETM event at the global level (Scott, Reference Scott2000; Crosdale et al., Reference Crosdale, Sorokin, Woolfe and Macdonald2002; Kurtz et al., Reference Kurtz, Kump, Arther, Zachos and Paytan2003; Collinson et al., Reference Collinson, Steart, Scott, Glasspool and Hooker2007; Robson et al., Reference Robson, Collinson, Riegel, Wilde, Scott and Pancost2015).
Conclusions
This study provides the clay mineral evidence regarding the PETM and subsequent ETM2 hyperthermals from a near-equatorial region represented by the Akli Formation of Barmer Basin, India. The 32 m-thick P–E transition sediments in this near-equatorial location are characterized by abrupt changes in the abundance of Sm and Ka. It is also characterized by a 3–4-fold increase (from 5–10% to 25–35%) of Ka in sediments during the P–E transition in comparison to pre-P–E and post-P–E transition sediments. The Ka pulse was caused by warming (3–5°C), increased precipitation (25–50%) and increased chemical weathering in the near-equatorial region. However, the Sm, which formed after rhyolite weathering, is marked by an abrupt decrease from 90% to 60% during the P–E transition compared to pre-P–E and post-P–E transition sediments. The acid-weathering conditions during the P–E transition in the equatorial region resulted in a large-scale transformation of the Sm into Ka. Dissolution of the Sm during the P–E hyperthermals resulted in the formation of iron oxide minerals and red- to deep red-coloured sediments. The abrupt appearance of unusually large amounts (~20%) of macroscopic charcoal fragments in these sediments is consistent with the Ka pulse during the P–E transition and confirms wildfire activity in the near-equatorial regions, supporting unusual warming and the widespread wildfire hypothesis during the PETM. The Ka pulse, dissolution of Sm under acid-weathering conditions and the wildfire evidence from Akli Formation sediments are consistent with the CIEs of the Barmer Basin and the global reference curves. Thus, the Akli Formation sediments deposited during the P–E transition represent an important terrestrial archive of near-equatorial PETM and ETM2 conditions.
Acknowledgements
We thank the editor and the associate editor of Clay Minerals for the efficient editorial handling of the manuscript. We are grateful to the two experts who critically reviewed previous versions of the manuscript and suggested revisions to the manuscript. The revised version of the manuscript benefitted greatly from their comments and suggestions. Thanks are due to PS's lab group members Neha and Pooja for their help during the analytical work. We are grateful to Dr D.K. Pal and Prof. D.C. Srivastava for helpful discussions that improved the revised version of the manuscript.
Financial support
This research was partially funded by the Ministry of Earth Sciences (MOES) and Science and Engineering Research Board (SERB) through research grants to PS for palaeoclimatic studies on the Indian subcontinent. RK and AH are grateful to the University Grants Commission (UGC) and Council of Scientific and Industrial Research (CSIR) for junior and senior research fellowships.
Competing interest
The authors declare none.


