


Implications
Dystocia is a significant cause of female and neonatal death in horse breeding (McCue and Ferris, Reference McCue and Ferris2012). Breeders are generally amateurs who are not interested in modern genetics. Fortunately, French breeding associations have recorded data on foaling ease and stillbirths in four breeds of draft horses for over 10 years. By studying gestations in inter-bred mares, it was first evidenced in 1938 and recently confirmed that the size of the mare regulated foal size (Walton and Hammond, 1938; Allen et al., Reference Allen, Wilsher, Turnbull, Stewart, Ousey, Rossdale and Fowden2002). As the biology of gestation may differ between horses and cattle, this original genetic study has proven its usefulness. Knowing heritability and genetic correlation between the capacities for a stallion to produce foals easy to birth and mares easy to foal, breeding values are now available.
Introduction
In horses, the relative importance of heredity and the environment in the intrauterine development of foal and foaling difficulties of mares is a long-standing issue, which was first reported in 1937 by Walton and Hammond in a paper describing spectacular crosses between Shetland ponies and Shire horses. Their results suggested that foetal growth was controlled by the mare, hence concealing many genetic differences in the foal. Since then, the components of dystocia and stillbirths (SBs; gestation length, position and posture of the foetus, size of mare and foal, placenta characteristics and duration of labour) have been studied to elucidate the underlying mechanisms and to prevent their occurrence (Ginther and Williams, Reference Ginther and Williams1996; Allen et al., Reference Allen, Wilsher, Turnbull, Stewart, Ousey, Rossdale and Fowden2002; Allen et al., Reference Allen, Brown, Wright and Wilsher2007; Langlois et al., Reference Langlois, Blouin and Chaffaux2012; McCue and Ferris, Reference McCue and Ferris2012; Squires et al., Reference Squires, Hughes, Ball, Troedsson and Stowe2013). These studies were for the most part conducted on warmblood horses (thoroughbred, quarter horses) where both the foal and the mare are worth enough to call for adequate care at foaling. In France, the problem of foaling difficulties was raised by breeders of heavy horses. They had been recording foaling scores and data on SB for more than 10 years. Their objective was to improve their breeds by selection on these characteristics. Recently, statistical tools have become available for estimating both genetic parameters for complex threshold traits (such as scores) and direct and maternal effects (such as the biology of dystocia) in animal models. These Markov Chain Monte Carlo (MCMC) and Gibbs sampling methods (Lopez de Maturana et al., Reference Lopez de Maturana, Legarra, Varona and Ugarte2007; Legarra et al., Reference Legarra, Varona and Lopez de Maturana2011) avoid the biased inference of restricted maximum likelihood (REML) methodology for binary traits (Moreno et al., Reference Moreno, Sorensen, GarciaCortes, Varona and Altarriba1997).
The aim of this paper was to estimate genetic parameters for dystocia or, a contrario foaling ease (FE) and SBs, in breeds of draft horses.
Material and methods
Data
French birth registration forms for draft horses include, since 1998, a score to record the conditions of foaling. In this study, we focused on the main breeds: Breton (B), Comtois (C), Percheron (P) and a fourth category designated Ardennais (A) including Ardennais, Auxois, Trait du Nord breeds between which the genetic distance is very small and that can mate together (Leroy et al., Reference Leroy, Callede, Verrier, Meriaux, Ricard, Danchin-Burge and Rognon2009). Only pure bred births from 1998 to 2010 were considered. Scores for FE were assigned by the breeder: ‘without help’, ‘easy’, ‘difficult’ and ‘intervention of the veterinarian’. It was found to be difficult, both for breeders and during data analysis, to clearly distinguish between ‘without help’ and ‘easy’. The data for these two categories were therefore grouped during analysis and we used three ordered categories: 1=‘without help or easy’, 2=‘difficult’, 3=‘intervention of the veterinarian’. Data were missing about foaling difficulty on the registration forms in 21% to 30% of cases, but without any particular distribution depending on the region, maternal age, sex of foal or sires. Cases of observed dystocia were excluded if the sex of the foal was missing (1%). Unfortunately the scores for these excluded observations were high with 31% of the births recorded as ‘difficult’, instead of 3% to 7% in the data retained for analysis. But as the sex ratio remained close to 50% in the analysed data, we expected the estimates not to be biased for the effects included in the model. SBs were defined as foals that were born dead and never showed a detectable heartbeat. The characteristics of the data sets are provided in Table 1. All available pedigree data for mares and foals were used in the analysis. Therefore, between 17 231 and 54 932 animals were included in the analysis depending on the breeds (Table 2). The mean number of births per mare ranged from 2.7 (P) to 3.0 (B) and the mean number of births per sire ranged from 16.5 (A) to 29.8 (P).
Table 1 Total number of births, analysed births and distribution of scores for FE and SBs in the four breeds
FE=foaling ease; SB=stillbirth.
Table 2 Number of horses in pedigrees used in the analysis in the four breeds
Method
A threshold mixed model was assumed for each of the traits. This model (Sorensen and Gianola, Reference Sorensen and Gianola2002) considers one (for binary traits) or several thresholds (for polychotomous traits) and a liability that, over a given threshold, produces an observed phenotype. The liability follows a normal distribution and may be explained by a classical linear model. A multiple-trait threshold linear mixed model with three categories of observations for FE and two for SB was assumed. Each trait followed the same model:
 $${\bf y}={\bf Xb}{\plus}{\bf Wa}{\plus}{\bf Zu}{\plus}{\bf Zp}{\plus}{\bf e},$$
where y is the vector of liability for FE or SB, b the vector of fixed effects, a the vector of random direct additive genetic effects for the foal, u the vector of random maternal additive genetic effects for the mare, p the vector of random permanent environmental effects for all consecutive foalings of the mare, e the vector of residuals and Z, W are incidence matrices. The distributions of vectors a, u, p and e were assumed normal with variance matrices:
 $$V\left[ {\matrix{ {{\bf a}_{{{\rm FE}}} } \cr {{\bf u}_{{{\rm FE}}} } \cr {{\bf a}_{{{\rm SB}}} } \cr {{\bf u}_{{{\rm SB}}} } \cr } } \right]=\left[ {\matrix{ {\sigma _{{a_{{{\rm FE}}} }}^{{\rm 2}} } & {\sigma _{{a_{{{\rm FE}}} u_{{{\rm FE}}} }} } & {\sigma _{{a_{{{\rm FE}}} a_{{{\rm SB}}} }} } & {\sigma _{{a_{{{\rm FE}}} u_{{{\rm SB}}} }} } \cr {\sigma _{{a_{{{\rm FE}}} u_{{{\rm FE}}} }} } & {\sigma _{{u_{{{\rm FE}}} }}^{{\rm 2}} } & {\sigma _{{u_{{{\rm FE}}} a_{{{\rm SB}}} }} } & {\sigma _{{u_{{{\rm FE}}} u_{{{\rm SB}}} }} } \cr {\sigma _{{a_{{{\rm FE}}} a_{{{\rm SB}}} }} } & {\sigma _{{u_{{{\rm FE}}} a_{{{\rm SB}}} }} } & {\sigma _{{a_{{{\rm SB}}} }}^{2} } & {\sigma _{{a_{{{\rm SB}}} u_{{{\rm SB}}} }} } \cr {\sigma _{{a_{{{\rm FE}}} u_{{{\rm SB}}} }} } & {\sigma _{{u_{{{\rm FE}}} u_{{{\rm SB}}} }} } & {\sigma _{{a_{{{\rm SB}}} u_{{{\rm SB}}} }} } & {\sigma _{{u_{{{\rm SB}}} }}^{{\rm 2}} } \cr } } \right]\,\otimes\,{\bf A}$$
where A is the relationship matrix and
 $$\eqalign{ V\left[ {\matrix{ {{\bf p}_{{{\rm FE}}} } \cr {{\bf p}_{{{\rm SB}}} } \cr } } \right]=\left[ {\matrix{ {\sigma _{{p_{{{\rm FE}}} }}^{{\rm 2}} } & {\sigma _{{p_{{{\rm FE}}} p_{{{\rm SB}}} }} } \cr {\sigma _{{p_{{{\rm FE}}} p_{{{\rm SB}}} }} } & {\sigma _{{p_{{{\rm SB}}} }}^{{\rm 2}} } \cr } } \right]\,\otimes\,{\bf I},\, \cr V\left[ {\matrix{ {{\bf e}_{{{\rm FE}}} } \cr {{\bf e}_{{{\rm SB}}} } \cr } } \right]=\left[ {\matrix{ {\sigma _{{e_{{{\rm FE}}} }}^{2} } & {\sigma _{{e_{{{\rm FE}}} e_{{{\rm SB}}} }} } \cr {\sigma _{{e_{{{\rm FE}}} e_{{{\rm SB}}} }} } & {\sigma _{{e_{{{\rm SB}}} }}^{{\rm 2}} } \cr } } \right]\,\otimes\,{\bf I}$$
Fixed effects were: year of foaling (from 1998 to 2010), month of birth (January and February, March, May, June, July and after), region of foaling (six regions covering the traditional areas for each breed and five other large regions), sex of the foal (male, female), combined maternal age and parity (with F for first foaling, D for the second and third foaling and M for further parities; the nine levels of this effect were: 3 years F, 4 years F, 4 years D, 5 to 9 years F, 5 to 9 years D, 5 to 9 years M, 10 years and more F, 10 years and more D, 10 years and more M). In order to assure correct estimation of all effects, at least one FE score and SB score was observed for each level of each fixed effect.
For each trait, the following genetic parameters were defined (subscript omitted): the phenotypic variance was $\sigma _{y}^{{\rm 2}} =\sigma _{a}^{{\rm 2}} {\plus}\sigma _{u}^{{\rm 2}} {\plus}\sigma _{{au}} {\plus}\sigma _{p}^{{\rm 2}} {\plus}\sigma _{e}^{{\rm 2}} $
, the heritability of the direct effect was
$\sigma _{y}^{{\rm 2}} =\sigma _{a}^{{\rm 2}} {\plus}\sigma _{u}^{{\rm 2}} {\plus}\sigma _{{au}} {\plus}\sigma _{p}^{{\rm 2}} {\plus}\sigma _{e}^{{\rm 2}} $
, the heritability of the direct effect was $h_{d}^{{\rm 2}} ={{\sigma _{a}^{{\rm 2}} } \over {\sigma _{y}^{{\rm 2}} }}$
, the heritability of the maternal effect was
$h_{d}^{{\rm 2}} ={{\sigma _{a}^{{\rm 2}} } \over {\sigma _{y}^{{\rm 2}} }}$
, the heritability of the maternal effect was
 $$h_{m}^{{\rm 2}} ={{\sigma _{u}^{{\rm 2}} } \over {\sigma _{y}^{{\rm 2}} }}$$
, the genetic correlation between maternal and direct effects was
$$h_{m}^{{\rm 2}} ={{\sigma _{u}^{{\rm 2}} } \over {\sigma _{y}^{{\rm 2}} }}$$
, the genetic correlation between maternal and direct effects was
 $$r_{{au}} ={{\sigma _{{au}} } \over {\sigma _{a} \sigma _{u} }}$$
, the repeatability between two foalings of the same mare (assuming a different sire) was
$$r_{{au}} ={{\sigma _{{au}} } \over {\sigma _{a} \sigma _{u} }}$$
, the repeatability between two foalings of the same mare (assuming a different sire) was
 $$r={{\sigma _{p}^{{\rm 2}} {\plus}{1 \over 4}\sigma _{a}^{{\rm 2}} {\plus}\sigma _{u}^{{\rm 2}} {\plus}\sigma _{{au}} } \over {\sigma _{y}^{{\rm 2}} }}$$
. The following parameters were defined between traits: the genetic correlation between direct effects was
$$r={{\sigma _{p}^{{\rm 2}} {\plus}{1 \over 4}\sigma _{a}^{{\rm 2}} {\plus}\sigma _{u}^{{\rm 2}} {\plus}\sigma _{{au}} } \over {\sigma _{y}^{{\rm 2}} }}$$
. The following parameters were defined between traits: the genetic correlation between direct effects was
 $$r_{{a_{{{\rm FE},{\rm SB}}} }} ={{\sigma _{{a_{{{\rm FE}}} a_{{{\rm SB}}} }} } \over {\sigma _{{a_{{{\rm FE}}} }} \sigma _{{a_{{{\rm SB}}} }} }}$$
, the genetic correlation between maternal effects was
$$r_{{a_{{{\rm FE},{\rm SB}}} }} ={{\sigma _{{a_{{{\rm FE}}} a_{{{\rm SB}}} }} } \over {\sigma _{{a_{{{\rm FE}}} }} \sigma _{{a_{{{\rm SB}}} }} }}$$
, the genetic correlation between maternal effects was
 $$r_{{u_{{{\rm FE},{\rm SB}}} }} ={{\sigma _{{u_{{{\rm FE}}} u_{{{\rm SB}}} }} } \over {\sigma _{{u_{{{\rm FE}}} }} \sigma _{{u_{{{\rm SB}}} }} }}$$
and the phenotypic correlation between FE and SB for the same foaling was
$$r_{{u_{{{\rm FE},{\rm SB}}} }} ={{\sigma _{{u_{{{\rm FE}}} u_{{{\rm SB}}} }} } \over {\sigma _{{u_{{{\rm FE}}} }} \sigma _{{u_{{{\rm SB}}} }} }}$$
and the phenotypic correlation between FE and SB for the same foaling was
 $$r_{{{\rm FE},{\rm SB}}} ={{\sigma _{{a_{{{\rm FE}}} a_{{{\rm SB}}} }} {\plus}\sigma _{{u_{{{\rm FE}}} u_{{{\rm SB}}} }} {\plus}{1 \over 2}\left( {\sigma _{{a_{{{\rm FE}}} u_{{{\rm SB}}} }} {\plus}\sigma _{{u_{{{\rm FE}}} a_{{{\rm SB}}} }} } \right){\plus}\sigma _{{p_{{{\rm FE}}} p_{{{\rm SB}}} }} {\plus}\sigma _{{e_{{{\rm FE}}} e_{{{\rm SB}}} }} } \over {\sigma _{{y_{{{\rm FE}}} }} \sigma _{{y_{{{\rm SB}}} }} }}$$
To estimate the different parameters, an MCMC Gibbs sampling was used with TM software (Legarra et al., Reference Legarra, Varona and Lopez de Maturana2011). For each population, Gibbs sampling was carried out through a unique chain of 100 000 iterations, discarding the first 4000 iterations and retaining one every 20 samples.
Estimates for fixed and random effects were obtained for the liability variables. As the variance of each trait on this underlying scale is unidentifiable, we chose a phenotypic standard deviation of 1 and all the results in the figures are presented in this phenotypic standard deviation unit (s.d.). Knowing the estimated thresholds, an estimated probability to have the different scores for FE or SB for each combination of fixed and random effects could also be computed from the estimates of the effects and are provided in the text. When discussing of a particular level of an effect, all other effects (fixed and random) except the one mentioned are the average of estimates according to their distribution in the actual data.
Results
Estimates of environmental fixed effects
The year of foaling showed erratic variations because of the particular environmental conditions of each year but with a clear decrease over time for B (regression coefficient −0.03 s.d./year) and P (regression coefficient −0.02 s.d./year), which suggested an improvement of the environmental conditions of foaling. The estimated probabilities for ‘difficult’ or ‘with veterinarian’ births decreased, respectively, from 6.2% before 2000 to 3.1% after 2008 for B, and from 8.1% to 5.3% for P. The amplitude (maximum–minimum) of variations remained moderate for the other breeds, that is, ∼0.25 s.d. Differences were observed for SB scores between the four first years recorded (from 1998 to 2001) and following years, but without improvement from then on. The more favourable months for foaling (Figure 1) were the rare early foalings (January and February, frequency of foalings 3% (A) to 8% (B)) or late foalings (June 4% (B) to 14% (A) and July to September, 2% (B) to 7% (A)). The most unfavourable months were March to May with a maximum in April. There was no significant month effect for SB. Births of male foals were found to be more difficult with the same values for B, C and P (+0.17 s.d., +0.18 s.d., +0.16 s.d.) and +0.09 s.d. for A. This leads to an increase of the probability of difficult foalings or presence of a veterinarian of about 2 points. For SB, the unfavourable effect of males was higher for C and P (+0.20 s.d., +0.24 s.d.) than A and B (+0.14 s.d., +0.16 s.d.). Compared with female foals, the probability of SB was increased by 3 points for C and P for male foals. Foaling was not found to be easier in the traditional geographical areas for the breeds, but only little variation was observed between regions and for the most part differences were not significant (<0.20 s.d.). Lower SB scores were observed for B and C in their traditional geographical areas. The fixed effect of maternal age and parity was the most important. Estimates are plotted in Figure 2 (except for first parity in mares aged 10 or more for whom standard errors were high due to the low number of cases). Foaling difficulties were higher both at first parity compared with second or third parity, and at second and third parity compared with following parities, with a 1.4- to 3.2-fold increase of the probability to have a FE score of 2 or 3 compared with the mean population. The age effect was important at age 3 years when the combination of first parity and age resulted in the highest risk. The differences between the age categories 5–9 years and 4 years were in favour of the older mares but were not significant in most cases. No significant differences were noted between mares aged 5–9 years and 10 years or more. Interactions were observed between age and parity effects; except for breed C. Foaling was more difficult if first parity occurs at age 5–9 years than at age 4 years for A, but the opposite was observed for P. The effect of maternal age and parity showed exactly the same pattern for SB.
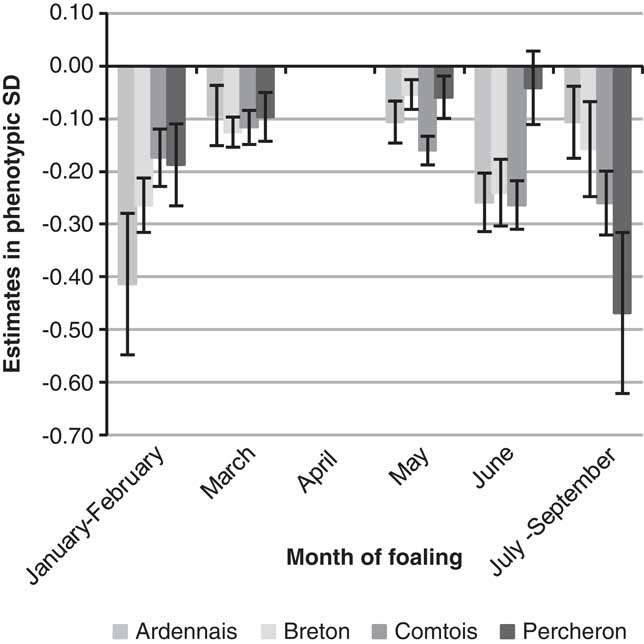
Figure 1 Effect of month of foaling on liability of foaling ease, expressed relative to April, for the four breeds.
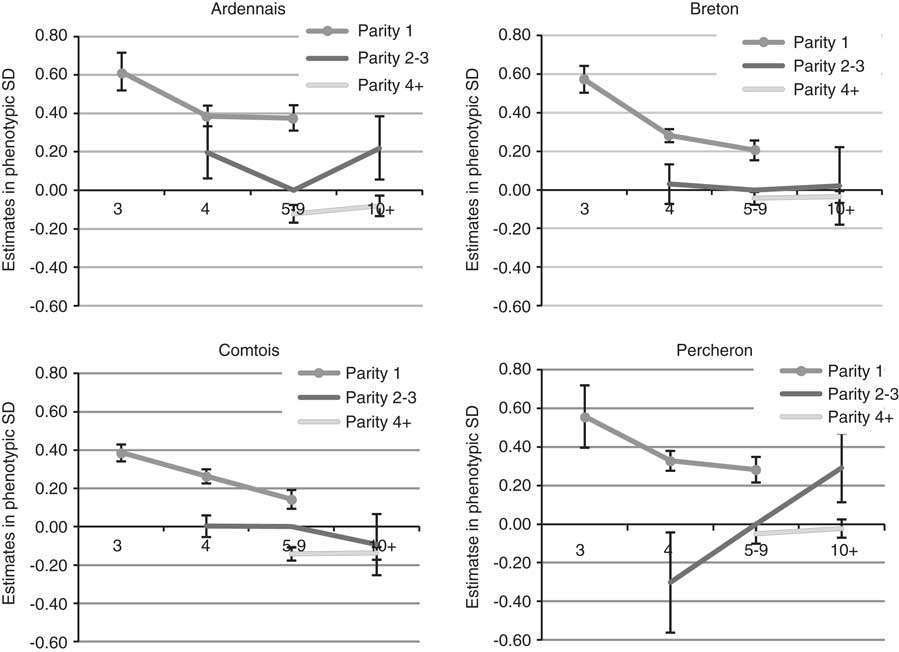
Figure 2 Effect of maternal age (in years) and parity on liability of foaling ease, expressed relative to parity 2 to 3 of mares aged 5 to 9 for the four breeds.
Genetic parameters
Table 3 provides the estimated genetic parameters as posterior means of Gibbs sampler output and their standard deviations in parenthesis. For FE, repeatability was homogeneous among breeds: from 0.26 (P) to 0.32 (A). Direct heritability ranged from 0.14 (B) to 0.27 (A) and maternal heritability ranged from 0.12 (C) to 0.25 (A). Maternal heritability was lower than direct heritability for A and C, and higher for B and P. Genetic correlations were unfavourable for three of the breeds with values ranging from −0.54 (P) to −0.29 (A), and almost neutral for C (−0.09). Additionally, in order to test the robustness of these results, single trait analysis was performed with only two classes for foaling difficulties, that is, with by pooling the ‘difficult’ and ‘with veterinarian’ categories to increase the relative proportion of occurrences for this category in the data set. In this case, differences in estimates of genetic parameters were negligible (<0.04 point) except for the genetic correlation between maternal and direct effect for C (−0.25) associated with higher direct heritability (0.27).
Table 3 Genetic parameters of foaling ease in four breeds of draft horses (s.d. in brackets)
1 Correlation between foalings of the same mare assuming different sires.
For SB, repeatability was also homogeneous among breeds: from 0.10 (C) to 0.14 (A). Direct heritability of SB ranged from 0.28 (C) to 0.52 (A) and was higher than for FE. Maternal heritability ranged from 0.07 (C) to 0.25 (A), and was both lower than maternal heritability for FE and direct heritability in all breeds. Genetic correlations were very unfavourable for all breeds and ranged from −0.63 (B) to −0.85 (A). The correlations between the two traits, FE and SB, were always positive and strong whatever the direct or maternal genetic effects especially for A and B, with a similar phenotypic correlation in all breeds of ∼0.60.
Discussion
The data included in the present study were sufficiently consistent and unselected to be used for genetic analysis. We failed to understand the causes of environmental improvement for FE for B and P with time (year effect) and change of the interpretation of scoring with time cannot be entirely excluded. In the same way, differences observed for SB in the four first years without improvement from then on, may be due to the way that observations are recorded (choice between SB and early mortality of a live foal). The estimates of environmental effects obtained here show the importance of maternal age and parity. There is always a risk at first foaling, especially if the mare is aged 3 years, so it may be preferable to wait and breed older mares. Ageing did not affect either FE or SBs as the risk was identical for mares aged 5 to 9 years and 10 years or more. The negative effect associated with ageing probably appears later on in life, for very old mares, as culling is higher from age 16 years, although it is also linked to fertility. These results are not in agreement with Allen et al. (Reference Allen, Brown, Wright and Wilsher2007) who reported a lower percentage of pregnancies in which the foal was born dead for young (3 to 8 years) and maiden thoroughbred mares, although the differences were not significant. Squires et al. (Reference Squires, Hughes, Ball, Troedsson and Stowe2013) also reported significantly lower dystocia (8.5%) for maiden mares compared with multiparous mares (14.2% for foaling mares and 12.7% for barren mares), again in thoroughbreds. Our results were comparable to those reported by Langlois et al. (Reference Langlois, Blouin and Chaffaux2012) when they analysed gestation losses (i.e. between diagnosis of gestation and birth). They observed that gestation losses were lowest in mares aged 7 to 10 years and that mares with a foal at foot had an advantage over other mares, confounding barren and maiden mares. However, their study included all gestation losses and not just SBs even though it was assumed that SBs represented most of losses (185 detailed gestations were observed in which a third of losses occurred during the 11 months).
The unfavourable effect of first parity on dystocia and SB is well established in both dairy cattle (Meyer et al., Reference Meyer, Berger and Koehler2000; Meyer et al., Reference Meyer, Berger, Thompson and Sattler2001a; Meyer et al., Reference Meyer, Berger, Koehler, Thompson and Sattler2001b; Luo et al., Reference Luo, Boettcher, Schaeffer and Dekkers2002; Steinbock et al., Reference Steinbock, Nasholm, Berglund, Johansson and Philipsson2003; Steinbock et al., Reference Steinbock, Johansson, Nasholm, Berglund and Philipsson2006; Lopez de Maturana et al., Reference Lopez de Maturana, Legarra, Varona and Ugarte2007) and beef cattle (Carnier et al., Reference Carnier, Albera, Dal Zotto, Groen, Bona and Bittante2000; Phocas and Laloe, Reference Phocas and Laloe2004). We can therefore conclude that heavy horses are closer to cattle in this respect than to warmblood horses, that is, for breeding and horse management techniques, or possible mix-up between the maternal age and parity reported.
The estimates of month effects could be used to provide helpful advice for breeders. The fact that foaling difficulties were higher during the most frequent months for foaling (compared with months when the weather conditions can be an issue as in the winter or summer) suggest that this is probably more because of the lack of time for watching over the mares during this busy period, and thus a higher FE score, than to climatic reasons. It should be noted that no month effect was observed for SB. No differences in the incidence of dystocia depending on the month of parturition were reported by Squires et al. (Reference Squires, Hughes, Ball, Troedsson and Stowe2013) and an increase of gestation losses was observed by Langlois et al. (Reference Langlois, Blouin and Chaffaux2012) for mares that were bred during month of last mating. In dairy cattle, on the contrary, winter months are the less favourable (Steinbock et al., Reference Steinbock, Nasholm, Berglund, Johansson and Philipsson2003; Eaglen and Bijma, Reference Eaglen and Bijma2009).
The aim of this study was to provide estimated breeding values (EBVs) for breeders in order to improve the populations and avoid matings that could put mare and foal at risk. Although these tools are commonly used in other species, they are still novel for horse breeders. The high heritabilities of the direct effect for SB were unexpected and suggest that this is the best trait to select on. However, because of the high negative genetic correlation between direct and maternal effects, the repeatability between foalings of the same mare remained low, and lower than for FE (mean of 0.12 for SB v. 0.28 for FE). The parameters for SB therefore seemed less reliable than those for FE. However, given the high genetic correlation between the two traits, a multiple-trait model should benefit from observations on both FE and SB. EBVs for FE are now calculated and available for breed leaders and will be soon for SB. Two values are provided for sires when reliability is >0.20: facility of foaling (maternal genetic value) and facility of birth (direct genetic value). Nevertheless, based on to the unfavourable genetic correlation between direct and maternal effects that we have evidenced in this study for A, B and P, it will be difficult to select sires that will both contribute to improving the FE of the mares mated with them and the FE of their daughters. This might not be the case for C because a negative correlation was only found for this breed when the ‘difficult’ and ‘with veterinarian’ scores were considered together and because the heritability of SB was much lower. This could be explained by the smaller size and weight of this breed and suggests that these results should not be generalised to all non-hypermetric breeds including warmbloods.
Various differences were observed between the breeds in this analysis. For FE, they are the same as those described by Langlois et al. (Reference Langlois, Blouin and Chaffaux2012) for foetal losses. However, for SB they differ from those reported previously in C and P breeds (in this study we observed that SB was higher in C than P, whereas in the previous report higher gestation losses were observed in P and Boulonnais than in C). This could be due to the differences in format and weight of the horses or to differences in breeding management. P is the heaviest and tallest breed (900 to 1000 kg, 1 m 68); the other breeds are smaller (700 to 800 kg, 1 m 58 to 1 m 60). The age at first foaling is younger for C (mean 4.2) and B (mean 4.3) than for A and P (mean 4.6). This lower age at first foaling is due to a higher number of foalings at 3 years for C (27% compared with 3% to 9% in other breeds) and 4 years for B (70% compared with 49% to 65% in other breeds). For B, foalings preferably occur at the beginning of the year (33% before April compared with 14% to 25% for the other breeds). For A, foalings preferably occur late in the year (21% after May compared with 6% to 13% in other breeds). The heaviest breed did not show the highest rate of foaling difficulties. Indeed these reached 9.0% in the most unfavourable case, that is, breed A, but only 6.7% in the heaviest breed P. This perhaps results from an adaptation in breeding practices: because the highest FE scores are observed in P and A, breeders have, over the years, chosen to use older mares for first foalings than C and B. This was highlighted in our analysis by the unfavourable interaction between age 3 and first parity compared with the effect of first parity at age 4 or 5 to 9. For the month effect, all breeds showed a similar curve for FE with a maximum of births in April. The absence of a month effect on SB is also common to all breeds even if the number of births per month varied between breeds. This reinforces the stability of our results in spite of the low occurrence of FE and SB. Only breed A, with their late foalings from June to September, has taken advantage of favourable effects.
No references could be found in the literature on genetic parameters for dystocia in horse breeding. In dairy cattle, the heritability of the direct effect for calving ease (CE) ranged from 0.01 with raw data to 0.19 with a threshold model, and the heritability of the maternal effect ranged from 0.02 with a threshold model to 0.14 with raw data (Luo et al., Reference Luo, Boettcher, Schaeffer and Dekkers2002; Steinbock et al., Reference Steinbock, Nasholm, Berglund, Johansson and Philipsson2003; Wiggans et al., Reference Wiggans, Misztal and Tassell2003; Hansen et al., Reference Hansen, Lund, Pedersen and Christensen2004; Jamrozik et al., Reference Jamrozik, Fatehi, Kistemaker and Schaeffer2005; Steinbock et al., Reference Steinbock, Johansson, Nasholm, Berglund and Philipsson2006; Lopez de Maturana et al., Reference Lopez de Maturana, Legarra, Varona and Ugarte2007, Reference Lopez de Maturana, Gianola, Rosa and Weigel2009a and Reference Lopez de Maturana, Wu, Gianola, Weigel and Rosa2009b; Eaglen and Bijma, Reference Eaglen and Bijma2009; Johanson et al., Reference Johanson, Berger, Tsuruta and Misztal2011; Eaglen et al., Reference Eaglen, Coffey, Woolliams and Wall2012). Appreciably higher estimates were obtained in beef cattle (Varona et al., Reference Varona, Misztal and Bertrand1999; Carnier et al., Reference Carnier, Albera, Dal Zotto, Groen, Bona and Bittante2000; Phocas and Laloe, Reference Phocas and Laloe2003, 2004) with direct heritability within the range 0.09 to 0.27, maternal heritability within the range 0.06 to 0.18 and genetic correlation within the range −0.19 to −0.55. The most recent references used, as in our analysis, a threshold animal model and obtained heritability in the upper range for dairy cattle: 0.11 and 0.05 to 0.14 for direct and maternal effects, respectively (Johanson et al., Reference Johanson, Berger, Tsuruta and Misztal2011; Eaglen et al., Reference Eaglen, Coffey, Woolliams and Wall2012). Typically the direct heritability estimate was twice the magnitude of the maternal heritability estimate. It is common for genetic correlations between direct and maternal effects to be negative but they are often moderate and sometimes positive (Luo et al., Reference Luo, Boettcher, Schaeffer and Dekkers2002; Hansen et al., Reference Hansen, Lund, Pedersen and Christensen2004), although the most recent studies using the threshold animal model reported more negative estimates (−0.37 to −0.67). For SBs, genetic parameters are of the same magnitude (Steinbock et al., Reference Steinbock, Nasholm, Berglund, Johansson and Philipsson2003; Hansen et al., Reference Hansen, Lund, Pedersen and Christensen2004; Jamrozik et al., Reference Jamrozik, Fatehi, Kistemaker and Schaeffer2005; Steinbock et al., Reference Steinbock, Johansson, Nasholm, Berglund and Philipsson2006; Lopez de Maturana et al., 2009b; Johanson et al., Reference Johanson, Berger, Tsuruta and Misztal2011; Eaglen et al., Reference Eaglen, Coffey, Woolliams and Wall2012) with a very low heritability (0.00 to 0.15) but always a high genetic correlation between SB and CE (0.39 to 0.83). Compared with these results, our estimates are quite high for FE and very high for SB. The trait seemed to be distributed identically in the two species. The frequency of CE is very similar, considering only difficult calvings and those with veterinarian assistance: from 3% to ∼8%, and up to 14% for first calving in the previous listed references (except for the specialised Italian Piedmontese beef cattle breed in Carnier et al., Reference Carnier, Albera, Dal Zotto, Groen, Bona and Bittante2000). The frequency of SB is also very similar from 3.1% to 13.1%. As in our study, differences between low scores (easy or easy with moderate assistance) depended on the data and were not as relevant as the threshold for difficulties. Hence, the differences of the estimates for genetic parameters do not depend on differences of incidence of the trait between horses and cattle. Nevertheless, horse breeds are not managed in the same way as cattle: the proportion of first parity in our data (20%) was low compared with that for dairy cattle (often more than 50%), the number of parities for a given animal was higher (mean 3.8 for C to 4.2 for A) and the lifespan was also longer in horses (mean age 7.9 for B to 8.5 for A). Therefore, based on differences in biology, management, maternal age and parity, the trait may well be different. This is also supported by the estimates of the fixed effect. In Hansen et al. (Reference Hansen, Lund, Pedersen and Christensen2004) and Eaglen and Bijma (Reference Eaglen and Bijma2009), the age effect showed a linear increase with time leading to a reduction of calving difficulties but without reaching, as in our study, a plateau level from age 5 to 9 on. But this could be because of the fact that these studies only included cows up to age 3 to 4 years, whereas our study included horse up to age 20 years. In horses, the choice of age at first foaling is a possibility. Only 3% to 9% of A, B and P mares foaled at age 3 years, which is the regulatory possibility and more or less the biological limit (foaling at 2 years old might be possible). The great majority of mares began their reproductive life at 4 years and there are still new mares after 6 years (B: 8% to P: 14%). This particularity meant we were able to calculate the interaction between age and parity, and comfort breeders in their choice to avoid foaling before age 3 years for less difficult births.
It is interesting to go back to the very first study that tried to distinguish between heredity, environment, maternal and direct effects on the size of foals (Walton and Hammond, Reference Walton and Hammond1938) and comment what has been learnt since then. Most studies have focused on the mechanistic effects of the mares on foaling: McCue and Ferris (Reference McCue and Ferris2012) and Ginther and Williams (Reference Ginther and Williams1996) showed that abnormal foetal postures and longer stage II labour increased mortality. Gestation length is also a well-known factor: McCue and Ferris (Reference McCue and Ferris2012) found higher SB rates for short or long gestation lengths. In a protocol similar to that of Walton and Hammond (Reference Walton and Hammond1938), Allen et al. (Reference Allen, Wilsher, Turnbull, Stewart, Ousey, Rossdale and Fowden2002) showed that foal weight is regulated by the mare by transferring a pony embryo into the uterus of a thoroughbred mare, and reciprocal transfer of thoroughbred embryos into pony mares. They analysed the placenta and proved that weight at birth is determined by the total microscopic area of foetomaternal contact, which is the product of the density of microcotyledons on the allantochorion, a function of the mare regardless the breed of foetus, and the volume of the allantochorion, which is determined by both the genetics of the mare and of the foal. Information of this kind was not available in our study and therefore we can only conclude on the mare or foal effect as a percentage of unexplained variance. The high direct heritability of FE (mean 0.19) suggests that the importance of the foal was perhaps underestimated in these previous studies. In fact, the mare provides half of the direct effect to her foal (a quarter of the variance) and the entire maternal effect with moderate negative correlation (mean −0.33). So the influence of the mares, added to the common environmental effect, reached 28% (mean of repeatability), whereas the sire effect is of only a quarter of the direct effect, that is, 5%. The influence of the mare observed here is therefore compatible with the genetic parameters obtained.
Conclusion
This study is the first to report the estimation of the genetic parameters for dystocia and SBs in horses. The ranges of heritabilities were around the upper limits of those reported for cattle in the literature, especially for SBs. On the basis of our results, breeders should be advised to avoid mating at age 3 years and to be particularly vigilant in the busy spring months when most foals are born. The EBVs produced will provide breeders with additional information on sires. It should be noted though that we will have to wait at least 5 years before being able to provide EBVs for the maternal effect in stallions. In order to partially alleviate this problem and provide genetic information on an earlier basis, we plan to obtain information on morphological traits and expect to find a correlation between one or several morphological criteria and direct or maternal effects on dystocia.
Acknowledgements
The authors would like to thank the IFCE (Institut Français du Cheval et de l’Equitation) for providing us with the data and the breeding association of Ardennais, Breton, Comtois and Percheron.


 Open access