


l-Carnitine (β-OH-γ-N-(trimethylammonio)butyrate) is a water-soluble quaternary amine that occurs naturally in micro-organisms, plants and animals( Reference Bremer 1 ). It plays an important role in lipid metabolism and energy production by chaperoning activated fatty acids (acyl coenzyme A) into the mitochondrial matrix and transporting intermediate compounds out of the matrix to prevent their accumulation( Reference Harpaz 2 ). In all animals including fish, l-carnitine can be biosynthesised from lysine( Reference Bieber 3 ). However, in fast-growing juvenile animals, endogenous carnitine synthesis is insufficient to meet the energy requirement( Reference Rebouche and Seim 4 ). Thus, dietary l-carnitine supplementation is essential. During the last two decades, many studies have been conducted to determine the effects of dietary carnitine concentrations on growth performance and lipid deposition in fish. In several studies, l-carnitine has been found to be beneficial for growth performance( Reference Santulli and D'Amelio 5 – Reference Mohseni, Ozorio and Pourkazemi 9 ) and to reduce body lipid content( Reference Santulli and D'Amelio 5 , Reference Ozorio, Uktoseja and Huisman 10 , Reference Twibell and Brown 11 ).
In general, fat accumulation results from the balance between dietary absorbed fat, de novo synthesis of fatty acids (lipogenesis) and fat catabolism via β-oxidation (lipolysis), and many key enzymes and transcription factors are involved in this process. These enzymes include lipogenic enzymes (such as 6-phosphogluconate dehydrogenase (6PGD), glucose-6-phosphate dehydrogenase (G6PD), malic enzyme (ME), isocitrate dehydrogenase (ICDH), fatty acid synthase (FAS) and acetyl-CoA carboxylase (ACC)) and lipolytic enzymes (such as carnitine palmitoyltransferase 1 (CPT1), hormone-sensitive lipase (HSL) and adipose TAG lipase (ATGL))( Reference Elliott and Elliott 12 ). Lipoprotein lipase (LPL) hydrolyses TAG present in plasma lipoproteins and supplies NEFA for storage in the adipose tissue, or for oxidation in other tissues, and plays a pivotal role in the regulation of lipid content in fish( Reference Elliott and Elliott 12 ). On the other hand, several transcription factors, such as PPARα, PPARγ and sterol regulatory element-binding protein-1 (SREBP-1), play an intermediary role in lipid homeostasis, by orchestrating the gene transcription of enzymes involved in this pathway( Reference Spiegelman and Flier 13 ). Although many studies have investigated the effects of dietary carnitine concentrations on lipid deposition in fish, the underlying molecular processes involved in the alteration of lipid deposition as a response to dietary l-carnitine are not yet known.
Yellow catfish (Pelteobagrus fulvidraco), an omnivorous freshwater fish, is considered to be a good candidate for freshwater culture in China due to its delicious meat and high market value. However, excessive lipid deposition, which may affect the quality of harvest, in yellow catfish has been reported to be a problem in some fish farms. Recently, we cloned and characterised the complementary DNA (cDNA) sequences and structures of genes involved in lipid metabolism in this fish species( Reference Zheng, Luo and Zhu 14 ), facilitating further studies to be carried out on the regulation of lipid metabolism at the molecular level. We hypothesised that dietary carnitine supplementation can improve growth performance and reduce lipid deposition in yellow catfish and tested this hypothesis in the present study. The effects of dietary l-carnitine were evaluated by determining growth performance and lipid deposition and by investigating the activities and expression of genes involved in lipid metabolism. The mRNA levels of twelve pivotal genes involved in lipid metabolism, including CPT1A, LPL, ACCa, ACCb, FAS, G6PD, 6PGD, ATGL, HSL, PPARα, PPARγ and SREBP-1, were determined by quantitative real-time PCR using a set of gene-specific primers. The activities of six enzymes involved in lipogenesis, including LPL, FAS, G6PD, 6PGD, ME and ICDH, were also determined. The liver and muscle were sampled to determine whether dietary l-carnitine supplementation affects lipid metabolism in a tissue-specific manner. To our knowledge, the present study is the first to determine the effects of dietary l-carnitine concentrations on lipid deposition and metabolism at both the enzymatic and molecular levels, and in two tissues (the liver and muscle) and gain new insights into carnitine nutrition in fish.
Materials and methods
Diet preparation
A commercial feed was used as a basal diet. The basal diet without extra carnitine supplementation was used as the control diet; two other diets were supplemented with pure l-carnitine inner salt (Sigma–Aldrich) at concentrations of 500 and 3500 mg/kg, respectively (Table 1). The highest concentration of carnitine used in the present study was similar to that used in a study on African catfish( Reference Ozorio, Uktoseja and Huisman 10 ). Carnitine concentrations in the three experimental diets used in the present study were 47 mg/kg (control), 331 mg/kg (low) and 3495 mg/kg (high) diet, respectively. The feed was produced according to the method used in our recent study( Reference Luo, Tan and Zheng 15 ). All pellets were dried at 40°C using an air blower until the moisture was reduced to < 10 %. The dried pellets were placed in plastic bags and stored at − 20°C until fed to the fish.
Table 1 Proximate analysis (percentage of DM basis) of the experimental diets
Animals and experimental procedure
Yellow catfish larvae (mean initial weight: 80 mg) were obtained from a local fish farm (Wuhan, China) and transferred into 300-litre circular fibreglass tanks for 3-week acclimatisation. During acclimatisation, fish were fed a live diet (rotifera) mixed with the control diet for 4 weeks three times daily. The amount of rotifera was greater than that of the control diet before acclimatisation, but the amount of the diet was progressively increased until the fish readily consumed the diet. At the start of the experiment, thirty-five uniformly sized fish (mean initial weight: 0·15 (se 0·02) g) in good condition were stocked in each of the fibreglass tanks. Each diet was assigned to three tanks in a completely randomised manner, resulting in nine tanks in the experiment. The diets were fed to the fish by hand to apparent satiation twice daily (09.00 and 16.00 hours). Care was taken to ensure that no uneaten feed remained in the tanks during feeding. The amount of feed consumed by the fish in each tank was recorded daily. Faecal matter was also quickly removed during the experiment. Water in each tank was replenished 100 % daily. The tanks were aerated to maintain the dissolved oxygen levels at saturation. Mortality was monitored daily. The experiment was carried out for 8 weeks.
The experiment was conducted at ambient temperature under natural photoperiod conditions (approximately 14 h light–10 h dark). Water quality parameters were monitored once daily in the morning. Water temperature, pH, and dissolved oxygen, ammonia and nitrite levels were 30·5 ± 2·5°C, 7·4 ± 0·1, 6·0 (se 0·2) mg/l, 0·17 (se 0·08) mg/l and 0·04 (se 0·01) mg/l, respectively.
Sampling and sample analysis
At the end of the experiment, 24 h after the last feeding, fish were killed (tricaine methanesulfonate at a dose of 10 mg/l). All fish were counted and weighed in batches to determine the survival rate and weight gain. Then, fish were dissected on ice to obtain livers and muscle. The livers were also weighed to calculate the hepatosomatic index. Crude lipid content in the liver and muscle was determined by diethyl ether extraction, and it is expressed as g crude lipid/100 g live weight( Reference Luo, Tan and Zheng 15 ). For histochemical observation, the left lobe of the liver (sliced into 3 mm-thick slabs) was collected, fixed in 10 % neutral buffered formalin and frozen at − 80°C. For the analysis of enzyme activities and determination of carnitine content, liver and muscle samples were quickly removed from ice using sterile forceps and immediately frozen at − 80°C. For RNA extraction, the livers and muscle of four fish from each replicate tank were dissected and immediately frozen in liquid N2. All analyses were conducted in duplicate.
Histochemical observation and total carnitine content determination
For histochemical observation, frozen livers were cut on a cryostat microtome. Sections measuring 9 μm in thickness were fixed in 4 % formaldehyde for 10 min and stained with Oil Red O and then prepared for light microscopy, according to the method of Lillie & Fullmer( Reference Lillie and Fullmer 16 ).
For the determination of total carnitine content, total carnitine was isolated according to the method of Alhomida et al. ( Reference Alhomida, Duhaiman and al-Jafari 17 ), with slight modifications proposed by Zheng et al. ( Reference Zheng, Luo and Liu 18 ). First, samples (0·5 g) were homogenised in 1 ml of ice-cold 1·2 m-HClO4 using a PowGen polytron (Fisher Scientific). After centrifugation at 8000 g for 10 min, the pellet was washed twice by suspending in 0·5 ml of 0·6 m-HClO4 and centrifuged again. Then, 0·3 ml of tissue homogenate were mixed with 0·2 ml of 5 m-KOH and heated at 80°C for 1 h. After cooling, the extract was adjusted to a pH of 7·0 with ice-cold 1·2 m-HClO4. Carnitine content was measured using the enzymatic radioisotope method( Reference Xia and Folkers 19 ).
Enzyme activity determination
For the determination of LPL activity, samples were homogenised in physiological saline on ice to obtain a 10 % (w/v) homogenate, and then the homogenate was centrifuged at 9500 g for 15 min at 4°C. The supernatant was used for the determination of LPL activity. The activity of LPL was measured using labelled triolein-3H as a substrate, according to the modified methods of Ballart et al. ( Reference Ballart, Siches and Peinado-Onsurbe 20 ), and it is expressed as U/mg of soluble protein.
For lipogenic enzyme assays, liver and muscle samples were homogenised in three volumes of ice-cold buffer (0·02 m-Tris–HCl, 0·25 m-sucrose, 2 mm-EDTA, 0·1 m-sodium fluoride, 0·5 mm-phenylmethyl sulphonyl fluoride, and 0·01 m-β-mercaptoethanol; pH 7·4) and centrifuged at 20 000 g at 4°C for 30 min. The supernatant was collected separately and immediately used for the enzyme assays. The activities of all the five lipogenic enzymes were assayed spectrophotometrically. The reaction was initiated by the addition of the tissue extract. The changes in absorbance at 340 nm were monitored at intervals of 15 s for 3 min. The activities of 6PGD and G6PD were determined using the method of Barroso et al. ( Reference Barroso, Peragon and Garcca-Salguero 21 ), the activity of ME using the method of Wise & Ball( Reference Wise and Ball 22 ), that of ICDH according to the method of Bernt & Bergmeyer( Reference Bernt, Bergmeyer and Bergmeyer 23 ), and that of FAS according to the method of Chakrabarty & Leveille( Reference Chakrabarty and Leveille 24 ). One unit of enzyme activity (IU), defined as the amount of enzyme that converts 1 μmol of substrate to product/min at 30°C, is expressed as units per mg of soluble protein. The soluble protein concentration of the homogenates was determined by the method of Bradford( Reference Bradford 25 ) using bovine serum albumin as a standard.
Quantitative RT-PCR
The extraction of total RNA and synthesis of first-strand cDNA were carried out according to the methods used in our recent study with slight modifications( Reference Zheng, Luo and Zhu 26 ). The cDNA synthesis reaction mixtures were diluted to 200 μl in water. Quantitative PCR (20 μl) was carried out in ninety-six-well plates in a Bio-Rad iCycler iQ™ real-time PCR system (MyiQ, iCycler) with GoTaq® qPCR Master (Promega), containing 10 μl of GoTaq® qPCR Master Mix, 2 μl of cDNA and 0·2 μmol/l of each primer. The primer sequences of each gene used in this analysis are given in Table 2. The thermal programme included 1 min at 95°C and forty-five cycles at 95°C for 5 s, 57°C for 10 s, and 72°C for 30 s. All reactions were carried out in duplicate, and each reaction mixture was checked to ensure that it contained a single product of the correct size by agarose gel electrophoresis. A no-template control test and a dissociation curve analysis were carried out to ensure that only one PCR product was amplified and that the stock solutions were not contaminated. Standard curves were constructed for each gene using serial dilutions of the stock cDNA to account for any differences in amplification efficiencies. A melting curve was generated for every PCR product to confirm the specificity of the assays. The relative expression of genes was calculated using the ‘ΔΔC t’ method( Reference Pfaffl 27 ). β-Actin was chosen as an internal reference for the normalisation of RT-PCR products according to the method of Zheng et al. ( Reference Zheng, Luo and Zhu 26 ).
Table 2 Primers used in real-time PCR analysis

CPT1A, carnitine palmitoyltransferase 1A; SREBP-1, sterol regulatory element-binding protein-1; G6PD, glucose-6-phosphate dehydrogenase; 6PGD, 6-phosphogluconate dehydrogenase; FAS, fatty acid synthase; ACC, acetyl-CoA carboxylase; LPL, lipoprotein lipase; ATGL, adipose TAG lipase; HSL, hormone-sensitive lipase.
Statistical analysis
Results are presented as means with their standard errors. Before statistical analysis, all data were tested for the normality of distribution using the Kolmogorov–Smirnov test. The homogeneity of variances among the different treatment groups was tested using Bartlett's test. Then, the data were subjected to one-way ANOVA and Tukey's multiple test. The analysis was carried out using SPSS 10.0 for Windows (SPSS, Inc.), and the minimum significant level was set at 0·05.
Results
Growth performance and body lipid content
During the experiment, fish were in good health and no mortality was observed (Table 3). There were no significant differences in feed intake among the treatment groups. Compared with the control group, the low-carnitine diet-fed group exhibited higher weight gain and hepatosomatic index, but a lower feed conversion ratio. However, there were no significant differences in weight gain, feed conversion ratio and hepatosomatic index between the control and the high-carnitine diet-fed groups.
Table 3 Effects of dietary carnitine concentrations on the growth performance and morphometrical parameters of juvenile Pelteobagrus fulvidraco * (Mean values of three replicates with their standard errors)
IBW, initial mean body weight; FBW, final mean body weight; WG, weight gain; FI, feed intake; FCR, feed conversion ratio; HSI, hepatosomatic index; SR, survival rate.
a,bMean values within a row with unlike superscript letters were significantly different (P< 0·05).
* Sample size for analysing IBW, FBW, WG, FI, FCR and SR: total sample size = three replicate tanks; for analysing HSI, four fish per replicate and three replicate tanks were used and total sample size = 12 fish.
† WG = (FBW − IBW)/IBW × 100 %.
‡ FCR = FI/(FBW − IBW).
§ HSI = 100 × (liver weight)/(body weight).
∥ SR = 100 × final fish number/initial fish number.
Total carnitine content in the liver and muscle was significantly higher in the two carnitine-supplemented groups than in the control group (Fig. 1). Compared with the control diet, the low-carnitine and high-carnitine diets significantly increased lipid content in the liver (Fig. 1). The high-carnitine diet also improved lipid accumulation in muscle (P< 0·05). However, there were no significant differences in muscle lipid content between the control and the low-carnitine diet-fed groups. Increased lipid accumulation in the liver as a response to dietary carnitine supplementation was further confirmed by Oil Red O staining (Fig. 2).

Fig. 1 Effects of dietary carnitine concentrations on (A) lipid content and (B) total carnitine (TC) content in the liver and muscle of juvenile yellow catfish (Pelteobagrus fulvidraco). □, Control diet; ![]() , low-carnitine diet; ■, high-carnitine diet. Values are means, with their standard errors represented by vertical bars (three replicate tanks and twelve fish were used). a,b,cMean values within a tissue with unlike letters were significantly different (P< 0·05).
, low-carnitine diet; ■, high-carnitine diet. Values are means, with their standard errors represented by vertical bars (three replicate tanks and twelve fish were used). a,b,cMean values within a tissue with unlike letters were significantly different (P< 0·05).

Fig. 2 (A) Oil Red O staining of the liver tissue sections of yellow catfish (Pelteobagrus fulvidraco) fed the control (□), low-carnitine (![]() ) and high-carnitine (■) diets. (B) Relative areas stained by Oil Red O were analysed by Image-Pro Plus 6.0 (Media Cybernetics). Values are means (n 4), with their standard errors represented by vertical bars. a,b,cMean values with unlike letters were significantly different (P< 0·05).
) and high-carnitine (■) diets. (B) Relative areas stained by Oil Red O were analysed by Image-Pro Plus 6.0 (Media Cybernetics). Values are means (n 4), with their standard errors represented by vertical bars. a,b,cMean values with unlike letters were significantly different (P< 0·05).
Gene expression involved in lipolysis
The effects of dietary l-carnitine supplementation on the mRNA levels of lipolytic genes in the liver and muscle of yellow catfish are shown in Fig. 3. Dietary l-carnitine supplementation significantly down-regulated the mRNA levels of CPT1A and PPARα in the liver. The low-carnitine diet also significantly down-regulated the expression of HSL but did not markedly affect that of ATGL mRNA. The high-carnitine diet significantly up-regulated the mRNA levels of both ATGL and HSL.

Fig. 3 Results of quantitative real-time PCR analysis carried out for genes involved in lipolysis ((A) PPARα, (B) carnitine palmitoyltransferase 1A (CPT1A), (C) hormone-sensitive lipase (HSL) and (D) adipose TAG lipase (ATGL)) in the liver and muscle of yellow catfish (Pelteobagrus fulvidraco) after dietary l-carnitine supplementation for 8 weeks. □, Control diet; ![]() , low-carnitine diet; ■, high-carnitine diet. Values are means, with their standard errors represented by vertical bars (three replicate tanks and twelve fish were used), normalised to β-actin expressed as a ratio of the control (control = 1). a,b,cMean values within a tissue with unlike letters were significantly different (P< 0·05).
, low-carnitine diet; ■, high-carnitine diet. Values are means, with their standard errors represented by vertical bars (three replicate tanks and twelve fish were used), normalised to β-actin expressed as a ratio of the control (control = 1). a,b,cMean values within a tissue with unlike letters were significantly different (P< 0·05).
Dietary l-carnitine supplementation reduced the mRNA levels of CPT1A and ATGL in muscle (Fig. 3). The expression of HSL was down-regulated by the high-carnitine diet, but it was not significantly influenced by the low-carnitine diet. Dietary l-carnitine concentrations did not markedly affect the expression of PPARα.
Gene expression involved in lipogenesis
The effects of dietary l-carnitine supplementation on the mRNA levels of LPL and lipogenic genes in the liver and muscle of yellow catfish are shown in Fig. 4. Compared with the control diet, the low-carnitine and high-carnitine diets up-regulated the mRNA levels of SREBP-1, PPARγ, FAS and ACCa. In contrast, the expression of G6PD and ACCb remained relatively constant after dietary l-carnitine supplementation. The low-carnitine diet did not significantly affect the expression of LPL and 6PGD. However, the high-carnitine diet significantly up-regulated the mRNA levels of LPL and 6PGD.

Fig. 4 Results of quantitative real-time PCR analysis carried out for (C) lipoprotein lipase (LPL) gene and genes involved in lipogenesis ((A) sterol-regulator element-binding protein-1 (SREBP-1), (B) PPARγ, (D) fatty acid synthase (FAS), (E) acetyl-CoA carboxylase a (ACCa), (F) ACCb, (G) glucose-6-phosphate dehydrogenase (G6PD) and (H) 6-phosphogluconate dehydrogenase (6GPD)) in the liver and muscle of yellow catfish (Pelteobagrus fulvidraco) after dietary l-carnitine supplementation for 8 weeks. □, Control diet; ![]() , low-carnitine diet; ■, high-carnitine diet. Values are means, with their standard errors represented by vertical bars (three replicate tanks and twelve fish were used), normalised to β-actin expressed as a ratio of the control (control = 1). a,b,cMean values within a tissue with unlike letters were significantly different (P< 0·05).
, low-carnitine diet; ■, high-carnitine diet. Values are means, with their standard errors represented by vertical bars (three replicate tanks and twelve fish were used), normalised to β-actin expressed as a ratio of the control (control = 1). a,b,cMean values within a tissue with unlike letters were significantly different (P< 0·05).
Compared with the control diet, the low-carnitine and high-carnitine diets did not significantly affect the mRNA levels of PPARγ and FAS. The low-carnitine diet did not affect the mRNA levels of SREBP-1, LPL and ACCa. In contrast, the high-carnitine diet down-regulated the mRNA levels of SREBP-1 and ACCa and up-regulated the mRNA levels of LPL. Compared with the control diet, the low-carnitine and high-carnitine diets significantly up-regulated the mRNA levels of G6PD and 6PGD.
Enzyme activity
The effects of dietary l-carnitine supplementation on the activities of LPL and lipogenic enzymes (FAS, G6PD, 6PGD, ME and ICDH) in the liver and muscle of yellow catfish are shown in Fig. 5. Dietary l-carnitine supplementation increased the activities of FAS, G6PD, 6PGD and ME in the liver. The activity of LPL was also enhanced by the low-carnitine diet, but it was not affected by the high-carnitine diet. There were no significant differences in the activity of ICDH between the control and the two carnitine-supplemented groups.

Fig. 5 Effects of dietary carnitine concentrations on the activities of enzymes ((A) fatty acid synthase (FAS), (B) lipoprotein lipase (LPL), (C) glucose-6-phosphate dehydrogenase (G6PD), (D) 6-phosphogluconate dehydrogenase (6PGD), (E) malic enzyme (ME) and (F) isocitrate dehydrogenase (ICDH)) involved in lipid metabolism in the liver and muscle of yellow catfish (Pelteobagrus fulvidraco) after dietary l-carnitine supplementation for 8 weeks. □, Control diet; ![]() , low-carnitine diet; ■, high-carnitine diet. Values are means, with their standard errors represented by vertical bars (three replicate tanks and twelve fish were used). a,b,cMean values within a tissue with unlike letters were significantly different (P< 0·05).
, low-carnitine diet; ■, high-carnitine diet. Values are means, with their standard errors represented by vertical bars (three replicate tanks and twelve fish were used). a,b,cMean values within a tissue with unlike letters were significantly different (P< 0·05).
The low-carnitine diet inhibited the activities of G6PD and ICDH in muscle, but did not significantly affect the activities of the other enzymes, such as FAS, LPL, 6PGD and ME (Fig. 5). The high-carnitine diet reduced the activities of almost all the analysed enzymes, except LPL. The activity of LPL was significantly enhanced by the high-carnitine diet.
Analysis of Pearson's correlations among several parameters
Pearson's correlations among mRNA levels, lipid content and enzyme activity in the liver and muscle of yellow catfish fed diets containing different concentrations of l-carnitine for 8 weeks are summarised in Tables 4 and 5. In the liver, lipid content was positively correlated with the mRNA levels of SREBP-1, PPARγ, FAS and ACCa and the activities of FAS, LPL, G6PD and 6PGD (Table 4). In contrast, it was negatively correlated with the expression of PPARα, CPT1A and HSL. The mRNA levels of SREBP-1 and PPARγ were positively correlated with the expression of FAS and ACCa and the activities of FAS, LPL, G6PD and 6PGD. A positive correlation was also found between the mRNA levels of SREBP-1 and PPARγ. The mRNA levels of PPARα were positively correlated with the expression of CPT1A.
Table 4 Correlations* among lipid content, mRNA levels of genes involved in lipid metabolism and activities of several enzymes in the liver of yellow catfish fed diets containing different l-carnitine concentrations for 8 weeks
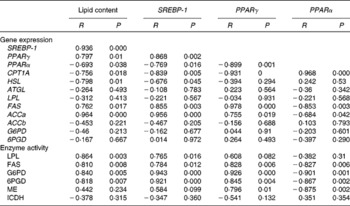
SREBP-1, sterol regulatory element-binding protein-1; CPT1A, carnitine palmitoyltransferase 1A; HSL, hormone-sensitive lipase; ATGL, adipose TAG lipase; LPL, lipoprotein lipase; FAS, fatty acid synthase; ACC, acetyl-CoA carboxylase; G6PD, glucose-6-phosphate dehydrogenase; 6PGD, 6-phosphogluconate dehydrogenase; ME, malic enzyme; ICDH, isocitrate dehydrogenase.
* Positive R and P< 0·05 indicate the positive correlation between the two variables; negative R and P< 0·05 indicate the negative correlation between the two variables, and P>0·05 indicates the absence of a significant relationship between the two variables.
Table 5 Correlations* among lipid content, mRNA levels of genes involved in lipid metabolism and activities of several enzymes in the muscle of yellow catfish fed diets containing different l-carnitine concentrations for 8 weeks

SREBP-1, sterol regulatory element-binding protein-1; CPT1A, carnitine palmitoyltransferase 1A; HSL, hormone-sensitive lipase; ATGL, adipose TAG lipase; LPL, lipoprotein lipase; FAS, fatty acid synthase; ACC, acetyl-CoA carboxylase; G6PD, glucose-6-phosphate dehydrogenase; 6PGD, 6-phosphogluconate dehydrogenase; ME, malic enzyme; ICDH, isocitrate dehydrogenase.
* Positive R and P< 0·05 indicate a positive correlation between the two variables; negative R and P< 0·05 indicate a negative correlation between the two variables, and P>0·05 indicates the absence of a significant relationship between the two variables.
In muscle, lipid content was positively related to the mRNA levels of LPL and ACCb and the activities of LPL and 6PGD and negatively related to the expression of ATGL (Table 5). Negative correlations between lipid content and SREBP-1 expression and between lipid content and G6PD and ICDH activities were also detected. The expression of SREBP-1 was positively related to the activities of G6PD and ICDH, while the expression of PPARγ was positively related to that of FAS. A positive relationship was also detected between PPARα and HSL expression.
Discussion
In the present study, a growth-promoting effect of the reasonable levels of l-carnitine supplementation was found in yellow catfish, in agreement with many other reports( Reference Santulli and D'Amelio 5 – Reference Keshavanath and Renuka 7 , Reference Twibell and Brown 11 , Reference Chatzifotis, Takeuchi and Seikai 28 , Reference Jayaprakas, Sambhu and Kumar 29 ). It was also found that high dietary carnitine concentrations (3395 mg/kg diet) did not promote growth performance. Similarly, Keshavanath & Renuka( Reference Keshavanath and Renuka 7 ) reported that 0·5 g/kg carnitine supplementation resulted in the highest growth, while higher levels of supplementation were less effective in rohu. The reduction in weight gain owing to higher concentrations of carnitine could be attributed to energy loss through the excretion of excess acylcarnitine( Reference Keshavanath and Renuka 7 ). The positive effect of l-carnitine on growth was not due to increased feed intake, indicating an improvement in feed utilisation similar to that reported in other species( Reference Torreele, Sluiszen and Verreth 6 , Reference Jayaprakas, Sambhu and Kumar 29 , Reference Yang, Liu and Liou 30 ). It should be pointed out that the amounts of dietary lysine in the present study were 3·52 %, in comparison with the optimal amount of 3·31 g/kg diet for the fish species( Reference Cao, Chen and Zhu 31 ). Thus, commercial diets are not limiting in lysine, the precursor for l-carnitine synthesis, indicating that the endogenous synthesis of l-carnitine is insufficient for rapid growth phase in yellow catfish.
In the present study, dietary l-carnitine supplementation was found to increase lipid content in the liver (both low and high l-carnitine concentrations) and muscle (high l-carnitine concentration), similar to that observed in several studies in black sea bream( Reference Ma, Xu and Shao 8 ), rainbow trout( Reference Selcuk, Tiril and Alagil 32 ) and red sea bream( Reference Chatzifotis, Takeuchi and Seikai 28 ). In contrast, other studies have suggested that diets supplemented with l-carnitine reduce lipid content in muscle( Reference Santulli and D'Amelio 5 , Reference Keshavanath and Renuka 7 , Reference Ma, Xu and Shao 8 , Reference Jayaprakas, Sambhu and Kumar 29 ) and the liver( Reference Ozorio, Uktoseja and Huisman 10 ). Ma et al. ( Reference Ma, Xu and Shao 8 ) reported that dietary l-carnitine administration reduces lipid content in muscle, but increases it in the liver. Besides differences in various experimental conditions( Reference Harpaz 2 ), the variation is probably due to both diet composition and species differences. In the present study, dietary l-carnitine supplementation was also found to elevate the accumulation of carnitine in yellow catfish, similar to many other reports( Reference Ozorio, Uktoseja and Huisman 10 , Reference Chakrabarty and Leveille 24 , Reference Yang, Liu and Liou 30 , Reference Gaylord and Gatlin 33 ), indicating that yellow catfish could effectively take up dietary l-carnitine.
Although the crucial role of carnitine in cellular metabolism is to control the influx of long-chain fatty acids into the mitochondria for β-oxidation, the underlying mechanism responsible for the effects of dietary carnitine on lipid deposition is still poorly defined in fish. In the present study, dietary carnitine supplementation was found to up-regulate the mRNA levels of most lipogenic enzymes, such as FAS, ACCa and 6PGD, and also the activities of FAS, G6PD, ME and 6PGD in the liver, which correlated well with the reported increase in lipid content in the liver. The mRNA levels of FAS and 6PGD paralleled their activities, indicating that these enzymes are mainly regulated by carnitine at the transcriptional level. The increase in LPL activity and mRNA levels might indicate an increase in the import of lipids into the liver for storage, while the reduced expression of CPT1A and HSL might indicate a decline in lipid consumption in yellow catfish fed the low-carnitine diet, which, again, correlated well with the increased lipid content in the liver in this group. However, in yellow catfish fed the high-carnitine diet, the expression of HSL and ATGL increased, perhaps indicating an increase in lipid depletion in the liver. Thus, considering the increased lipid content in the liver, we speculated that up-regulated lipogenesis in fish fed the high-carnitine diet might be sufficient to compensate for increased lipid consumption.
In the present study, the expression levels and activities of most genes involved in lipid metabolism and lipid content maintenance in muscle were found to be not affected by low concentrations of carnitine. Thus, compared with the liver, the present study demonstrated that dietary carnitine concentrations influenced lipid metabolism in a tissue-specific manner. The high-carnitine diet down-regulated the mRNA levels of several lipolytic genes (CPT1A, ATGL and HSL), in agreement with the increased lipid content in muscle. The present study also demonstrated that carnitine supplementation up-regulated the mRNA levels of 6PGD and G6PD. However, the activities of 6PGD and G6PD declined with carnitine supplementation. Similarly, enzyme activities were not found to be always accompanied by parallel changes in mRNA levels in several studies( Reference Ibanez, Peinado-Onsurbe and Sanchez 34 , Reference Zheng, Luo and Liu 35 ). Studies have indicated that gene expression is affected by mRNA stability( Reference Rigault, Le Borgne and Tazir 36 ) and also that it is time course dependent( Reference Albalat, Saera-Vila and Capilla 37 ). The increase in LPL activity and mRNA levels might indicate an increase in the import of lipids into muscle for storage. In addition, the increase in ACCb expression might, in turn, inhibit CPT1 activity through its malonyl-CoA product( Reference McGarry, Mannaerts and Foster 38 , Reference Bonnefont, Demaugre and Prip-Buus 39 ). These findings could, to some extent, explain the increase in lipid accumulation in the muscle of yellow catfish fed the high-carnitine diet. The positive relationships between lipid content and the parameters mentioned above further confirm this concept.
PPARα and PPARγ are two key transcription factors that are involved in lipid metabolism( Reference Kersten 40 , Reference Reddy and Hasimoto 41 ). PPARα plays key roles in the catabolism of fatty acids by up-regulating the expression of several key enzymes involved in fatty acid oxidation( Reference Kliewer, Sundseth and Jones 42 , Reference Ribet, Montastier and Valle 43 ), while PPARγ is critical for the regulation of lipogenesis and promotes lipid storage( Reference Kersten 40 , Reference Rosen, Sarraf and Troy 44 ). In the present study, dietary carnitine supplementation was found to down-regulate PPARα mRNA levels but to up-regulate PPARγ mRNA levels in the liver, which again correlated well with the reported increase in lipid content in the liver. Furthermore, the mRNA levels of PPARγ in the liver were positively correlated with those of FAS and ACCa and with the activities of several lipogenic enzymes (such as FAS, G6PD, 6PGD and ME) and were negatively correlated with the mRNA levels of CPT1A. The mRNA levels of PPARα were positively correlated with those of CPT1A and negatively correlated with those of FAS and ACCa and with the activities of lipogenic enzymes (such as FAS, G6PD, 6PGD and ME). All these findings support the importance of PPARα and PPARγ in the regulation of lipid metabolism, in agreement with those of the other studies( Reference Zheng, Luo and Liu 35 , Reference Thumelin, Esser and Charvy 45 , Reference Tabarin, Diz-Chaves and Carmona 46 ). Studies have also suggested that PPARα is stimulated through a PPAR response element in the first and second introns of the human and rat CPT1A genes, respectively( Reference Napal, Marrero and Haro 47 , Reference Song, Attia and Connauqhton 48 ). SREBP-1 is a membrane-bound transcription factor that regulates the gene expression of enzymes involved in fatty acid synthesis( Reference Minghetti, Leaver and Tocher 49 ). In the present study, increased mRNA levels of SREBP-1 were observed in the liver of fish fed the carnitine-supplemented diets, in agreement with the increase in lipid content in the liver. However, a negative correlation was observed between lipid content and SREBP-1 mRNA levels in muscle. The reason for this is not known; however, it might be due to the tissue-specific role of SREBP-1 in the regulation of lipid metabolism.
In conclusion, in contrast to our hypothesis, dietary carnitine supplementation was found to increase lipid content in both the liver and muscle in the present study. The increased lipid content in the liver could be attributed to the up-regulation of the mRNA levels of lipogenic genes (such as SREBP, PPARγ, FAS and ACCa) and to the increased activities of lipogenic enzymes (such as FAS, G6PD, 6PGD and ME) and to the down-regulation of the mRNA levels of the lipolytic gene CPT1A. The increased lipid content in muscle could be attributed to the down-regulation of the mRNA levels of lipolytic genes (CPT1A and ATGL) and to the increased activity of LPL. Thus, dietary carnitine influenced lipid deposition by a tissue-specific mechanism, probably through different lipid metabolic strategies occurring as a result of competitions between lipolysis and lipogenesis and between export and import of lipids from different tissues. To our knowledge, the present study is the first to explore the effect of dietary carnitine level on lipid metabolism at both the enzymatic and molecular levels, which provided new insights into carnitine nutrition in fish.
Acknowledgements
The present study was supported by the Fundamental Research Funds for the Central Universities (grant no. 2013PY073) and by the Postgraduates Innovation Research Project of Huazhong Agricultural University (grant no. 2009sc018).
J.-L. Z. and Z. L. designed the experiment. J.-L. Z., with the help of M.-Q. Z., Y. X. P., Y.-F. S., W. H. and Q.-L. C. conducted the experiment and sample analysis. J.-L. Z. and Luo Z analysed the data. J.-L. Z. drafted the manuscript and Z. L. revised the manuscript. All the authors checked and approved the manuscript. Z. L. obtained the fund from the Fundamental Research Funds for the Central Universities (grant no. 2013PY073). J.-L. Z. obtained the fund from the Postgraduates Innovation Research Project of Huazhong Agricultural University (grant no. 2009sc018).


