


1 Introduction
Irish is well known for its use of contrastive secondary palatalization and velarization. There are many pairs like bán /bˠaːnˠ/ ‘white’ vs. beann /bʲaːnˠ/ ‘peak’ which demonstrate that the contrast between palatalized and velarized consonants is phonemic in the language. This distinction pervades virtually the entire consonant system; it is found in all word positions including word-finally, and it can have grammatical significance, as in cat /kˠatˠ/ ‘cat (sg)’ vs. cait /kˠatʲ/ ‘cat (pl)’. The impressionistic realization of palatalization and velarization depends on several factors discussed in this paper. For consistency we will always transcribe both.
Though secondary palatalization contrasts are well known, our understanding of the articulatory facts behind them is limited. This is true even for better-studied languages with phonemic palatalization, such as Russian, where until recently articulatory data on a given sound was often limited to X-ray tracings of very few tokens produced by very few speakers (Fant Reference Fant1960, Bolla Reference Bolla1981; see discussion in Proctor Reference Proctor2009: 124–125). It is all the more true of Irish, for which there are only a few electropalatographic studies (Farnetani et al. Reference Farnetani, Provaglio, Chasaide, Fealy, Recasens, Fontdevila and Pallarues1991, Ní Chasaide & Fealy Reference Ní Chasaide and Fealy1991).
In this paper we present the first ultrasound study of Irish, focusing on the realization of tongue body position in the secondary palatalization and velarization contrast. Unlike electropalatography, ultrasound imaging can provide direct information about tongue body shape and movement, which is crucial to an understanding of palatalization and velarization. Our data come from a variety of Connacht Irish spoken in Connemara, in the west of Ireland. Our primary aim is to understand the role of the tongue body and root in the Irish palatalization contrast, focusing on word-initial position, and to explore how the contrast depends on place of articulation, manner (plosive vs. fricative) and vowel backness (/iː/ vs. /uː/). As we will see, our results indicate an independent role for tongue root advancement and retraction in the production of the Irish contrast. In addition, we discuss preliminary findings on the dynamics of the palatalization contrast.
Throughout this paper we illustrate our core results with tongue shape plots which estimate the characteristic tongue body position for each speaker and each consonant (palatalized or velarized), broken down by consonantal place and manner, and vowel place (see Section 3.6.1 for details). These plots are derived from several repetitions of each item for each speaker. We provide representative diagrams when needed for illustration. The rest of the tongue shape plots, and the processed raw data from which they are derived, can be found through our project website, https://irishpalatals.sites.ucsc.edu. The permanent link to the materials is http://n2t.net/ark:/b7291/d1wc74.
2 Background
2.1 Irish
Irish (or Gaeilge) has a good deal of Irish state support. Nevertheless, Irish is a minority language in Ireland and could be regarded as highly endangered. According to a recent government strategy document, ‘Irish is the main community and household language of 3% of the country's population’ (Government of Ireland 2010). This would put the number of such speakers at roughly 137,000. However, many sources estimate fewer speakers. According to the 2011 Irish census, only 1.8% of the population (roughly 72,000 speakers) reported speaking Irish daily outside of the education system (Central Statistics Office 2012). A recent report by Údarás na Gaeltachta emphasizes that the Irish language is at risk of marginalization even in traditional Irish-speaking communities (Ó Giollagáin & Charlton Reference Ó Giollagáin and Charlton2015).
On the other hand, a much larger proportion of the Irish population reports some fluency in the language. Indeed, there are many more people learning and speaking Irish as a second language than as a first language, in Ireland as well as elsewhere, and such learners may constitute the future of the language (McCloskey Reference McCloskey2001, Reference McCloskey and Conchubhar2008). Since the phonemic contrast between palatalized and velarized consonants characterizes most of the consonant inventory, it poses one of the fundamental challenges for second language learners of Irish. It should also be noted that the palatalization contrast is itself endangered and waning in the speech of younger speakers, even in Irish speaking communities, probably at least in part due to the heavy influence of English (Ó Béarra Reference Ó Béarra2007, Ó Curnáin Reference Ó Curnáin2007, Péterváry et al. Reference Péterváry, Curnáin, Giollagáin and Sheahan2014; see also Nance Reference Nance2014 on Scottish Gaelic). These observations underscore the importance of documentation of the contrast in the traditional dialects.
The shaded portions of Figure 1 show the Gaeltachtaí – areas where Irish is spoken as a community language – of the Republic of Ireland, based on census data of 2011. It is conventional to distinguish three major dialects of Irish, those of Ulster, Connacht, and Munster. Connemara is within the Connacht dialect area and lies to the west of the city of Galway. Our recordings for this dialect were made in Casla.

Figure 1 Gaeltachtaí (Irish speaking areas) of Ireland (shaded), following the 2011 Republic of Ireland census.
The consonant phoneme inventory of Connemara Irish is given in (1) (de Bhaldraithe Reference de Bhaldraithe1945, Ó Siadhail Reference Ó Siadhail1991, Ní Chiosáin & Padgett Reference Ní Chiosáin and Padgett2012, see the latter for discussion).
(1)


Palatalized and velarized consonants are marked with a superscript j and ɣ respectively. The ‘voiceless’ and ‘voiced’ stops are generally realized as voiceless-aspirated and voiceless-unaspirated respectively, though we retain the usual transcriptions. The Connemara vowel system can be roughly described as /i e a o u/, each occurring in long and short form. Irish /sʲ/ is realized as [ʃ] or [ɕ], though we represent this sound as /sʲ/ to emphasize that it patterns phonologically with the other palatalized consonants. Sounds enclosed in parentheses have highly restricted distributions.
2.2 Palatalization and velarization
2.2.1 Introduction
We use the term ‘(secondary) palatalization’ here to refer to a [j]- or [i]-like gesture accompanying a primary consonantal place gesture (International Phonetic Association 1999: 17). Non-palatalized consonants are typically velarized in Irish. Velarization might likewise be described, at least impressionistically, as a [ɰ]- or [ɯ]-like gesture accompanying the primary gesture, though we employ the conventional notation /Cˠ/. (See below for details on the articulatory realization of these sounds.) The descriptive grammatical literature on Irish is consistent with this general understanding: ‘slender’ (palatalized) consonants are described as having a secondary articulation of the tongue resembling that of a high front vowel, ‘broad’ (velarized) consonants as having one resembling a high back vowel (de Bhaldraithe Reference de Bhaldraithe1945, Breatnach Reference Breatnach1947, Mhac an Fhailigh Reference Mhac an Fhailigh1980). The Irish dialectology literature also reports some systematic phonetic variation for these secondary dorsal articulations; we return to these claims throughout the paper.
Forms illustrating the palatalization contrast are given in (2). As the contrasts in (3) show, the presence or absence of palatalization can mark morpho-syntactic distinctions.
(2)
(3)


Compared to their velarized counterparts, Irish palatalized consonants have raised second formants in CV and VC transitions (Ní Chasaide Reference Ní Chasaide1990, Ní Chiosáin & Padgett Reference Ní Chiosáin and Padgett2012). The noise following the burst of palatalized plosives is louder, longer, and higher in spectral center of gravity, particularly for coronals when compared to labials, (Ní Chiosáin & Padgett Reference Ní Chiosáin and Padgett2012). In both the articulatory and acoustic respects described above, Irish palatalized and velarized consonants resemble those of Russian. (See Kochetov Reference Kochetov2006, Ní Chiosáin & Padgett Reference Ní Chiosáin and Padgett2012 and references therein.)
Though we transcribe palatalization and velarization everywhere for consistency, it is important to understand that the impressionistic, auditory realization of both secondary articulations depends on phonetic context. In particular, velarization is not auditorily salient preceding back vowels, e.g. beo [bʲoː] ‘alive’ vs. bó [boː] (rather than [bˠoː]) ‘cow’. Analogously, palatalization is not always auditorily salient preceding front vowels, e.g. bí [biː] (rather than [bʲiː]) ‘be (imp)’ vs. [bˠiː] ‘yellow’ (Ní Chiosáin & Padgett Reference Ní Chiosáin, Padgett and Lombardi2001, Reference Ní Chiosáin and Padgett2012). The latter fact is true especially for labials. Palatalization is more auditorily salient in coronals and velars, even around front vowels, because it is often accompanied by characteristic differences in the release burst or frication noise, as mentioned above. On the other hand, velarization has been characterized as comparatively weak for the coronals, particularly the coronal stops. For example, Mhac an Fhailigh (Reference Mhac an Fhailigh1980: 24) reports that velarized /tˠ dˠ nˠ/ are produced with a centralized, [ə]-like dorsal constriction rather than the high [ɰ]- or [ɯ]-like gesture normally associated with velarized consonants.
Those nuances aside, palatalization before a back vowel, as in [bʲuː], is impressionistically obvious, as is velarization before a front vowel, as in [bˠiː]. (Readers interested in hearing the pronunciations of these and other forms can access the data through the link given in the introduction.) The effects on the second vowel formant can be seen in Figure 2, which shows formant transitions (over seven repetitions with Loess smoothing lines) for productions of [bʲuː] and [bˠiː] spoken by Speaker 1 of our study.

Figure 2 Plots of F1 and F2 trajectories, with Loess smoothing lines, for [bʲuː] (left) and [bˠiː] (right), Speaker 1.
Lastly, traditional Irish dialect descriptions leave room for doubt as to whether labial consonants are in fact produced with secondary dorsal constrictions. Many dialect descriptions do not comment on the position of the tongue body during the production of labials (e.g. Breatnach Reference Breatnach1947, de Búrca Reference de Búrca1958, Stockman Reference Stockman1974). Sommerfelt's (Reference Sommerfelt1922: 31–22) description of a Donegal (Northern) dialect does suggest that the tongue body is further back for /bˠ/ than for /bʲ/, but also claims that the dorsum is in a ‘neutral position’ for /bʲ/, rather than fronted. Furthermore, the phonological contrast between palatalized and velarized labial consonants is sometimes characterized as a contrast in lip rounding rather than tongue body position (Quiggin Reference Quiggin1906, Breatnach Reference Breatnach1947, Ó Siadhail Reference Ó Siadhail1991, Ní Chasaide Reference Ní Chasaide1995). For example, Ó Siadhail (Reference Ó Siadhail1991: 83) states that ‘slender [palatalized] labials are hardly ever phonetically palatalized’, and Breatnach (Reference Breatnach1947) writes ‘in forming the [palatalized bilabial] stop the lips are rather spread, and are kept close to the teeth’. Ó Cuív (Reference Ó Cuív1944), Mhac an Fhailigh (Reference Mhac an Fhailigh1980), and de Bhaldraithe (Reference de Bhaldraithe1945) all suggest that palatalized and velarized labials combine a distinction in lip-rounding with the same dorsal movements found at other places of articulation (at least in the south and west Gaeltacht areas). However, these claims are strictly impressionistic in nature, and as far as we know the production of labial consonants in Irish has never been investigated with instrumental methods. One goal of this paper, then, is to examine the position of the tongue body during labial consonants directly using articulatory imaging techniques.
2.2.2 Previous articulatory studies of secondary palatalization contrasts
In this section we summarize previous instrumental research on the articulation of secondary palatalization contrasts in Irish, Scottish Gaelic, and Russian. We begin with Russian, which we discuss here for two reasons. First, the Russian palatalization contrast is impressionistically very much like that of Irish, and so these articulatory studies are relevant background to the present paper. Second, we are interested in how closely the Irish and Russian palatalization contrasts resemble one another, since this may tell us something about universal constraints on such a contrast.
Skalozub (Reference Skalozub1963) presents palatograms and X-ray tracings of four Russian speakers, including juxtapositions of palatalized and non-palatalized versions of the same consonant. Skalozub's consonantal data are in the context of the vowel /a/, usually /a_a/. There is a consistent and robust difference in tongue body backness between palatalized and non-palatalized versions of a sound, judging (for example) by the highest point of the tongue body. Skalozub concludes that palatalized sounds involve an active raising and fronting of the tongue body. For non-palatalized labials, she concludes (p. 55) that there is active tongue backing, i.e. velarization; the back of the tongue is also high. (See also Kedrova et al. Reference Kedrova, Zaharov, Anisimov and Pirogov2009.) She does not suggest active tongue backing in the case of non-palatalized coronals, and the tongue body is also less high for these sounds. Non-palatalized velars have a high, back tongue body, but it is not obvious how much of this can be attributed to an active velarization gesture rather than to the primary velar constriction itself. All of these observations seem true of Matusevich & Liubimova's (Reference Matusevich and Liubimova1963) X-ray data as well.
Based on an EMMA analysis of several Russian speakers uttering nonsense words containing /p pʲ t tʲ/ in the context /a__a/, Kochetov (Reference Kochetov2002) also concludes that palatalization involves active tongue body raising and fronting. He describes non-palatalized /p/ as ‘partially velarized’, with active backing but not raising (p. 72), but non-palatalized /t/ as unspecified for any tongue body gesture. In fact, Kochetov finds that this sound is slightly fronted (but still significantly backed compared to /tʲ/); however, it should be borne in mind that this is in relation to the tongue body position for /a/.
Proctor (Reference Proctor2009) examines the tongue body properties of palatalized and non-palatalized /r l d/ in Russian, based on ultrasound data for four speakers. Proctor's data are in the context of the vowels /u a e/, using nonsense words. Proctor concludes that the tongue dorsum of non-palatalized /d/ adopts the position of the neighboring vowel and that this sound therefore has no tongue body target, similarly to Kochetov. Proctor describes the tongue body gesture of non-palatalized /r/ as ‘mid-central’ and that of /l/ as ‘mid-back’.
Although most sources on the production of the Russian contrast define palatalization and velarization in terms of tongue body position, Fant (Reference Fant1960: 171, 219–223) describes them as ‘the presence versus absence of a tendency towards a narrowing in the region of the uvula, and in the upper part of the pharynx’, and calls non-palatalized consonants ‘pharyngealized’. On the one hand, there is reason to doubt that a palatalization contrast should be identified primarily with a pharyngeal constriction. Its most robust correlate is the second formant at the consonant-vowel transition (Jakobson, Fant & Halle Reference Jakobson, Fant and Halle1952, Halle Reference Halle1959, Purcell Reference Purcell1979, Kochetov Reference Kochetov2006). The articulatory correlate of the second formant (apart from the lips) is the location of the tongue body constriction in the oral cavity (see e.g. Stevens Reference Stevens1998 on the articulatory correlates of the vowel formants). Studies of pharyngeal and uvular consonants, as well as the [ATR] contrast, find robust effects on the first formant but no consistent effect on the second formant (Alwan Reference Alwan1986, Reference Alwan1989: Ladefoged & Maddieson Reference Ladefoged and Maddieson1996; Tiede Reference Tiede1996; Borroff Reference Borroff2007: 155). In addition, any effect of palatalization on the first vowel formant might be explained at least in part as a side-effect on the pharyngeal cavity of raising and fronting the tongue (Stevens Reference Stevens1998: 263). Finally, Ladefoged & Maddieson (Reference Ladefoged and Maddieson1996: 188) note that ‘phonological palatalization is not always accompanied by a big difference in pharynx width’. On the other hand, there is a consistent effect of a palatalization contrast on the first formant (e.g. Ní Chiosáin & Padgett Reference Ní Chiosáin and Padgett2012: 172 and references there), and none of the above rules out a role for the pharyngeal cavity in a palatalization contrast. As it turns out, our analysis to come indeed finds an independent role for tongue root advancement and retraction in the palatalization contrast in Irish.
A persistent question in the literature on Russian palatalization involves the prevalence or existence of velarization compared to palatalization (see discussion in Kochetov Reference Kochetov2002: 58–59; Proctor Reference Proctor2009: 124–125). While palatalized sounds always involve tongue body raising and fronting, the tongue body realizations of non-palatalized sounds may be more variable, a possibility suggested by Kedrova et al. (Reference Kedrova, Anisimov, Zaharov and Pirogov2008). Labial consonants seem to have more robust velarization than coronals, as discussed above. In addition, velarization may depend on vowel context, and it is noteworthy that almost all of the studies cited above examine the contrast only in the context of /a/. While velarization may be weak (at least for some sounds) in that context, with the tongue body assuming something like the position of the vowel, this is clearly not the case before front vowels, where velarization of non-palatalized consonants is highly audible (Padgett Reference Padgett, Hume and Johnson2001, Reference Padgett, Brown, Cooper, Fisher, Kesici, Predolac and Zec2010), as noted earlier. Padgett (Reference Padgett, Hume and Johnson2001) and Ní Chiosáin & Padgett (Reference Ní Chiosáin and Padgett2012) argue that the opposition in Russian and Irish between palatalized and velarized consonants, as opposed to palatalized vs. plain, is a matter of contrast dispersion.
Sung et al. (Reference Sung, Archangeli, Clayton, Brenner, Johnston, Hammond and Carnie2013, Reference Sung, Archangeli, Clayton, Brenner, Johnston, Hammond and Carnie2014) present ultrasound analyses of palatalized vs. non-palatalized /p t l r/ (2013) and /p t k l n/ (2014) in Scottish Gaelic, a language closely related to Irish. They analyze four (2013) and six (2014) speakers from the Isle of Skye, presenting SSANOVA tongue shape plots (see Section 3.6.1 on these) derived from manual tracings at the tongue body gestural peak.Footnote 1 Sung et al. find a clear difference between palatalized and non-palatalized obstruents, the tongue body of the palatalized consonants being fronter and sometimes higher than that of non-palatalized ones. Though they do not discuss it, the difference in backness for /t/ seems smaller, consistent with findings for Russian. Sung et al. largely find no differences between palatalized and non-palatalized /l r n/. However, they compare phonemically palatalized /t l/ with /t l/ having morphologically derived palatalization (analogous to that seen in (3) above for Irish), the latter occurring only word-finally, and find that morphologically palatalized /l/ has a fronter tongue body for three out of four speakers, but the two kinds of /t/ are not distinct. Sung et al. find no clear difference between word-initial and word-final instances of these palatalized consonants.Footnote 2
There are no previous articulatory studies of the Irish palatalization contrast that involve direct imaging of the tongue body, the articulator thought to be most relevant to the palatalization contrast. However, using EPG, Farnetani et al. (Reference Farnetani, Provaglio, Chasaide, Fealy, Recasens, Fontdevila and Pallarues1991) examine Irish /tˠ tʲ sˠ sʲ nˠ nʲ lˠ lʲ kˠ kʲ/ produced by one speaker in the context of /i u a/. The authors note that this speaker does not actually produce the palatalization contrast for the sonorants, so only their findings regarding the obstruents are helpful for our purposes. Of these, the authors note that /sʲ kʲ/ involve tongue predorsum raising, and both show a good deal of tongue dorsum contact; /kʲ/ is described as palatal. In addition, the Farnetani et al. (Reference Farnetani, Provaglio, Chasaide, Fealy, Recasens, Fontdevila and Pallarues1991) data suggest that some Irish consonants, especially /tʲ kˠ kʲ/, resist coarticulation with neighboring vowels compared to similar consonants in Catalan or Italian, and they relate this fact to the existence of contrastive palatalization in Irish. In a separate EPG study focusing on coarticulation, Ní Chasaide & Fealy (Reference Ní Chasaide and Fealy1991) examine /bˠ bʲ dˠ dʲ ɡˠ ɡʲ/ of one speaker between long vowels and conclude that the consonants show less articulatory and acoustic coarticulation with vowels than similar consonants in French, Italian, and Swedish. (Their EPG data excluded the labials.) What little coarticulation there is is carryover (perseveratory) and is stronger at the onset of the consonant than at the offset. The authors conclude that Irish supports the hypothesis that consonants resist coarticulation more when there are more consonantal contrasts (e.g. Öhman Reference Öhman1966).
The purpose of our ultrasound study is to provide direct evidence about the behavior of the tongue body in the Irish palatalization contrast. We examine three places of articulation, including labials, which were not included in Farnetani et al.’s (Reference Farnetani, Provaglio, Chasaide, Fealy, Recasens, Fontdevila and Pallarues1991) study. Our data is based on multiple speakers producing multiple repetitions in highly controlled contexts, and unlike Sung et al. (Reference Sung, Archangeli, Clayton, Brenner, Johnston, Hammond and Carnie2013, Reference Sung, Archangeli, Clayton, Brenner, Johnston, Hammond and Carnie2014) we provide a quantitative analysis of tongue backness and height differences. Though we employ only two vowel contexts /iː uː/, these vowels represent the most extreme degrees of backness/frontness and so make good touchstones for gauging tongue body backing/fronting and the degree of coarticulation between consonants and vowels. Finally, this study is part of a larger project using ultrasound data to investigate the palatalization contrast in all three major Irish dialects, Ulster, Connacht (represented here), and Munster.
2.3 Goals of the study
A basic goal of this work is to document the tongue body and tongue root postures that realize the palatalization contrast. In addition, we posit the following specific research questions and hypotheses, motivated by the studies discussed above and by impressionistic descriptions of Irish:
(4) Hypotheses
a. Tongue Body Hypothesis: Tongue body position consistently and sufficiently distinguishes palatalized from non-palatalized consonants at all places of articulation. Palatalized consonants are fronted and possibly raised compared to velarized consonants.
b. Coronal Hypothesis: Velarization is weaker in coronals than in labials and dorsals.
c. Coarticulation Resistance Hypothesis: Tongue body position does not vary greatly with vowel context, unlike in languages with no palatalization contrast.
3 Method
3.1 Speakers
Our five speakers were all broadcasters for RTÉ Raidió na Gaeltachta (the national broadcaster's Irish medium radio station), working in the station located in Casla, Connemara, where the recordings were made (see Figure 1 above). A choice of radio broadcasters for speakers might seem unusual. However, the sociolinguistic context of Irish is one in which the native speaker base is rapidly declining, younger native speakers in the Gaeltacht are becoming more English dominant (Péterváry et al. Reference Péterváry, Curnáin, Giollagáin and Sheahan2014), and native speakers can be insecure in contexts where they feel that their Irish is being evaluated. The speakers for this study represent a relatively traditional Irish and are comfortable with sound technology and speaking while being recorded. They were two women and three men all between 35 and 60 years of age (mean = 49 years). They were all native speakers of Connemara Irish and lived in Connemara, and all of them used primarily Irish in their daily interactions. Both parents of all but one speaker were native speakers of Connemara Irish. In that one case, the speaker's mother was a native English speaker. All speakers’ primary schooling was through the medium of Irish. All but one speaker's secondary schooling was through the medium of Irish. All speakers attended third level colleges. All reported reading Irish on a daily basis. None reported any difficulties in hearing, speaking, or reading.
3.2 Materials
The materials were designed to allow us to investigate the realization of the palatalization contrast as a function of consonantal place, manner (plosive vs. fricative) and vowel context (/iː/ vs. /uː/). Speakers read a pseudorandomized list of 24 Irish words, with target consonants appearing word-initially in a CV(C) syllable. Target consonants were /pˠ (bˠ) pʲ (bʲ) fˠ fʲ tˠ tʲ sˠ sʲ kˠ kʲ xˠ xʲ/. The consonants /bʲ bˠ/ were sometimes used instead of /pʲ pˠ/ because word-initial /pʲ pˠ/ have a limited occurrence in Irish for historical reasons.Footnote 3 Each consonant appeared before both /iː/ and /uː/, which are pronounced [iː] and [uː]. The backness of short vowels is largely determined by neighboring consonants in Irish (Ó Siadhail Reference Ó Siadhail1991, Ní Chiosáin Reference Ní Chiosáin1994), though we abstract away from this fact in our transcriptions; using long [iː uː] allows us to explore the effect of vowel quality on the realization of palatalization. Words appeared in the carrier phrase Scairt Aoife _____ Dé Céadaoin [sˠkˠartʲ iːfˠə _____ dʲeː kʲeːdˠiːnʲ] ‘Aoife shouted ___ on Wednesday’. Tautosyllabic codas, if they occurred, were non-palatalized coronal consonants except in the case of /fʲiːsʲ/ ([fʲiːʃ]) ‘vision’ and /xˠiːnʲ/. The full list of words used is given in Table 1. As noted earlier, /sʲ/ is realized as [ʃ] or [ɕ].
Table 1 Word list.

Speakers read through the list 6–8 times, for a total of 144–192 productions (between 4 and 8 useable repetitions, depending on speaker and item). No two successive stimuli began with a consonant of the same major place. The number of repetitions varied because some participants became fatigued or had to end the session early for other reasons, and because some tokens were too poorly captured to analyze. Table 2 summarizes the number of repetitions captured by speaker and word.
Table 2 Repetitions captured by speaker and word (only initial CV shown). Average number of repetitions overall = 6.1; by speaker: 6.7 (s1), 8.0 (s2), 5.9 (s3), 6.0 (s4), 4.0 (s5).
3.3 Procedure
Ultrasound data was collected using a Terason T3000 ultrasound system with a model 8MC3 probe. The ultrasound machine recorded video at a frame rate of 58–60 frames per second, giving a temporal error of 8.3–8.6 ms; this corresponds to one new image roughly every 17 ms. The probe was mounted in an Articulate Instruments Ultrasound Stabilization Headset (Wrench Reference Wrench2008), which was worn by the speakers throughout the experiment. (See Scobbie, Wrench & van der Linden Reference Scobbie, Wrench, van derLinden, Sock, Fuchs and Laprie2008 for validation of this headset for probe stabilization.) Acoustic data was collected simultaneously using a Shure WH20 dynamic cardioid microphone attached to the headset, recording directly to the ultrasound system (which includes a laptop computer) at a 44.1 kHz sampling rate. We also captured lip movement using video, though lip movement data are not analyzed here. Each recording session lasted about one hour.
3.4 Articulatory to acoustic alignment
For each token we used the release of a velar stop in the carrier phrase (the /kɣ/ in ‘scairt’ /sɣkɣartʲ/) to align the ultrasound video with its corresponding audio recording. (See discussion in Miller & Finch Reference Miller and Finch2011: 476.) Specifically, using the Adobe Premiere video editing platform, the /kɣ/ release burst in the acoustic signal was aligned by hand with the first ultrasound frame after the velar closure; the latter was defined as the first frame after the onset of the closure gesture that showed either downward movement of the tongue body or ‘de-flattening’ of the tongue body as it moved away from the palate. Due to limitations of frame rate, and because the defined ultrasound frame is not guaranteed to correspond to the moment of audible release, this alignment is approximate and variable. References to consonantal ‘onset, midpoint, offset’ throughout this paper should be understood with this in mind.
3.5 Data capture
Using EdgeTrak software (Li, Kambhamettu & Stone Reference Li, Kambhamettu and Stone2005), the tongue surface shape was captured as 100 points at three time landmarks for each token: consonantal onset, offset, and the midpoint between them. Consonantal onset and offset were judged using landmarks in the waveform and spectrogram of the audio signal. These landmarks for fricatives were determined using the drop in amplitude from the preceding vowel and rise into the following vowel as determined from the waveform and higher formants; the onset and offset of aperiodic energy in the spectrogram served as a secondary criterion. Stop onsets were determined primarily by the drop in amplitude from the preceding vowel, while offsets were marked at the beginning of the stop release burst. In cases of uncertainty the choice was generally made to err in the direction of smaller consonant duration so as to minimize the possibility of including vocalic information as part of the consonant.
Since the temporal dynamics of the palatalization contrast are not the main focus of this paper, the analyses here are based primarily on one consonantal landmark, and for this purpose we chose the consonantal offset. Prior research suggests that secondary palatalization and velarization gestures peak at consonantal offset, at least for consonants in word- or syllable-initial position (e.g. Ladefoged & Maddieson Reference Ladefoged and Maddieson1996: Chapter 10; Kochetov Reference Kochetov2002, Reference Kochetov2006). Our brief discussion of dynamics in Section 4.7 may support this view, at least for palatalization.
3.6 Quantitative analysis
3.6.1 Fitting curves to tongue traces
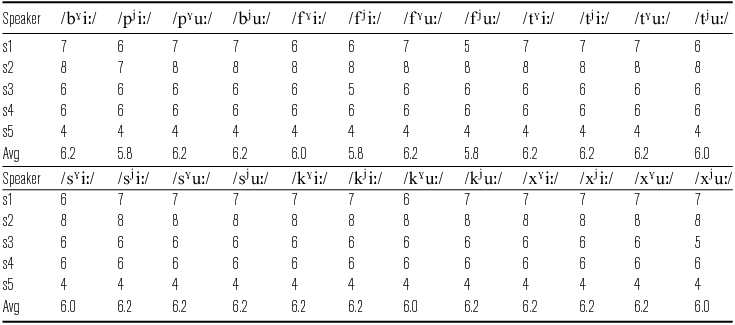
Addressing our three hypotheses in (4) above requires, first, a means of establishing characteristic tongue shapes for each kind of sound. To this end, the 4–8 tongue surface tracings acquired for each target word, for each speaker, were submitted to smoothing spline ANOVA (SSANOVA, Gu Reference Gu2002, Davidson Reference Davidson2006) to find a best-fit curve across repetitions. These best-fit curves can be interpreted as characteristic tongue shapes for a particular speaker's production of each consonant type. The final output of the SSANOVA algorithm is a curve consisting of a string of points separated by 0.01 mm on the x-axis, with associated standard errors corresponding to y-axis variability at each point. We use these standard errors to estimate 95% Bayesian confidence intervals around each curve. An example plot can be seen in Figure 3, which shows Speaker 1’s estimated tongue curves for /bʲ pˠ/ before /uː/. In our SSAVOVA figures, the front of the mouth is to the right. The dotted lines represent the 95% Bayesian confidence intervals around the tongue position. Where the confidence intervals of two lines do not overlap, we may assume that the tongue curves are significantly different. All SSANOVA curves were computed using the gss package (Gu Reference Gu2013) in the R statistical software environment (R Development Core Team 2013).
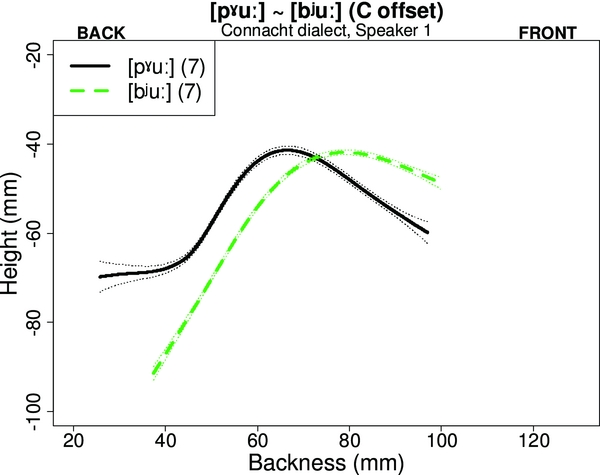
Figure 3 SSANOVA curve for palatalized (dashed) vs. velarized (solid) /bʲ pˠ/ at consonantal offset before /uː/, Speaker 1. Front of the mouth is to the right.
As is often the case in ultrasound analyses of the vocal tract, neither the tongue tip nor root is as well imaged as the tongue body. This, as well as the SSANOVA technique itself, make the extremities of the SSANOVA curves less reliable. The apparent upward curve seen in the tongue root of /pˠ/ in Figure 3, for example, and in some of our later curves does not reflect the actual, physical tongue shape in that region. This means that extremities in these curves should be interpreted with care. It is important to note as well that our principal component analysis (next section), which is the primary basis for our major findings and statistical comparisons, is done over the raw tongue tracing data, not over SSANOVA curves.
3.6.2 Principal component analysis
In order to address the Coronal Hypothesis and the Coarticulation Resistance Hypothesis in (4) above, we need a way to analyze and quantify differences in tongue body shape and position. Quantitative analysis of tongue shape variation was carried out using principal component analysis (PCA). (See Jolliffe Reference Jolliffe2002 for an overview of PCA generally, and Johnson Reference Johnson2008: 95–102 for an accessible introduction to its use in linguistics; for PCA in the analysis of tongue shapes see Harshman, Ladefoged & Goldstein Reference Harshman, Ladefoged and Goldstein1977, Slud et al. Reference Slud, Stone, Smith and Goldstein2002, Stone Reference Stone2005, and references therein.) PCA is a statistical technique used in various fields to explore clustering (structured covariation) in large data sets. PCA takes as its input a set of dimensions characterizing a data set, such as the (x, y) coordinates which specify the shape and position of the tongue contour for each ultrasound tracing in this study. PCA combines highly correlated dimensions of variation into a set of linear predictors, or principal components (PCs). These PCs are themselves weighted vectors of the original dimensions used to characterize the data set, and are mathematically guaranteed to explain disjoint (orthogonal) portions of the variance in the data. In this way PCA serves to reduce the dimensionality of a data set: most of the variance in a given data set can typically be modelled using a far smaller number of PCs than the original number of dimensions used to characterize the data. The first few PCs – those accounting for a relatively large amount of the variance – can then be interpreted as the primary dimensions of independent variation in the data.
There are several advantages to using principal component analysis for the analysis of ultrasound data. Because adjacent portions of the tongue tend to move in tandem, ultrasound tracings show a great deal of structured covariation between adjacent points on the tongue contour. PCA can effectively reduce this correlated variation to a set of parameters which correspond to more readily interpretable, and more linguistically meaningful, changes in the overall shape or position of the tongue contour. Second, PCA is unsupervised: the PCs emerge from the data itself, rather than being specified a priori by the analyst. Third, PCA operates over the entire tongue contour, and so takes advantage of the global information about the tongue surface captured by ultrasound imaging. Finally, PCA can be computed over the full set of raw tracings, and so does not require any prior smoothing or averaging of the data.
Several other methods for quantifying the data were also considered, but were found to be less reliable or less informative than PCA. Some ultrasound research uses single-point measurements taken from raw tracings or SSANOVA curves (e.g. Allen, Pulleyblank & Ajíbóyè Reference Allen, Pulleyblank and Ajíbóyè2013). A drawback of this methodology is a lack of consensus over how to choose the measurement point(s) for any particular tracing or analysis; it also fails to take advantage of the global information about the tongue surface provided by ultrasound imaging. Zharkova (Reference Zharkova2013) proposes two promising metrics for quantifying dorsal position which avoid the problems faced by single-point techniques and which have a number of other strengths. However, Zharkova (Reference Zharkova2013) notes that these measures require consistent imaging of the tongue tip and tongue root, something which can be difficult to achieve (e.g. Gick Reference Gick2002, Stone Reference Stone2005, Miller Reference Miller2016). Exploratory analysis using Zharkova's metrics confirms a wider range of token-to-token variation than PCA, most likely due to variation in tongue tip and root imaging across repetitions and speakers within the present data set.
The data set which served as the input to PCA included tongue contour tracings for all repetitions of all target consonants, taken at consonantal onset, midpoint, and offset. It also included tracings for 20 repetitions of the /a/ in scairt (one of the words in the frame sentence used in elicitation) for each speaker, taken at the midpoint of the steady-state portion of the vowel. The /a/ tracings were originally taken as a possible reference point for the analysis of consonant articulation, but ultimately play no role in the analysis. The results of the PCA are qualitatively the same when these vowel tracings are excluded from the analysis.
The PCA began by converting each tongue contour in the data set into a 200-dimensional vector. Each dimension represents the x or y value for one of the 100 points on the tongue contour. A PCA was then computed on the basis of these vectors using the prcomp() function in the R statistical software environment. As is standard practice in PCA, the input data was standardized (centered and scaled) before the PCA was computed.
3.6.3 Centering with z-score transformation
The data set resulting from PCA includes some incidental speaker-specific variation: because speakers have different vocal tract morphology, and because placement of the ultrasound transducer varies somewhat across speakers and sessions, the tongue surface tracings are not centered in the same region of the (x, y) space. To control for this incidental variation the PC values for each speaker were re-centered using a z-score transformation (using the scale() function in R) over the full data set for that speaker, that is, for every consonant and repetition, at onset, midpoint, and offset, pooled together. (See Harrington et al. Reference Harrington, Hoole, Kleber and Reubold2011, Harrington, Hoole & Reubold Reference Harrington, Hoole and Reubold2012, and Shaw et al. Reference Shaw, Chen, Proctor, Derrick, Dakhoul, Fuchs, Grice, Hermes, Lancia and Mücke2014 for other examples of z-score normalization as a technique for pooling dorsal position measurements across speakers, and see Miller Reference Miller2016 for another approach to normalization of ultrasound data.) All subsequent plotting and statistical analysis is based on these speaker-normalized z-scores.
3.6.4 Modeling
A statistical analysis of tongue shape variation was conducted through linear mixed-effects modeling (Pinheiro & Bates Reference Pinheiro and Bates2000, Gelman & Hill Reference Gelman and Hill2007, Baayen, Davison & Bates Reference Baayen, Davison and Bates2008, Bolker et al. Reference Bolker, Brooks, Clark, Geange, Poulsen, Stevens and White2009, among others). The analysis was carried out in R, using the lme4 package (Bates, Maechler & Bolker Reference Bates, Maechler and Bolker2011). The independent variables were speaker-normalized values for the first three principal components discussed in the Results section: PC1–3, which we interpret as corresponding to tongue body backness, tongue root advancement/retraction, and tongue body height respectively (see Section 4.2).
The analysis of PC1 (tongue backness) began with an initial model which included fixed effects for manner (stop, fricative), major place (labial, coronal, dorsal), secondary articulation (velarized, palatalized), and vowel context (/Ciː/, /Cuː/), as well as all two-way and three-way interactions between these terms. These factors were sum-coded to reduce collinearity between simple predictors and their interactions.
This initial model included a random intercept for speaker, along with by-speaker random slopes for all of the fixed-effect predictors (Barr et al. Reference Barr, Levy, Scheepers and Tilly2013). This model failed to converge; the random effects structure was then simplified by removing random slopes for all three-way interactions, as well as the random slope for the two-way major place × manner interaction. This reduced model successfully converged. The random slope for the major place × manner interaction was eliminated from the model because removal of random slopes for other two-way interactions did not bring the model to convergence.
The fixed effects structure of this model was then reduced through a step-down model selection procedure (see e.g. Gorman & Johnson Reference Gorman, Johnson, Bayley, Cameron and Lucas2013). Fixed-effects predictors were eliminated sequentially: among the highest-order interactions still included in the model, the predictor which accounted for the least variance in the data was selected for possible removal. Using the likelihood ratio test, a reduced model omitting that predictor was then compared to a superset model which included the predictor as a fixed effect. The significance threshold for eliminating a predictor under the likelihood ratio test was p > .1. Lower-order terms were retained until all higher-order terms containing them had been excluded.
Models for PC2 (tongue root advancement/retraction) and PC3 (tongue height) were fit using the same initial model and model selection procedure described above for PC1. This linear mixed-effects modeling procedure resulted in final models for PC1–3 which are provided in Tables A1–A3 of the appendix, along with further details about the models.
4 Results
4.1 SSANOVA curves
Figures 4–6 show Speaker 1’s estimated tongue curves for palatalized vs. velarized versions of every consonant in each vowel context, at consonant offset. We refer back to these figures in the following discussion.
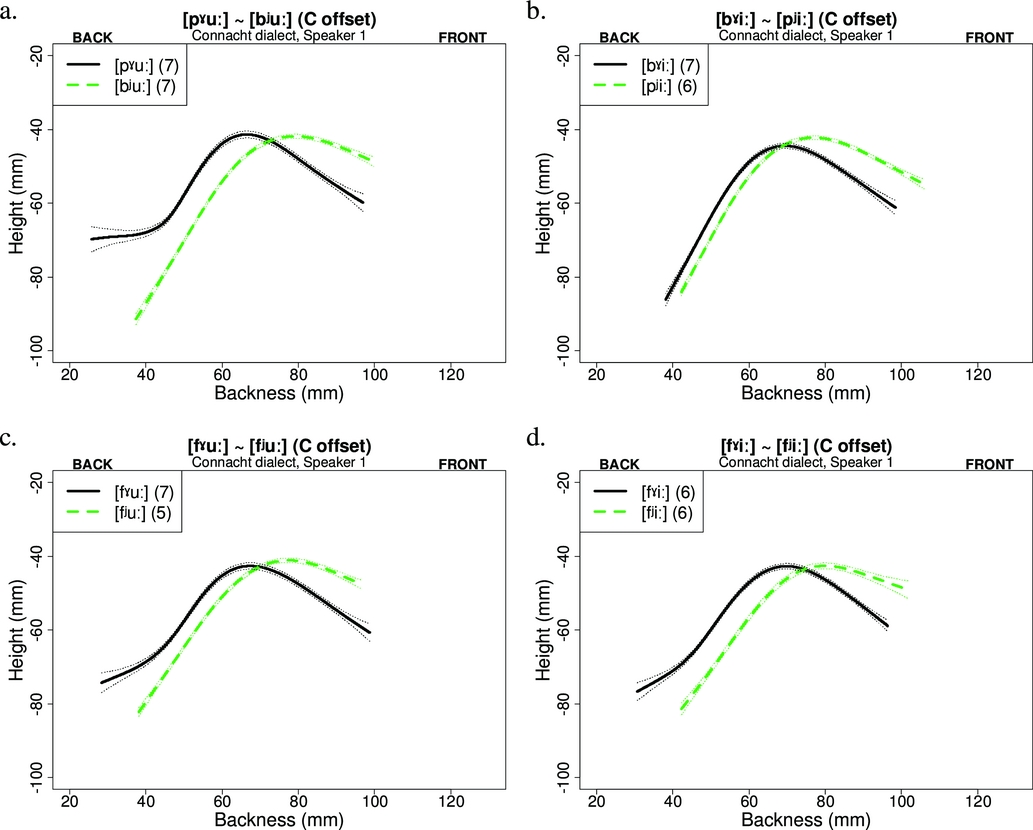
Figure 4 SSANOVA curves for palatalized (dashed) vs. velarized (solid) consonants at consonantal offset before /uː/ (left column) and /iː/ (right column), Speaker 1. Labials. Front of the mouth is to the right.
Figure 5 SSANOVA curves for palatalized (dashed) vs. velarized (solid) consonants at consonantal offset before /uː/ (left column) and /iː/ (right column), Speaker 1. Coronals. Front of the mouth is to the right.
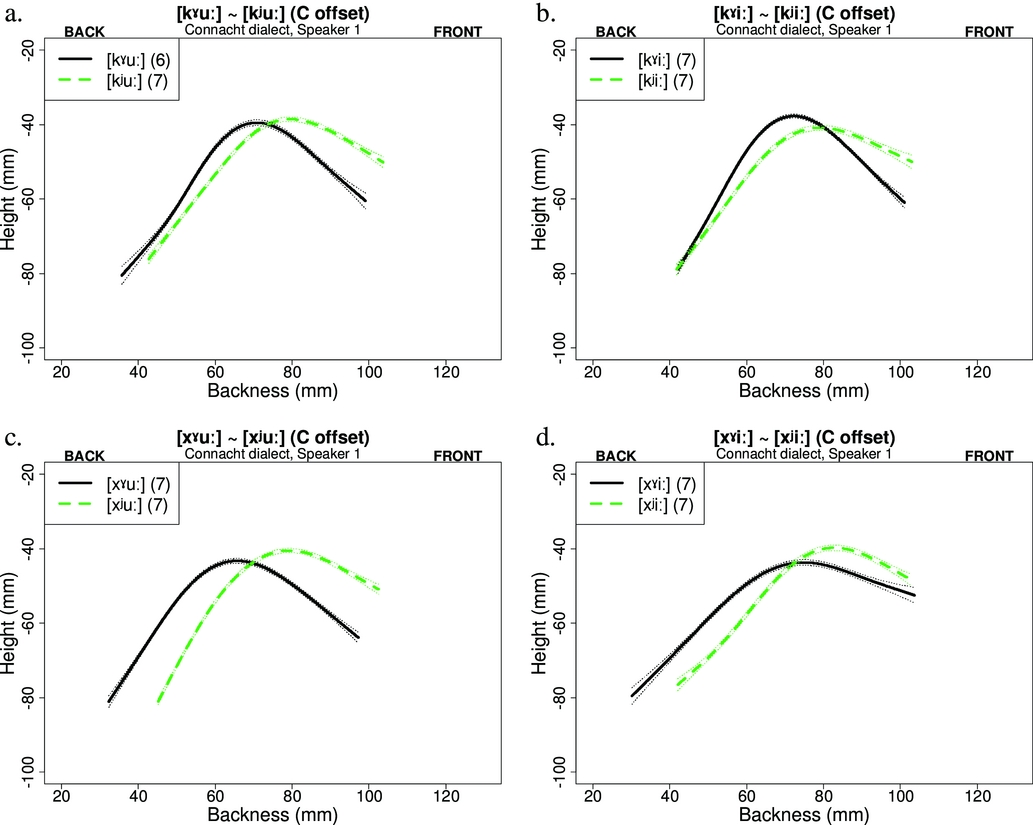
Figure 6 SSANOVA curves for palatalized (dashed) vs. velarized (solid) consonants at consonantal offset before /uː/ (left column) and /iː/ (right column), Speaker 1. Dorsals. Front of the mouth is to the right.
4.2 The principal components
The first four PCs account for 92.5% of the total variance in the data set; these PCs are plotted in Figure 7 in the original (x, y) space of the tongue surface tracings using the ggplot2 package (Wickham Reference Wickham2009). As in our SSANOVA plots, the front of the mouth is to the right.

Figure 7 Dimensions of variance for the first four principal components. Solid black lines represent grand mean of the tongue contour across all tracings for all speakers. Dashed grey lines represent changes in shape or position of the tongue contour when each PC varies independently (at ±5 standard deviations around the mean). Front of the mouth is to the right.
We interpret the first principal component (PC1), which captures 40.4% of the variance, as corresponding to changes in tongue body frontness/backness (with concomitant changes of the tongue root, discussed later). We interpret the third principal component (PC3, 14.7% of variance) as corresponding to changes in tongue body height. These two principal components map fairly cleanly to the articulatory dimensions most often referenced in descriptions of palatalization and velarization: tongue body backness and height. However, PC2, which seems to indicate an independent role for tongue root advancement/retraction, accounts for fully 30.0% of the data variance.
It is possible that PC4 represents variation in tongue blade/tip orientation. As noted earlier, however, the tongue tip was not reliably captured by our imaging and analysis. Because of this, and because it accounts for only 7.4% of the variation in the data, we do not analyze PC4.
In the following sections, which are organized according to our guiding hypotheses in 0, we rely on the linear mixed-effects models shown in Tables A1–A3 of the appendix. All pairwise comparisons reported in the text are for two-sided unpaired t-tests using the Welch approximation to degrees of freedom.
4.3 Nature and consistency of the contrast
As can be seen in Figures 4–6, the tongue body positions differ significantly for all palatalized vs. velarized consonants, in both vowel contexts, for Speaker 1. In particular, the tongue body is fronted and/or raised in palatalized compared to velarized consonants. This difference holds for every pair of palatalized vs. velarized consonants matched for place, manner, and vowel context, for all five speakers. For example, Figure 8 shows the SSANOVA curves for palatalized vs. velarized labial stops before the vowel /iː/, for all five speakers.
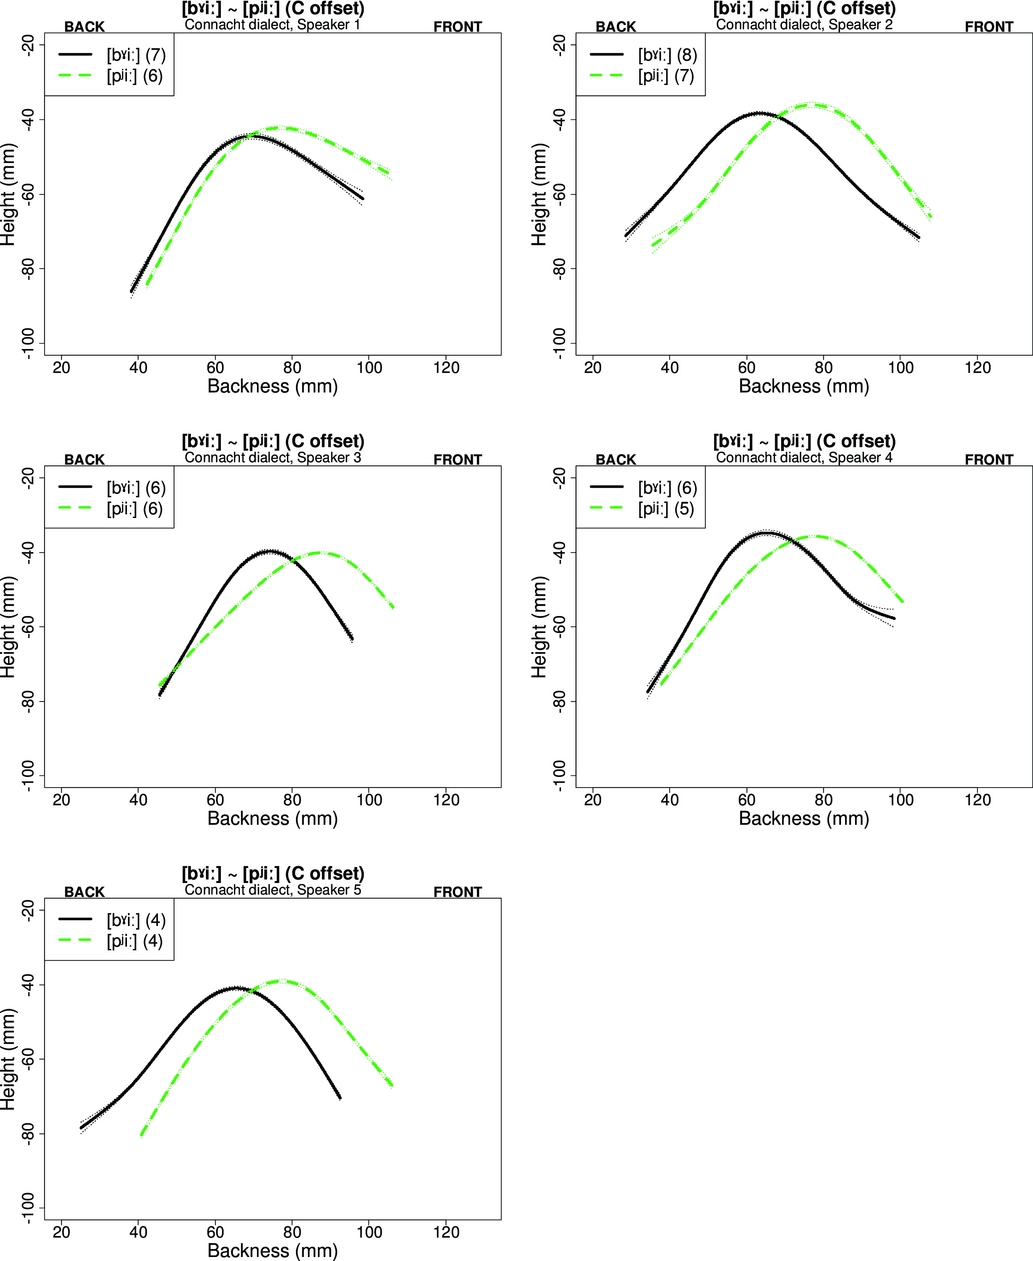
Figure 8 SSANOVA curves for palatalized (dashed) vs. velarized (solid) /pʲ bˠ/ at consonantal offset before /iː/, Speakers 1–5. Front of the mouth is to the right.
Figure 9 shows violin plots summarizing normalized PC1 values, which we identify with tongue body backness, for all speakers and consonants, collapsed over vowel context. These violin plots include overlaid box plots showing the 25%–75% interquartile range, with black diamonds and lines indicating the medians and means respectively. The separation in backness of velarized /Cˠ/s from corresponding palatalized /Cʲ/s is evident in this figure, and confirmed by a significant main effect for secondary articulation (mean PC1 for /Cj/ = 0.79, mean PC1 for /Cɣ/ = –0.50, t(696) = 21.23, p < .001). (Refer to Table A1 in the appendix for the statistical model.) This contrast holds at each individual place of articulation (labials: mean /Cj/ = 0.82, mean /Cɣ/ = –1.12, t(232) = 22.32, p < .001; coronals: mean /Cj/ = 0.89, mean /Cɣ/ = 0.14, t(228) = 8.48, p < .001; dorsals: mean /Cj/ = 0.67, mean /Cɣ/ = –0.53, t(243) = 11.08, p < .001). The exception is /sˠ/ vs. /sʲ/, which we return to below.

Figure 9 Tongue body backness (PC1) by consonant for all speakers, at consonantal offset. Higher PC1 = fronter. Overlaid are box plots showing the 25%–75% inter-quartile range. Diamonds indicate medians and lines means. The width of a violin plot at any value corresponds to the estimated likelihood of the measure (here, PC1) occurring at that value.
An analogous plot for PC3, which we identify with tongue body height, is shown below (Figure 10). There is a main effect of secondary articulation on this variable: palatalized consonants are higher than velarized consonants overall (∆omean PC3) = 0.88, t(728) = 13.12, p < .001), see Table A2 in the appendix.

Figure 10 Tongue body height (PC3) by consonant for all speakers, at consonantal offset. Higher PC3 = higher. Overlaid are box plots showing the 25%–75% inter-quartile range. Diamonds indicate medians and lines means.
Since Irish contrasts palatalized vs. velarized (rather than plain) consonants (see Section 2.2.1), we should expect that there is active displacement of the tongue body for both kinds of consonant. The positive vs. negative PC values in Figures 9 and 10 may seem to imply as much. However, these are displacements relative to a mean value, and there is no guarantee that this mean represents a neutral position in any other sense. Given this fact, how do we gauge whether a sound is velarized, or palatalized, and to what degree it is?
One way to gauge the relative status of palatalization and velarization is to compare tongue body variability in each, on the assumption that a tongue body target implies less variability (see e.g. Perkell & Cohen Reference Perkell and Cohen1989, Perkell Reference Perkell, Hardcastle and Marchal1990). There are some apparent differences in variability evident in Figure 9 and Figure 10. To explore these, we used the Brown–Forsythe test of equality of variance (which makes fewer assumptions about the underlying structure of the data than Levene's F-test does and is more robust to non-normal distributions, Brown & Forsythe Reference Brown and Forsythe1974). Doing this over the z-score normalized PC values revealed that PC1 is more variable in velarized coronals than in palatalized coronals (SD: 0.74 vs. 0.57, F = 7.63, p < . 01). This difference was true of /tˠ/ vs. /tʲ/ (SD: 0.83 vs. 0.60, F = 11.73, p < .001) and marginally true of /sˠ/ vs. /sʲ/ (SD: 0.58 vs. 0.45, F = 3.90, p = .051). These facts could imply that velarization is weaker or absent in coronals. On the other hand, /kʲ/ was marginally more variable than /kˠ/ (SD: 0.96 vs. 0.68, F = 3.82, p = .053). No other significant differences emerged for PC1 or PC3. We conclude that the relative variance of palatalized and velarized consonants is consistent with the view that /Cʲ/ and /Cˠ/ are equally specified for dorsal constriction targets in Irish. In Section 4.5 we return to articulatory differences between coronals and non-coronals in the production of the /Cʲ/ ~ /Cˠ/ contrast.
While we quantify tongue body position in our data using PC1 and PC3 values, there is no absolute criterion for labeling a consonant as categorically ‘palatalized’ or ‘velarized’ on the basis of its PC1/PC3 values. In the absence of some principled articulatory threshold for this classification, our measures of dorsal position are necessarily relative rather than absolute. But it is useful to compare consonants to each other, and as a point of reference we generally refer to the labial consonants, for two reasons. First, we can be reasonably confident that any tongue body characteristics of these consonants are in no way artifacts of the primary place of articulation, since the lips and tongue body are independent. Second, labials overall show the largest distinction in backness between palatalized and velarized consonants, as can be seen in Figure 9.
Since the role of the tongue body in labials has been a subject of question (Section 2.2.1), it is worth emphasizing that the tongue body is roughly as fronted in /pʲ bʲ/ as it is in any other palatalized consonant, and that of /pˠ bˠ/ is as far back as – mostly farther back than – that of any other velarized consonant. Furthermore, the variability of the tongue body position in these consonants is comparable to that of other consonants, a fact that suggests labials have a tongue body target just as other consonants do. The standard deviation of the tongue body position of /pʲ bʲ/ (0.62) is not significantly different from that of /tʲ/ (0.60, p = .15) and is significantly smaller than that of /kʲ/ (0.96, p < .001), according to the Brown–Forsythe test for equality of variances. Similarly, the standard deviation for /bˠ pˠ/ (0.62) is lower than that of /tˠ/ (0.83, p < .001) and not different from that of /kˠ/ (0.68, p = 0.17). The variability of the tongue body position of the labial fricatives is likewise not significantly different from that of their counterparts at other places of articulation, except that /fʲ/ (0.81) is more variable than /sʲ/ (0.45, p < .05).
Further evidence that labials involve an active specification for dorsal position comes from a comparison of labials in each vowel context. Compare first the tongue body posture of a palatalized labial stop before both /iː/ and /uː/, as shown for all speakers in Figure 11. As this figure shows, the tongue body position of /pʲ bʲ/ before [uː] is very similar to that before [iː] (if anything it is more fronted).
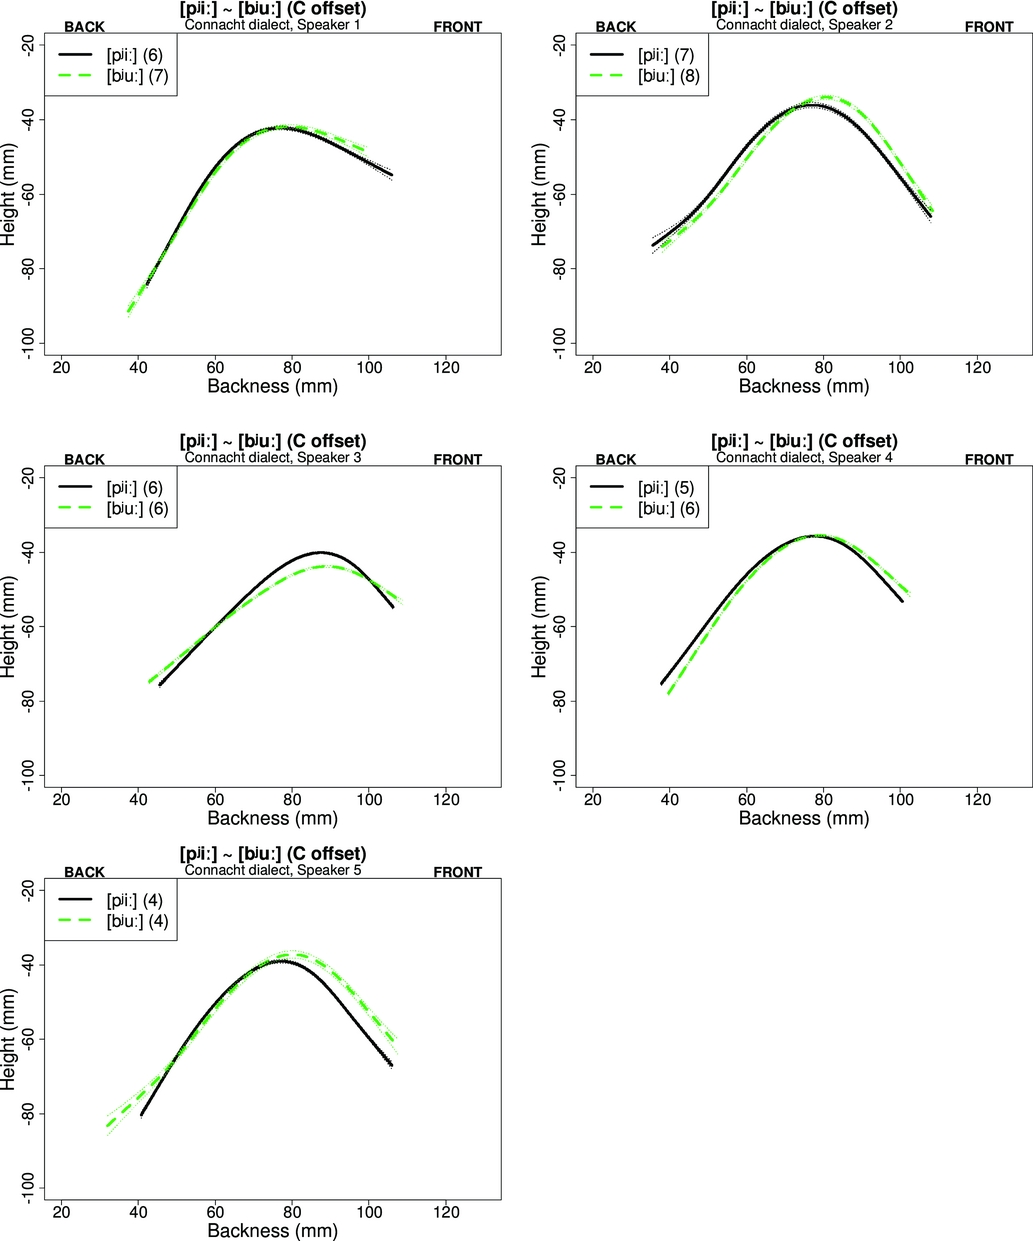
Figure 11 SSANOVA curves for palatalized /pʲ bʲ/ before /iː/ (solid) vs. /uː/ (dashed) at consonantal offset. Speakers 1–5.
In a similar way, Figure 12 shows that the tongue body position of /pˠ bˠ/ before [iː] is very similar to that before [uː].Footnote 4 (On the odd shape of the tongue root for Speaker 1’s [pˠuː] in Figure 12, see the end of Section 3.6.1.) It seems clear from this comparison that tongue body position is specified for the labial consonants themselves, rather than being determined solely by vowel context. We will informally gauge how ‘palatalized’ or ‘velarized’ other sounds are relative to these benchmarks.
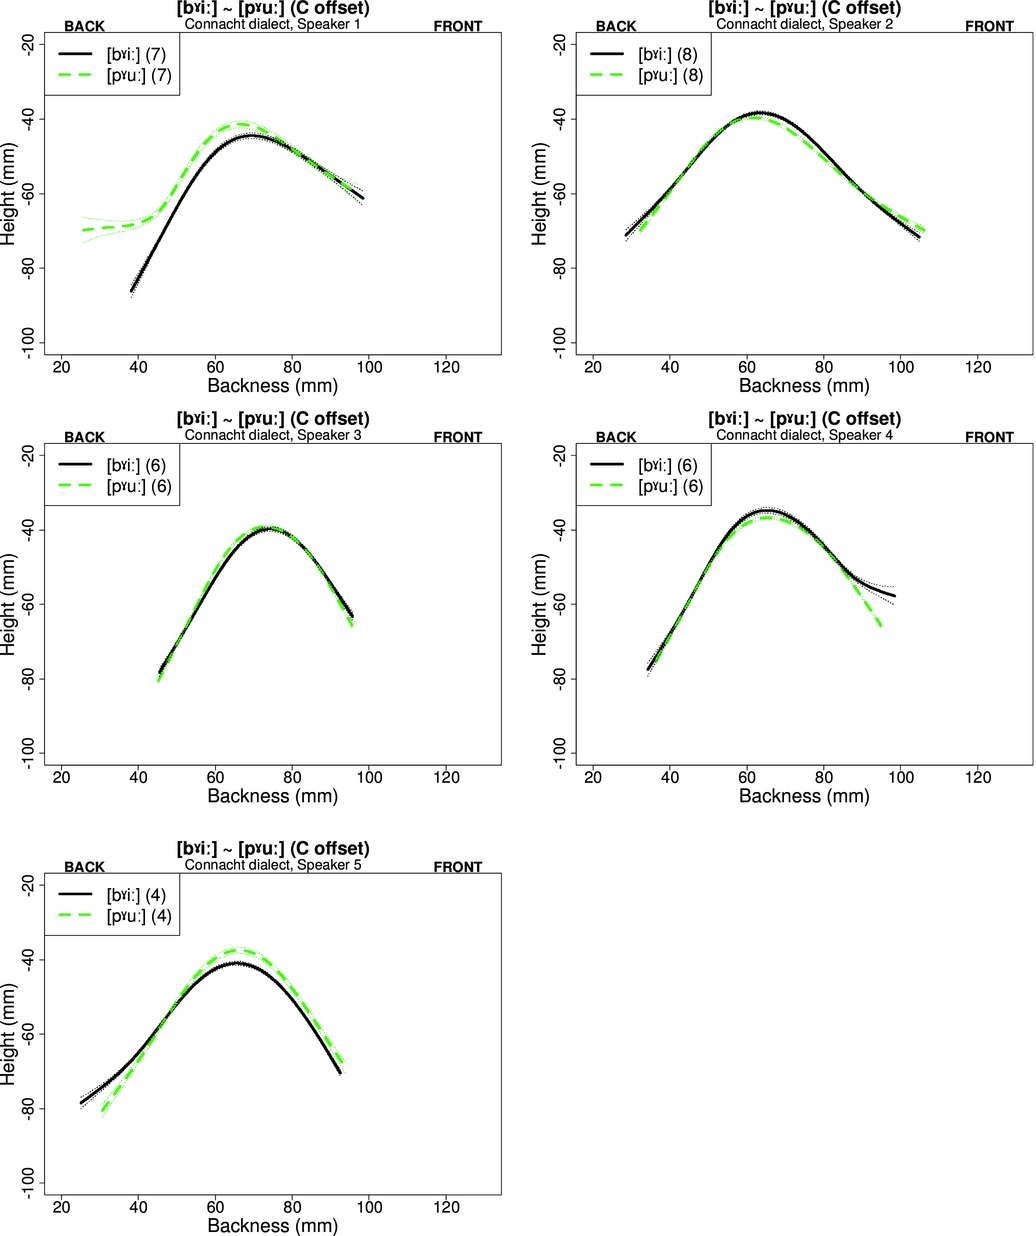
Figure 12 SSANOVA curves for velarized /pˠ bˠ/ before /iː/ (solid) vs. /uː/ (dashed) at consonantal offset. Speakers 1–5.
4.4 PC2: Tongue root advancement/retraction
We return to PC2’s dimensions of variation, shown earlier in Figure 7. The final statistical model for PC2, following the same methodology as that for the models for PC1 and PC3, is provided in Table A3 of the appendix.
The largest determinant of PC2 variation by far is the palatalized vs. velarized status of the consonant. Hence we find a main effect of secondary articulation (∆(mean PC2) = 0.94, t(708) = 13.57, p < .001). This is evident in Figure 13, where higher PC2 values correspond to deviations that lead to a wider pharyngeal cavity. Since PCA always returns a set of PCs which account for disjoint (uncorrelated) portions of the variance in the data, these results suggest that palatalization and velarization involve systematic differences of pharyngeal width which are at least partially independent of differences in dorsal position.

Figure 13 PC2 values by consonant for all speakers, at consonantal offset. Higher PC2 = more advanced tongue root. Overlaid are box plots showing the 25%–75% inter-quartile range. Diamonds indicate medians and lines means.
Apart from this effect, there are smaller significant effects reflecting the following generalizations. First, a significant main effect for major place(coronal) means that coronals overall are produced with lower PC2 values than labials (∆(mean PC2) = –0.20, t(476) = –2.21, p < .05) and with marginally lower PC2 values than dorsals (∆(mean PC2) = –0.18, t(466) = –1.90, p = .06). Second, further testing of the significant place × manner interactions reveals an effect of manner on PC2 for dorsal consonants: dorsal stops have lower PC2 values than dorsal fricatives (∆(mean PC2) = –0.31, t(243) = –2.09, p < .05). This effect of manner was not observed for coronals or labials (labials: ∆(mean PC2) = 0.07, t(234) = 0.50, p = .62; coronals: ∆(mean PC2) = 0.12, t(242) = 0.99, p = .32). Finally, the three-way place × secondary articulation × vowel context interaction indicates that among palatalized consonants, there is an effect of vowel context (Section 4.6) which differs by place of articulation, the effect reaching significance only among palatalized coronals, which have slightly higher PC2 values before /iː/ than before /uː/ (∆(mean PC2) for /Cjiː/ vs. /Cjuː/ for labials = –0.34, t(114) = –1.82, p = .07; for coronals = 0.28, t(114) = 2.21, p < .05; for dorsals = 0.16, t(111) = 0.72, p = .47).
4.5 Effects of place (and manner) on tongue body
We turn now to other effects on tongue body position. Since it would take up too much space to present the relevant SSANOVA tongue body curves for all five speakers, for the rest of the paper we present these figures only for Speaker 1. However, as earlier we substantiate our general conclusions for all of the speakers, and we note where there is significant variation behind a general finding. Readers interested in SSANOVA curves for all speakers by place, manner, vowel context, and landmark point can access the data using the links in the introduction.
The violin plots in Figure 9 above, showing tongue body backness (PC1), reveal some differences in the realization of the palatalization contrast depending on place of articulation, as well as manner. There is a significant interaction between major place(coronal) and secondary articulation, due to a smaller backness separation for coronals. This holds true for the coronal stops, but especially for the coronal fricatives, as can be seen in Figure 9. This difference is the basis of a significant three-way major place(coronal) × secondary articulation × manner interaction (∆(mean PC1) for /sj/ vs. /sɣ/ = 0.31, t(111) = 3.16, p < .005; for /tj/ vs. /tɣ/ = 1.18, t(111) = 8.74, p < .001). The relatively weak PC1 differences for/sj/ and /sɣ/ may be related to the realization of /sʲ/ as [ʃ/ɕ]; we return to this issue below. What Figure 9 also makes clear is that the small separation between palatalized and velarized coronals in backness is due to the weakness of velarization (in terms of backness), not palatalization. In fact, using the labials as a touchstone, /tˠ/ seems weakly backed and /sˠ/ not backed at all.
On the other hand, the significant three-way major place(dorsal) × secondary articulation × manner interaction is due to the fact that dorsal fricatives show greater secondary articulation differences than dorsal stops (∆(mean PC1) for /xj/ vs. /xɣ/ = 1.64, t(119) = 12.66, p < .001; for /kj/ vs. /kɣ/ = 0.74, t(116) = 4.76, p < .001). Only /xˠ/ has a tongue body posture that is as far back as that of the velarized labials.Footnote 5 Labials do not show a corresponding manner-dependent difference in the backness separation between palatalized and velarized consonants (∆(mean PC1) for /fj/ vs. /fɣ/ = 1.87, t(108) = 14.16, p < .001; for /pj bj/ vs. /pɣ bɣ/ = 2.01, t(120) = 17.99, p < .001).
Speaker 1’s SSANOVA plots in Figures 4–6 exemplify all of the generalizations above.
A significant main effect for major place(coronal) reflects the fact that PC1 values are overall significantly higher for coronals relative to other places of articulation (vs. labials: ∆(mean PC1) = 0.69, t(417) = 7.61, p < .001; vs. dorsals: ∆(mean PC1) = 0.45, t(458) = 5.41, p < .001). Labials and dorsals also differ significantly in their overall PC1 values, with the labials being somewhat retracted relative to dorsals (dorsals vs. labials: ∆(mean PC1) = 0.25, t(474) = 2.44, p < .05). This gives a place-based coronal < dorsal < labial backness scale, abstracting away from secondary articulation and vowel context. Figure 14 shows Speaker 1’s SSANOVA curves by place of articulation for each secondary articulation and vowel combination, for stops, which largely exemplify these generalizations.

Figure 14 1 SSANOVA curves for palatalized (top row) and velarized (bottom row) stops before /uː/ (left) and /iː/ (right), at consonantal offset. Speaker 1. Labial = dotted, velar = dashed, coronal = solid.
However, it should be noted that there is considerable variability in these orderings, depending on speaker, manner, secondary articulation, and vowel. For example, the order dorsal < labial does not seem to hold for fricatives (this is related to the very back position for /xˠ/ noted above). Nor does it hold for palatalized stops before /uː/ (Figure 14). Among fricatives, only the velarized ones respect coronal < dorsal.
Turning to PC3 (height), a significant main effect for major place(dorsal) is due to the fact that dorsals are produced with a higher overall tongue position than labials (∆(mean PC3) = 0.39, t(476) = 4.16, p < .001). This difference in height is to be expected given that dorsal obstruents are formed with a primary lingual constriction while labial obstruents are not. There is only a marginally significant difference in PC3 for dorsals and coronals (∆(mean PC3) = 0.17, t(477) = 1.86, p = .06. However, a comparison between labials and coronals does reveal a significant difference: coronals are also somewhat higher than labials (∆(mean PC3) = 0.22, t(485) = 2.5, p < .05). This yields a place-based dorsal, coronal > labial height scale. Speaker 1’s tongue contours in Figure 14 largely exemplify these generalizations as well, especially for coronal > labial. However, as with the backness scale, this scale masks considerable variability, some of it systematic. The order holds best for palatalized stops. Among velarized consonants, it is the coronals that seem consistently lower.
This main effect of major place on height (PC3) is accompanied by a significant interaction between major place and manner. Coronals show a relatively large effect of manner on PC3, coronal stops evincing lower PC3 values than coronal fricatives (∆(mean PC3) = –0.53, t(243) = –4.63, p < .001; this generalization does not hold for the velarized coronals of Speaker 1 or for any coronals of Speaker 5, for whom /tʲ/ is actually higher than /sʲ/). Labials show the same pattern (fricatives > stops), but with a smaller difference between group means ∆(mean PC3) = –0.30, t(234) = –2.53, p < .05; this generalization does not hold consistently of velarized consonants before /uː/, and for Speaker 5 /pʲ/ is actually higher than /fʲ/). Dorsals show the opposite pattern, dorsal stops having higher overall PC3 values than dorsal fricatives (∆(mean PC3) = 0.50, t(241) = 3.60, p < .001). However, this is only consistently true of /xˠ kˠ/ before /uː/ (and even then not for Speaker 2). Figure 15 shows tongue curves of stops vs. fricatives before /iː/ for Speaker 1, which exemplify these generalizations to some extent.

Figure 15 SSANOVA curves for stop (solid) vs. fricative (dashed) palatalized (left) and velarized (right) consonants before /iː/, at consonantal offset, Speaker 1. Top: labials; middle: coronals; bottom: dorsals.
Overall, the clearest and most consistent effects involving place and manner are with respect to PC1: there is weaker tongue body backing and a smaller PC1 separation between palatalized and velarized consonants for the coronals compared to other places of articulation, especially in the case of coronal fricatives. In addition, velar fricatives show a larger separation than velar stops, with /xˠ/ being particularly retracted.
4.6 Effects of vowel context
The violin plots in Figure 16 show PC1 (backness) values as a function of consonant, this time also broken down by vowel. There is a main effect of vowel context: PC1 values are marginally higher at consonant offset when the following vowel is /iː/ (mean PC1 for /Ciː/ = 0.22, for /Cuː/ = 0.057, t(727) = 2.14, p < .05). There is also a two-way manner × vowel context interaction: the effect of vowel context holds for fricatives overall (∆(mean PC1) for /Ciː/ vs. /Cuː/ = 0.37, t(355) = 3.48, p < .001), but not for stops (∆(mean PC1) = –0.03, t(366) = –0.30, p = .76). This can be seen in Figure 16. In fact, inspection of individual speaker curves suggests that this effect of vowel context is most consistent for velarized fricatives. Note that the effect of vowel context over all consonants is much smaller than the effect of secondary articulation (∆(mean PC1) for /Ciː/ vs. /Cuː/ = 0.17, ∆(mean PC1) for /Cj/ vs. /Cɣ/ = 1.30).

Figure 16 Tongue body backness (PC1) by consonant and vowel context for all speakers, at consonantal offset. Higher PC1 = fronter. Overlaid are box plots showing the 25%–75% inter-quartile range. Diamonds indicate medians and lines means.
There were two significant major place × secondary articulation × vowel context interactions. We attribute the place(coronal) × secondary articulation × vowel context interaction to the fact that palatalized coronals are slightly more fronted in the /Ciː/ context than palatalized labials, when compared to their respective counterparts before /Cuː/ (∆(mean PC1) for /Cjiː/ vs. /Cjuː/ for labials = 0.03, t(100) = 0.25, p = .80; for coronals = 0.23, t(108) = 2.19, p < .05). Again this seems to hold only for the fricatives, as Figure 16 and inspection of individual speaker data both suggest. The corresponding interaction for place(dorsal) is likely due to the large difference in backness between /xˠiː/ and /xˠuː/.
Figure 17 shows the effect of vowel context on height (PC3), analogous to Figure 16 for backness. There is no main effect of vowel context on PC3. The lack of such an effect is not surprising, given that /iː uː/ are both high vowels. However, a manner × vowel context interaction did reach significance, with fricatives showing a greater effect of vowel context than stops, similar to the results for PC1. Fricatives had higher overall PC3 values before /iː/ than before /uː/ (∆(mean PC3) for /Ciː/ vs. /Cuː/ for fricatives = 0.34, t(356) = 3.14, p < .001; for stops = –0.06, t(366) = –0.58, p = .56). There is also a significant interaction between secondary articulation and vowel context: PC3 variation conditioned by vowel context is greater for velarized /Cɣ/ than for palatalized /Cj/ (∆(mean PC3) for /Cɣiː/ vs. /Cɣuː/ = 0.34, t(364) = 3.70, p < .001; for /Cjiː/ vs. /Cjuː/ = –0.06, t(361) = –0.62, p = .58). However, the violin plots in Figure 17 suggest that both of these generalizations hold mainly or only for velarized fricatives. This is reflected in a significant three-way secondary articulation × manner × vowel context interaction (Table A2 of the appendix).

Figure 17 Tongue body height (PC3) by consonant and vowel context for all speakers, at consonantal offset. Higher PC3 = higher. Overlaid are box plots showing the 25%–75% inter-quartile range. Diamonds indicate medians and lines means.
Finally, a major place × manner × vowel context interaction seems largely attributable to the fact that PC3 variation by vowel context was larger for dorsal fricatives than for fricatives at other places of articulation (∆(mean PC3) for /xjiː xɣiː/ vs. /xjuː xɣuː/ = 0.61, t(111) = 3.46, p < .001; for /sjiː sɣiː/ vs. /sjuː sɣuː/ = 0.24, t(120) = 1.56, p = .12; for /fjiː fɣiː/ vs. /fjuː fɣuː/ = 0.17, t(117) = 0.96, p = .34) or for stops. This difference holds over all of the speakers.
Overall, these results indicate an effect of vowel context on the PC1 and PC3 values of consonants. However, this effect is small in comparison to the effect of secondary articulation on tongue body position, and it seems mainly true of velarized fricatives.
4.7 Consonant dynamics
A full exploration of the dynamics of palatalization and velarization is beyond the scope of this paper. However, we note some broad tendencies here based on visual inspection of PC values and SSANOVA curves at different temporal landmarks for each consonant, along with an exploratory statistical analysis.
The violin plots in Figure 18 show PC1 (tongue body backness) by consonant and consonant landmark – onset, midpoint, and offset – in the context of the vowel /uː/. Each frame shows the PC1 values for a given consonant over the three landmarks. For example, the top-left panel shows consonant backness values for /fˠuː/ at onset, midpoint, and offset. As can be seen, the tongue body of palatalized stops and /fʲ/ fronts from onset to offset, as does the distance between the means of palatalized and velarized pairs like /fˠ/ and /fʲ/ for /fʲ fˠ/ and the stops. This increasing frontness of /Cʲ/ must be due to the palatalization gesture, since the following vowel /uː/ is back. In contrast, there is very little movement throughout the velarized consonants in this /uː/ context.

Figure 18 Tongue body backness (PC1) of consonant, by consonant and temporal location (consonant onset, midpoint, offset), before the vowel /uː/. Higher PC1 = fronter. Diamonds indicate medians and lines means.
Figure 19 gives analogous data in the context of /iː/. The tongue body of palatalized consonants again fronts at least through the midpoint, though in this case it is impossible to know how much of that fronting can be attributed to the following vowel. Again we see little change in the backness of velarized consonants, though the tongue body seems to front slightly (rather than back) over time for /sˠ/ and /xˠ/, suggesting coarticulation, as seen in the previous section. This stability of the velarization gesture across landmarks even in the /iː/ context suggests that this is an inherent property of velarization. Why velarization should differ in this way from palatalization is unclear.

Figure 19 Tongue body backness (PC1) of consonant, by consonant and temporal location (consonant onset, midpoint, offset), before the vowel /iː/. Higher PC1 = fronter. Diamonds indicate medians and lines means.
The broad trends above were supported by the results of a linear mixed-effects model which included consonant landmark as a predictor of dorsal position (Table A4 of the appendix). The full model is presented in the appendix; for reasons of space we focus here on findings related to the time course of articulation. This model found a main effect of consonant landmark. In general PC1 values were higher (more fronted) at consonant midpoint than at onset (p < .01), though the difference seen between midpoint and offset was not significantly different (p = .25). A significant interaction between secondary articulation and consonant landmark (p < .001) indicates that this effect was stronger for palatalized consonants: they show more fronting between onset and midpoint than velarized consonants, as expected. We also observed a significant interaction between vowel context and consonant landmark (p < .005) which we attribute to greater fronting between consonant midpoint and offset in the context of [i:], presumably due to coarticulation. Lastly, we found a significant three-way secondary articulation × manner × consonant landmark interaction (p < .05): this interaction may be driven by the difference discussed above between /s/ and /x/ on the one hand and /f/ and the stops on the other.
The finding that palatalization peaks towards the offset is consistent with other reports in the literature (see Section 3.5), though our results indicate that the greatest movement is from onset to midpoint. The failure to find a significant difference reflecting the visible further fronting of /fʲ/ and the palatalized stops might be due to the behavior of /sʲ/ and /xʲ/, where palatalization clearly does peak by midpoint, as seen in Figure 18. It should be borne in mind that /sʲ/ in Irish is realized as [ɕ], not /sʲ/ with a secondary articulation, so we may not expect increasinɡ frontness during this segment anyway. The same may be true of /xʲ/, which is impressionistically much like [ç].
Figure 20 and Figure 21 show analogous information for PC3 (tongue body height). Patterns in this case are less obvious. Overall, tongue dorsum raising is more prevalent among palatalized than velarized consonants, particularly palatalized fricatives, though /x/ is an exception. There also seems to be more raising in the context of /i:/, again particularly for fricatives.

Figure 20 Tongue body height (PC3) of consonant, by consonant and temporal location (consonant onset, midpoint, offset), before the vowel /uː/. Higher PC3 = higher. Diamonds indicate medians and lines means.

Figure 21 Tongue body height (PC3) of consonant, by consonant and temporal location (consonant onset, midpoint, offset), before the vowel /iː/. Higher PC3 = higher. Overlaid are box plots showing the 25%–75% inter-quartile range. Diamonds indicate medians and lines means.
These trends were also broadly supported by the results of a linear mixed-effects model which took PC3 as the dependent measure (Table A5 of the appendix). Unlike our model for PC1 dynamics, there was no main effect of consonant landmark (onset vs. midpoint, p < 1; midpoint vs. offset, p < .79). However, there was a significant interaction between consonant landmark and secondary articulation: palatalized consonants are more raised at midpoint than at onset (p < .005). There was also a marginally significant difference in raising between midpoint and offset for palatalized consonants (p < .07). This weak effect may be stronger for fricatives, as indicated by a marginally significant three-way interaction between secondary articulation, manner, and consonant landmark for midpoint-offset comparisons (p < .09). This is consistent with our finding of a significant manner × consonant landmark interaction, which suggests that fricatives in general have greater dorsum raising at consonantal offset than at midpoint (p < .001). Finally, a significant vowel context × consonant landmark interaction indicates greater dorsal raising at offset than midpoint for consonants preceding /iː/ (p < .05).
A limit on the conclusions in this section is that landmarks like ‘onset’ are approximate and somewhat variable, given the limitations of frame rate (one image roughly every 17 ms) and the inherently imprecise nature of articulatory to acoustic alignment (see Section 3.4). We aligned audio to ultrasound video stills by defining ‘offset’ in terms of alignment of the audible burst of a reference /kˠ/ to the first ultrasound frame showing evidence of movement of the constriction away from the palate. It is possible, for example, that this ultrasound frame is closer on average to the midpoint of occlusion, say, than to the end.
5 Discussion
Our goal was to test the following hypotheses (repeated from (4) above):
(5) Hypotheses
a. Tongue Body Hypothesis: Tongue body position consistently and sufficiently distinguishes palatalized from non-palatalized consonants at all places of articulation. Palatalized consonants are fronted and possibly raised compared to velarized consonants.
b. Coronal Hypothesis: Velarization is weaker in coronals than in labials and dorsals.
c. Coarticulation Resistance Hypothesis: Tongue body position does not vary greatly with vowel context, unlike in languages with no palatalization contrast.
Our ultrasound results show, first, that tongue body position indeed very reliably distinguishes palatalized from non-palatalized consonants, at least for the range of consonants and contexts explored here. For every pair of consonants differing only in secondary articulation (e.g. /tˠ/ vs. /tʲ/), for every speaker, the SSANOVA curves are wholly or largely distinct in the dorsal region. Overall, the tongue body is fronter and higher for palatalized than for velarized consonants, just as it is in Russian and Scottish Gaelic (Section 2.2.2). The tongue body backness differences are smaller overall for the coronals (especially /sj sˠ/).
As noted in Section 2.2.2, palatalization has been associated by Fant (Reference Fant1960) with a wider pharyngeal cavity (or absence of a pharyngeal constriction). We offered reasons in that section to doubt that pharyngeal cavity width is the primary articulatory correlate of a palatalization contrast. For example, an increased pharyngeal width in palatalized consonants might simply be a side-effect of tongue body fronting. Our data do seem to support this last claim (see, for example, PC1 in Figure 7 and the SSANOVA curves in Figures 4–6). Tongue body backness might be considered ‘primary’ to the Irish palatalization contrast, at least judging by the relative contribution of PC1 compared to PC2 and PC3 in accounting for variance. However, PC2 accounts for fully 30% of the variance in our data. This is an interesting result, indicating a substantial and independent role for tongue root advancement and retraction in the contrast. In other words, our results suggest that the Irish palatalization contrast involves both tongue body and tongue root targets. In this respect our Tongue Body Hypothesis is only partially supported: dorsal position does not appear to be the only lingual correlate of secondary palatalization and velarization. The relationship between this articulatory aspect of Irish palatalization and the acoustic-perceptual properties of those consonants is a topic worth further exploring.
Turning to effects of place (and it turns out, manner), the height difference between /kˠ/ and /kʲ/ is minimal in comparison to the backness difference between these sounds. This is not surprising, since velar and palatal closures by their nature require a high tongue body. However, the situation with /xˠ/ vs. /xʲ/ is different. The sound /xˠ/ is both a good deal further back and lower than /xʲ/, and indeed than its stop counterpart /kˠ/. It has been claimed that some Connemara speakers optionally pronounce /xˠ/ as uvular [χ] (Ó Curnáin Reference Ó Curnáin2007: 171). Our tongue body results for /xˠ/ might support such a uvular realization. (See Geng Reference Geng2007 and references therein for a similar finding for the German dorsal fricative.) In that case, ‘velarization’ would be more precisely uvularization. Since the tongue body is roughly just as backed and low for velarized labials as for /xˠ/, this might likewise imply that ‘velarization’ is uvularization more generally in Irish. This is indeed consistent with velarization having both tongue body and tongue root components.
Turning to the coronals, for /sˠ/ vs. /sʲ/ it is the backness difference that is minimal overall (but this is not true for all speakers); there is a consistent difference in height. In terms of backness, and using /pˠ bˠ/ as a point of reference, /sˠ/ shows little or no velarization. The sound /tˠ/ is also weakly velarized, though not so weakly as is /sˠ/. In spite of this fact, the sounds /tˠ/ and /tʲ/ are well separated in backness, in part because /tʲ/ is very fronted. Overall, the Coronal Hypothesis, that velarization is weaker in coronals, is supported, though only with respect to tongue body backness; we find no such difference for the tongue root.
It is worth pointing out that the weaker velarization of the coronals is audible (and has been observed in traditional descriptions of Connacht Irish, e.g. Mhac an Fhailigh Reference Mhac an Fhailigh1980). For our speakers the /tˠ/ and /sˠ/ of tuí /tˠiː/ ‘straw’ and suí /sˠiː/ ‘sit’ ranged impressionistically from very velarized to not velarized at all. This difference for coronals mirrors what has been found for Russian and possibly Scottish Gaelic (Section 2.2.2), suggesting that there might be a general explanation for this pattern. Such an explanation could lie in production. For example, it is conceivable that constraints on producing coronals like /t/ or /s/, together with the coupling between the tongue body and blade/tip, inhibit tongue body backing in coronals. However, there is evidence that at least in some languages dental sounds are regularly accompanied by tongue body backing (Stevens, Keyser & Kawasaki Reference Stevens, Keyser, Kawasaki, Perkell and Klatt1986, Dart Reference Dart1991, Operstein Reference Operstein2010, Lee-Kim Reference Lee-Kim2014). At least /tˠ/ in Connemara Irish is dental (de Bhaldraithe Reference de Bhaldraithe1945, Ó Raghallaigh Reference Ó Raghallaigh2013), so this evidence may speak against such an explanation rooted in production. An alternative, but complementary, explanation relies on the idea of cue trade-off: /tʲ/ and /sʲ/ have robust cues to their palatalization apart from the second formant displacement associated with tongue body production. The sound /tʲ/ is frequently affricated; the intensity, duration, and quality of the noise in /sʲ/ and in the release of /tʲ/ are potential cues to palatalization (Ní Chiosáin & Padgett Reference Ní Chiosáin and Padgett2012). Indeed, what we transcribe for consistency as /sʲ/ is realized as [ɕ] or [ʃ] in Irish, so that the contrast between this sound and /sˠ/ might be wholly borne by cues contained in the frication noise. It is possible that these ‘secondary’ cues to palatalization in /tʲ sʲ/ compensate for weaker velarization in /tˠ sˠ/.
Our findings regarding velarization of non-palatalized consonants in Irish closely parallel previous findings for Russian (and possibly Scottish Gaelic), as detailed in Section 2.2.2. In particular, tongue body backing is strong in velarized labials, but significantly weaker or absent in velarized coronals. We also found that tongue body backness is more variable in velarized than in palatalized coronals. In terms of both degree and consistency, velarization in coronals may be ‘weaker’ than palatalization in both Irish and Russian.
Our results show that, at least in the context of /iː uː/, labial stops and fricatives exhibit robust palatalization and velarization. We can think of two possible explanations why some traditional descriptions imply less tongue body activity for labials, contrary to our findings (Section 2.2.1). First, compared to coronal and even velar obstruents, palatalized labial obstruents have less in the way of ‘secondary’ cues to palatalization, consisting of the intensity, duration, and spectral properties of noise. This is because the noise produced by labial obstruents tends to be lower in intensity, shorter in duration (in the case of stops), and less shaped by resonant cavities (Stevens Reference Stevens1998: 340–375). This means that next to front vowels in particular (where the second formant is already high due to the neighboring vowel), audible palatalization is minimal. Second, the tongue body position of labials may be less subject to introspection than that of coronals or velars, since no consistent contact is made between the tongue blade or body and the roof of the mouth.
Our tongue body data allow us to see past significant impressionistic variability in the realization of Irish palatalization. For example, the Irish contrast has been described as one of palatalized vs. plain consonants before back vowels, e.g. beo [bʲoː] ‘alive’ vs. bó [boː] (rather than [bˠoː]) ‘cow’, but of plain vs. velarized consonants, respectively, before front vowels, e.g. bí [biː] (rather than [bʲiː]) ‘be (imp)’ vs. [bˠiː] ‘yellow’ (Ní Chiosáin & Padgett Reference Ní Chiosáin, Padgett and Lombardi2001, Reference Ní Chiosáin and Padgett2012). That is, at least for labials palatalization is no more evident before front vowels than velarization is before back vowels like /uː/. (As noted above, palatalization is more auditorily salient in coronals and velars, even before front vowels, because it is often accompanied by significant noise.) This apparent shift in the realization of the contrast can be seen as only an artifact of the vocalic context, however. As seen earlier (Figure 11 and Figure 12), the tongue body is in roughly the same position in píosa /pʲiːsˠə/ ‘piece’, impressionistically [piːsə], as it is in b'fhiú [bʲuː] ‘it is worth’, just as it is in the same position in púca [puːkə] ‘ghost’ as it is in buí [bˠiː] ‘yellow’. While the transition from /Cˠ/ to [iː/eː] or from /Cʲ/ to [uː/oː] is highly audible, there is relatively little or no transition in tongue body position from /Cˠ/ to [uː/oː] or from /Cʲ/ to [iː/eː]. In other words, the secondary articulations of the consonants do not actually depend (much) on vowel context, but the changing vowel context causes the perception of the sounds to differ.
Vowel context – /iː/ vs. /uː/ – had a significant effect on the backness of the tongue body during consonant production. However, this was true only of fricatives overall, and mainly for velarized fricatives. The greater effect on velarized consonants may reflect greater variability in the production of velarization in general (see Kedrova et al. Reference Kedrova, Anisimov, Zaharov and Pirogov2008). However, we are puzzled about the finding for fricatives. It is possible that this finding is an artifact of our sound labeling. The end of a fricative was taken to be at the onset of higher formant visibility in the following vowel, while in the case of stops it was the stop burst. If our labeling criterion for fricative offsets placed the end of the consonant further into the articulation of the vowel, then vowels would likely appear to have a greater effect on the tongue body of fricatives.
Overall, however, the effect of vowel on the tongue body position of these Irish consonants is very small, roughly 13% of the effect of secondary articulation itself even at the offset of the consonant (Table A1 of the appendix), supporting our third, Coarticulation Resistance Hypothesis. Presumably the inherent secondary palatalization and velarization specifications of Irish consonants largely override coarticulation with following vowels. Farnetani et al. (Reference Farnetani, Provaglio, Chasaide, Fealy, Recasens, Fontdevila and Pallarues1991) and Ní Chasaide & Fealy (Reference Ní Chasaide and Fealy1991) find resistance to coarticulation for Irish consonants, and the effect is well documented for Russian (Öhman Reference Öhman1966, Purcell Reference Purcell1979, Choi & Keating Reference Choi and Keating1991, see discussion in Recasens, Pallarès & Fontdevila Reference Recasens, Pallarès and Fontdevila1997, Manuel Reference Manuel1999, Recasens Reference Recasens1999).
Since our speakers were radio broadcasters (see discussion in Section 3.1), it could well be that their pronunciations were more conservative and/or hyperarticulated than those of the average Irish speaker. In addition, they may have inferred from the presentation of the materials that we were interested in the palatalization contrast. We doubt that these facts undermine any of the basic conclusions of this paper. For example, the evidence of coarticulation resistance discussed above is mirrored by previous studies of both Irish and Russian (Section 2.2.2); the evidence that coronal velarization is different from that of labials and dorsals is also consistent with previous studies of Russian and descriptions of Irish. If our speakers are different at all, it is probably in the degree to which they maintain the palatalization contrast in general: as noted in Section 2.1, there is evidence that the contrast is less well maintained by younger speakers.
This paper is of interest also for its use of principal component analysis (PCA) to characterize effects on the tongue body and root. This analysis led to relatively simple, interpretable, results, and did so while taking the entire tongue shape into account rather than relying on a single point or other less secure and representative measure. An early precursor in this regard is Harshman et al. (Reference Harshman, Ladefoged and Goldstein1977), which used a related method, PARAFAC, to explore factors underlying the production of English vowels. Harshman et al.’s analysis yielded two main factors (dimensions of variation): one was ‘a forward movement of the root of the tongue accompanied by an upward movement of the front of the tongue’, and the other ‘an upward and backward movement of the tongue’. Unlike Harshman et al., we found a principal component related to the tongue root independent of one related to tongue height (or backness). This most likely reflects a real difference between the phenomena examined: Harshman et al. examined English vowels, and there is independent evidence that tongue body height and tongue root advancement co-vary for the English tense/lax contrast (Ladefoged & Maddieson Reference Ladefoged and Maddieson1996: 302–305, Tiede Reference Tiede1996). If these factors co-vary in the data, we expect them to show up as a single factor in analyses involving PCA or PARAFAC, which reduce correlated variation to a single factor.Footnote 6
6 Conclusion
Our results, together with the related archive of images, data, and recordings (see introduction) should be of interest to anyone concerned with understanding the Irish palatalization contrast, including phonologists, phoneticians, dialectologists, and Irish language learners. Apart from its descriptive interest, the data here bear on theories of coarticulation and contrast realization, among other areas.
One limitation of this study is its focus on data from only one of the three major dialects, Connacht Irish. We have obtained analogous data representing the two other major dialect areas, Munster and Ulster Irish, which we intend to present in future work. Apart from its descriptive importance, data from three dialects can be likened to a controlled experiment in which hypotheses about a palatalization contrast can be better tested. For example, palatalized coronal stops in Ulster Irish are realized with more affrication than in other dialects, while velarized labials in that dialect are described as strongly rounded (Quiggin Reference Quiggin1906, Boyle Reference Boyle1973). Does affrication of /tʲ/ and /dʲ/ to [tʃ] and [dʒ] respectively imply even weaker velarization of their velarized counterparts than seen for Connemara Irish, as the discussion of cue compensation in Section 5 would imply? If velarized labials are rounded, does this rounding trade off with tongue backing? (We also intend to analyze lip capture data from these same ultrasound sessions.)
This study is also limited in the range of consonants and contexts examined. In future work we plan to explore other consonant types (particularly sonorants) and to examine consonants in a wider range of contexts, including in word-final position and adjacent to a broader range of vowels. A wider range of vowel contexts will allow us to better test some claims about Irish secondary articulations (involving for example the role of tongue body height), while a comparison of word-initial and word-final contrasts will allow us, for example, to test claims about the phonetic origins of word- or syllable-final neutalization of secondary articulation contrasts (see Kochetov Reference Kochetov2002, Reference Kochetov2004; Ní Chiosáin & Padgett Reference Ní Chiosáin and Padgett2012).
Acknowledgements
This material is based upon work supported by the National Science Foundation under Grants No. BCS-1424398 and BCS-1423772, and by grants from the UC Santa Cruz Committee on Research. Many people contributed to the improvement of this paper; we thank them here, and apologize for not listing them all by name. We are grateful to Jenny Bellik for her many contributions to our project, and to the undergraduate research assistants who make it possible. We also thank the anonymous reviewers and JIPA editor Amalia Arvaniti for their comments, which greatly improved this paper.
Appendix. Statistical models
Model for PC1 (Sections 3.6.4 and 4.3)
P-values were estimated from the t statistic using an upper-bound 715 degrees of freedom (733 observations less the 18 fixed-effect parameters in the final model, see Baayen Reference Baayen2008: 297). The model has a fairly low amount of collinearity (κ = 1.95, VIF < 8.18 for all predictors). These values were computed using mer-utils (Frank Reference Frank2014); on collinearity see Baayen (Reference Baayen2008: 221–222), York (Reference York2012), and Wurm & Fisicaro (Reference Wurm and Fisicaro2014). Significant predictors are marked with an asterisk. Values for β in Table A1 are in z-scores, as all models were fit to z-score normalized values of the principal component (see discussion in Section 3.6.3).
Model for PC3 (Sections 3.6.4 and 4.3)
P-values were estimated from the t statistic using an upper-bound 718 degrees of freedom (733 observations less the 15 fixed-effect parameters in the final model). The model has a fairly low amount of collinearity (κ = 1.80, VIF < 5.39 for all predictors).
Model for PC2 (Sections 3.6.4 and 4.4)
P-values were estimated from the t statistic using an upper-bound 719 degrees of freedom (733 observations less the 14 fixed-effects parameters in the final model). The model has a fairly low amount of collinearity (κ = 1.94, VIF < 5.51 for all predictors).
Model for PC1 dynamics (Section 4.7)
In order to investigate consonant dynamics, we computed another linear mixed-effects model with PC1 (backness) as the dependent measure. The initial model included fixed effects for manner, major place, secondary articulation, and vowel context, as well as all two- and three-way interactions between these terms. It additionally included a fixed effect of consonant landmark (onset, midpoint, offset); two-way interactions between consonant landmark and each of secondary articulation, vowel context, and manner; a three-way interaction between consonant landmark, secondary articulation, and vowel context; and another three-way interaction between consonant landmark, secondary articulation, and manner. A random intercept for speaker was included, as well as random intercepts and by-speaker random slopes for secondary articulation and consonant landmark. This is a relatively simple random effects structure, but we found that models with more complex random effects structures either failed to converge or involved large amounts of collinearity.
Table A1 Final regression model for PC1 (backness). Factors are sum-coded; coefficients express predicted change in value of PC1 relative to grand mean for all levels of that factor.

P-values were estimated from the t statistic using an upper-bound 2168 degrees of freedom (2199 observations less the 31 fixed-effects parameters in the final model). The model has a low amount of collinearity (κ = 2.03, VIF < 1.4 for all predictors).
Table A2 Final regression model for PC3 (backness). Factors are sum-coded; coefficients express predicted change in value of PC3 relative to grand mean for all levels of that factor.

Table A3 Final regression model for PC2. Factors are sum-coded; coefficients express predicted change in value of PC2 relative to grand mean for all levels of that factor.

Table A4 Final regression model for PC1. All factors are sum-coded except for consonant landmark; coefficients express predicted change in value of PC1 relative to grand mean for all levels of that factor. Consonant landmark is backward difference coded; coefficients express predicted change in value of PC1 relative to the previous level for that factor (onset > midpoint > offset).

Table A5 Final regression model for PC3. All factors are sum-coded except for consonant landmark; coefficients express predicted change in value of PC3 relative to grand mean for all levels of that factor. Consonant landmark is backward difference coded; coefficients express predicted change in value of PC3 relative to the previous level for that factor (onset > midpoint > offset).

Model for PC3 dynamics (Section 4.7)
To assess dynamic changes in PC3 (height) over time, we computed another linear mixed-effects model with PC3 (backness) as the dependent measure. The initial model had the same fixed-effects and random-effects structure as the model used to explore PC1 dynamics.
P-values were estimated from the t statistic using an upper-bound 2169 degrees of freedom (2199 observations less the 30 fixed-effects parameters in the final model). The model has a low amount of collinearity (κ = 2.01, VIF < 3.21 for all predictors).


