


1. Introduction
Clean-energy transitions, or the transformation of energy systems toward low-carbon technologies, are an increasingly globalized phenomenon.Footnote 1 In particular, investments in renewable energy (RE) technologies have grown rapidly in recent years, with developing countries overtaking developed countries in investment volumes in 2015.Footnote 2 While China and India represent the largest non- OECD markets, the number of developing countries that have garnered RE investments has grown in recent years.
Despite these trends, many developing countries are still struggling to kick-start the diffusion of RE technologies, with more than seventy developing countries still lacking any utility-scale RE plants as of 2016.Footnote 3 The starting point for the diffusion of a technology in a new country is the market opening, i.e., the first project using that technology in the local context. While market openings are crucial in paving the way for followers and, as such, indispensable for technology diffusion, they hardly have been studied.Footnote 4 An improved understanding of market-opening patterns and drivers can inform international institutions and national policy makers in accelerating the diffusion of RE worldwide.
Unlike goods or commodities that can easily be imported, large-scale RE power plants require in situ activities to ensure that the technology is compatible with local conditions, with the required adaptations typically increasing with the complexity of the technology itself.Footnote 5 While extant literature has investigated how the successful diffusion of RE technologies—whose value chains are shaped largely by forerunner countriesFootnote 6—is moderated by technology complexity, most of these studies have focused on the role of international technology suppliers in the transfer of technologiesFootnote 7 and technology financing.Footnote 8 A separate stream of research has studied the diffusion and adoption of national RE support policies in developing countries.Footnote 9 However, policies do not necessarily precede the initial use of new technologies in a market, but might instead follow a nation's initial experience with a technology.Footnote 10 Thus far, extant literature largely has overlooked the role that project developers play in opening RE markets, despite their decisive role in connecting local markets with global RE-technology supply chains. For renewables, these actors typically are key coordinators for identifying appropriate sites, obtaining local permits, procuring equipment and services, and defining the overall business case.Footnote 11
In the case of RE projects, many adaptations that are required to ensure that the technology is compatible with local conditions involve development activities such as site-specific engineering design, permitting procedures, or tapping into local supply chains and labor markets.Footnote 12 For the first RE projects, on-the-ground activities can be even more challenging due to underdeveloped regulatory processes or lack of existing industry networks.Footnote 13 As a result, market openings for renewables generally are characterized by high risks and complexities in project development—both of which often can be compounded in many developing-country contexts.Footnote 14 Given the importance of managing project risks and complexities associated with RE projects, developers, thus, are crucial actors in opening new markets. Despite this importance, little attention has been given to the role that project developers play in creating knowledge spillovers, developing local markets for specialist skills and services, or shaping appropriate regulations.Footnote 15 While some case studies have begun to characterize project developers in forerunner countries,Footnote 16 little research has investigated who these entrepreneurial actors are in developing-country contexts.
This paper draws on extant literature, including studies on innovation and firms’ internationalization processes to investigate how market-opening patterns and the role of project developers in nascent RE markets differ across RE technologies. In a first step, we utilize a newly merged dataset of project and organizational information from two Bloomberg databases to address the research question:
(RQ1) How do the global dynamics of market openings differ across clean-energy technologies?
In a second step, we combine quantitative data from these databases with interviews of early project developers to address the second research question:
(RQ2) How do technologies differ regarding the type of actors who engage in project development to open new markets?
This article presents the first large-N study of early project developers, drawing on evidence from eighty developing countries that had developed at least one RE project by the end of 2016. Results from this empirical analysis show that a specific type of actor—international, private project developers—opened the markets for solar photovoltaics (PV) and wind power in many countries despite the electricity sector typically being a largely public domain. Hence, in a third step, we further explore the origins and motivations for these international developers, drawing on both quantitative and interview data. Accordingly, our third research question is more exploratory:
(RQ3) Why do international private developers open renewable-energy markets?
The article begins with a theoretical perspective on the potential impact of technology complexity on market-opening patterns and the motivation of international project developers to open new markets. Section 3 briefly describes the empirical approach. Results on technology differences in market-opening dynamics (RQ1) are presented in section 4, while section 5 summarizes the evidence on the roles of different types of actors for different RE technologies (RQ2). Section 6 focuses on international private developers and the drivers for developing the first RE projects in developing countries (RQ3). The final section discusses broader implications and concludes.
2. Theory
2.1 Renewable-energy technology complexity and market openings
Coming from an in-depth understanding of technologies, innovation studies postulate that the inherent characteristics of new technologies impact how technologies diffuse. One important characteristic is a technology's complexity in terms of its technology product architecture, which describes the number and linkages between sub-systems of a technology.Footnote 17 We use this concept to provide the theoretical underpinnings regarding expected differences in market-opening patterns across RE technologies. Specifically, technologies can be located on a complexity continuum: from simple and modular (often mass-manufacturedFootnote 18) products, to assembled design-intensive products, to very complex product systems with multiple interacting sub-systems and components.Footnote 19 Figure 1 illustrates this continuum. Empirical research locates RE technologies across the entire continuum: From solar PV (simple), over wind (design-intensive), to biomass (complex product system).Footnote 20

Figure 1: Different degrees of complexity in technologies’ product architecture
Simple mass-produced technologies typically do not require strong adaptation to local contexts, whereas more design-intensive products typically are tailored to individual users’ needs or, in the case of complex product systems, often are entirely custom-made.Footnote 21 Differences in technological complexity and in required interaction with local contexts hold important implications regarding patterns in technological learning and cost reductions, as well as the tacit knowledge required for their successful adoption.
2.1.1 Global cost reductions in renewable-energy technologies
RE technologies have seen significant technological advances. This progress often is represented using the concept of a learning curve, which imposes a relationship between the decrease in unit cost of a technology and the cumulative experience gained from deploying the technology.Footnote 22 RE technologies traditionally have received substantial public support in forerunner countries since the 1980s. This policy support stimulated domestic deployment, fostered the buildup of technological capabilities and manufacturing capacities, and ultimately pushed RE technologies down their learning curves.Footnote 23 The drastic fall in the costs of renewables, which are available in many countries now and are competitive with conventional fossil-fueled energy generation, has only accelerated their global proliferation in recent years.
Importantly, the domestic deployment of renewables in forerunner countries often has elicited lower renewables costs worldwide. This international spilloverFootnote 24 stems from certain technology-product architectures that allow their value chains to become highly globalized. In part, technological capabilities can accumulate in the technologies or components themselves,Footnote 25 or in the equipment used to manufacture these technologies and components—particularly for technologies lying to the left on the complexity continuum in figure 1 (i.e., rather simple products).Footnote 26 These technologies often are assemblies of globally traded components, essentially commodities with standardized interfaces that allow them to be applied to multiple contexts and geographies with little adaptation required. For these simple and modular technologies, global deployment drives technological learning,Footnote 27 resulting in considerable global spillover effects in the form of technology-cost reductions. This effect is particularly evident in the case of solar PV, which has experienced rapid cost reductions since 2010 (see figure 2). This effect is less pronounced with increasing product complexity. More design-intensive technologies, such as wind farms, typically require a higher share of locally adapted or sourced components.Footnote 28 As a result, while some components are derived from global commodity markets, a greater share of technological learning depends on the buildup of local technological capabilities, resulting in a less-steep learning curve. Complex products, because they often need to be designed or customized for each unique context, typically result in little learning across projects, resulting in a relatively flat learning curve (see figure 2 for biomass, which has seen little cost reduction over time).Footnote 29

Figure 2: Development of average generation cost per technology
Therefore, technologies whose product architectures are characterized by high modularity, allowing for incorporation of large amounts of globally traded components, are likely to see a rapid spike in many market openings worldwide once technology costs have fallen sufficiently to become competitive with conventional energy sources. In contrast, more design-intensive or complex technologies whose costs are less driven by global deployment likely will experience global and less-rapid market-opening dynamics.
Of course, local energy policy also affects technology diffusion and market openings, particularly in highly regulated sectors such as the electricity sector.Footnote 30 In fact, many countries enacted support policies for RE,Footnote 31 with certain support instruments (such as feed-in tariffs)Footnote 32 undergoing an international policy-diffusion process.Footnote 33 Importantly, policies do not always precede the (early) diffusion of a new technology. Sometimes technologies can be a driver of policy, especially if the technology is not new to the world, but “only” new to a country.Footnote 34 Often, policy makers only enact policies that target specific technologies once they have gained some experience with the technology, e.g., through first-demonstrator projects.Footnote 35 Thus, in the present study, we also compare the timing of market openings with the timing of policy implementation per country and technology.
2.1.2 Tacit knowledge in renewable-energy project development
Theoretical insights from technology complexity also contribute to the second research question, concerning the role of different types of actors in developing a nation's first RE projects. As discussed previously, for simple products, a large share of knowledge and technological capabilities is codified within the hardware itself. For more complex technologies, successful deployment requires a larger share of tacit knowledge—or knowledge related to processes and routines.Footnote 36 A high degree of tacit knowledge is involved in the case of first RE projects: From a technical perspective, renewables might require specialized skills and services (e.g., wind measurements or installation techniques)Footnote 37 that might not be available in a country a priori. Also, specific regulations (e.g., environmental and building-permit procedures, grid connections for fluctuating renewables, or exact terms of public remuneration schemes) often are initially uncertain or not yet implementedFootnote 38 and, therefore, must be navigated and shaped concurrently with first projects. Even within RE technologies, the tacit knowledge involved in, e.g., power-plant design, is likely higher for biomass—a technology that must be designed around the particular fuel – than for solar PV, which utilizes a modular design and universal energy input (solar energy).Footnote 39
Tacit knowledge, which accumulates in actors or organizations,Footnote 40 is prevalent in project-based organizations, as the multi-interface nature of their businesses requires much “know-how” and “know-who” that tends to be uncodified.Footnote 41 Due to this uncodified nature, the tacit knowledge required to navigate the process of opening markets is difficult to transferFootnote 42 as it is built up through a firm's experience, i.e., learning by doing. As a result, firms that have accumulated this tacit knowledge, e.g., international firms that have opened markets in their home countries, may be able to function more easily as market openers in developing countries. At the same time, the tacit knowledge involved in project development may be context-specific.Footnote 43 In such cases, domestic project developers may have an advantage, provided that sufficient local technological capabilities exist.Footnote 44 Although lacking experience in developing RE projects, local actors may have greater accumulated knowledge about navigating local regulatory processes or accessing local labor markets and industrial networks.Footnote 45
The degree to which tacit knowledge is localized, as well as the level of technical capabilities required in project development, will vary across different RE technologiesFootnote 46 and should be reflected in project developers’ origins. Technologies that require hard-to-acquire capabilities and no major local tacit knowledge are more likely to be initially developed by international firms, with the share of local project developers possibly increasing in follow-up projects.Footnote 47 Conversely, technologies that do not require such hard-to-acquire capabilities, but do require important local tacit knowledge, are more likely to attract local project developers.
2.2 Internationalization of private project developers
Regarding the third research question on why international project developers have been particularly active in market openings, management theory can help explain the motivation and behaviors of these specific actors. Following the classical transaction-cost argument, companies make market-entry decisions based on a comparison of internationalization costs and expected outcomes in each market.Footnote 48 While early entrants potentially can reap benefits from being a first mover (e.g., access to the most-attractive sites and exclusive partnerships with local firms),Footnote 49 it is often more attractive to be a later mover and free-ride on investments after major challenges involved in market opening have been overcome.Footnote 50 This free-riding option seems to be an important consideration in the case of RE technologies, in which the advantages of more mature markets, e.g., local regulators’ familiarity with the technology, often are non-exclusive and benefit all future players, rather than just first movers.Footnote 51
Given the trade-offs involved, international-management literature has conceptualized firms’ internationalization processes.Footnote 52 Three strands of literature provide theoretical insights on market openings for RE technologies. First, rooted in the resource-based view of the firm, the Uppsala Model describes an incremental internationalization process from initial exports to wholly-owned local operations, allowing for gradually building relevant knowledge on new markets.Footnote 53 However, the process can be less-incremental if the experience gained from entering markets with comparable conditions can be generalized to other markets.Footnote 54 Comparing technologies, market-entry experiences should be more generalizable for technologies that require little localized tacit knowledge. Regarding the choice of new markets, the Uppsala model postulates that firms start with foreign markets that are similar to their home markets regarding cultures and institutional conditions.Footnote 55
Second, building on a broader set of economic theories, the Eclectic Paradigm postulates that ownership, location, and internationalization advantages influence firms’ internationalization strategies.Footnote 56 Such ownership advantages include firm-specific knowledge—e.g., from previous market-entry experience—that might allow developers to acquire “market-entry” skills as a firm-specific advantage. Location advantages refer to the attractiveness of specific new markets, and internationalization advantages involves the costs associated with different market-entry modes.Footnote 57
Third, complementary extant literature points toward the importance of Industrial Networks, i.e., the web of business relationships required to successfully operate in new markets.Footnote 58 For RE, the importance of local networks again will depend on the degree to which crucial tacit knowledge is localized for a certain technology.
3. Research design
This paper uses quantitative data to answer the first research question and applies a mixed-methods design, using both quantitative data and qualitative interviews to answer the second and third research questions. The following section describes the scope of analysis, the quantitative data, and the qualitative interviews.
While hydropower has been used in some developing countries since the beginning of the twentieth century, the global diffusion of other RE technologies is a comparably recent development. In this paper, we consider the three most important non-hydro RE technologies: onshore wind turbines, solar PV, and biomass/biogas combustion (referred to as biomass in the paper). On an industrial scale, these technologies initially have been developed primarily in the Global North, then diffused to the Global South after the 1990s. Importantly, these technologies differ markedly in the complexity of their product architecture, including their requirements for localized knowledge and adaptation.Footnote 59 With this selection of diverse cases,Footnote 60 we would expect to see differences in the results for each technology regarding market-opening dynamics, as well as the share of international developers involved, as outlined in the theory section. We focus on the period between 1992 (when the United Nations Framework Convention on Climate Change (UNFCCC) was adopted) and 2016, and analyze all 154 developing and newly industrialized countries that are non-Annex I parties to the UNFCCC.
To identify early project-developer characteristics across geographies, the present study draws on two financial databases maintained by Bloomberg New Energy Finance (BNEF). The first dataset includes all utility-scale—typically above 1 megawatt (MW)—RE projects globally that are known to Bloomberg.Footnote 61 Using the operation/commissioning date, projects within the same country and technology are numbered according to their sequence of realization. We analyze the first projects in each of the three technologies in each studied country and then compare the characteristics of project developers with those of follow-up projects. The analysis is restricted to a maximum of twenty projects per country to prevent an overrepresentation of a select few countries with a very high total number of wind or solar projects (e.g., China). In sum, 863 projects in eighty countries were identified through this analysis.
For most projects, BNEF provided the name of the original project developer, or else it could be researched based on other information available (e.g., through the involvement of a multilateral development bank). We use the project developer's name to match our dataset to a second BNEF database containing information on approximately sixty thousand organizations in the RE sphere.Footnote 62 If a developer is labeled as a subsidiary in that database, we refer to data on its top parent firm. For joint ventures, information on both developers (or on their respective top parents) is used. Characteristics analyzed include the ownership type (public or private),Footnote 63 country of origin, and a description of the business sectors in which a company is active. Particular effort was necessary to gain an overview concerning which point in time technology-specific support policies were introduced in different countries. To this end, we used data from the 2007–17 REN21 reports,Footnote 64 which list countries with RE-deployment policies, to compile an initial database of policy-introduction dates and the “technology-specificity” of policiesFootnote 65 in non-Annex I countries. The database scope includes renewable portfolio standards, feed-in tariffs, and RE auctions. For countries that already had an RE policy in 2007, the date of policy introduction was researched on a case-by-case basis. For auctions, the date of introduction was taken as the date of the first auction, rather than the date of approval of the auction framework.
By design of the quantitative analyses, the validity of results depends on the completeness of the database used. Although BNEF is the most comprehensive global source for project-level information and strives at being complete for projects >1MW, some early projects may be missing. However, the large size of the dataset should prevent any major bias. It also should be noted that many of the challenges that a nation's first entrant faces also apply to its second or third project developers. A sensitivity analysis of not only the first, but also “very early” project developers (e.g., entrants 1–3), yielded results that resemble those presented below.
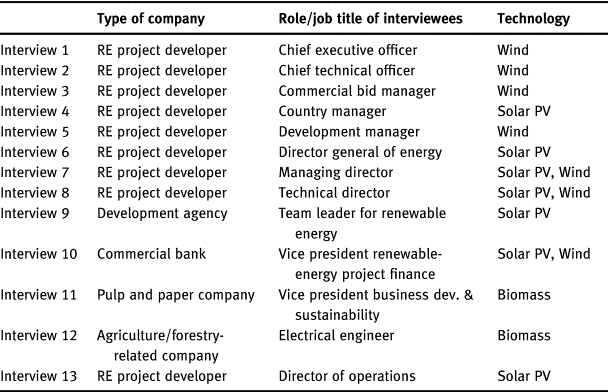
Complementing the quantitative data, a qualitative interview study aims to explain the role and motivation of first-project developers in greater detail. To this end, additional information on the developers of first projects in new countries was collected from BNEF and news-media research, and we contacted executives involved in those projects, as well as other individuals involved in “very early” projects. Also, experts from a development agency and a bank involved in first projects have been interviewed. A total of thirteen semi-structured interviews have been conducted, transcribed and analyzed (see table 1). Discussions took place under the Chatham House Rule;Footnote 66 thus, no references to interviewees or their affiliations are provided.
Table 1: List of interviewees
4. Global market openings over time
Over the last two decades, wind, solar PV, and biomass technologies all have been deployed in developing countries. Focusing on market openings for each of the three technologies, figure 3 shows the years in which countries realized their first utility-scale projects.

Figure 3: First renewable-energy projects realized in developing countries over time
The technologies differ considerably regarding the diffusion pattern over time. The technology differences reflect the respective importance of global and local learning: While wind power diffused quite continuously over time, solar PV proliferated in a “big bang” from 2009 onward, with nine or more markets opened each year during the 2012–15 period. Solar plants’ key components—PV modules and inverters—are globally traded commodities that can be applied across geographies with very little localized knowledge or adaptation required.Footnote 67 The cost of PV modules experienced a steep drop, resulting in much higher competitiveness from 2010 onward (see figure 2), driven predominantly by deployment in forerunner countries (mainly Germany)Footnote 68 and buildup in production capacity in China at the time.Footnote 69 As expected from the theoretical discussion, this technology-cost reduction “spilled over” to other countries and paved the way for market openings in many developing countries after solar became cost-competitive.
In contrast, wind power has not exhibited a pronounced peak in deployment, despite also achieving significant cost reductions over time, though less-dramatic during the period under study (see figure 2). Although wind turbines themselves are supplied by a few leading global manufacturers, developing a wind farm typically requires a higher degree of engineering design to suit site-specific conditions, as well as greater complexity in procurement and construction, resulting in additional costs that tend to reduce the share of global learning within wind's learning curve compared with PV.Footnote 70
Finally, the conversion of biomass to electricity can utilize a broad set of combustion concepts and operating profiles developed in different regions, driven by different types and availability of predominant biomass feedstocks and energy demands.Footnote 71 Consequently, biomass power plants often need to be tailored to specific sites; thus, their deployment typically requires substantial local adaptation.Footnote 72 As in the case of wind, a rather continuous diffusion over time in new developing countries could be expected. Surprisingly, however, figure 3 shows that a peak in market openings occurred in 2008, a wave driven by seven projects developed under the Clean Development Mechanism (CDM), which could be used to offset emissions in countries with emissions-reduction obligations under the Kyoto Protocol. The EU ETS emission trading system, as a large buyer, had accepted CDM credits since 2008. While solar PV played a marginal role under the CDM due to its high abatement cost,Footnote 73 many wind projects realized under the CDM are likely to be non-additional (i.e., they also would have been built without CDM).Footnote 74 In contrast, biomass and biogas projects were particularly attractive under the CDM (and thus much more likely to be additional) due to their avoidance of methane, a greenhouse gas twenty to thirty times more powerful than CO2 and, thus, able to generate more revenue under the crediting mechanism.Footnote 75 Consequently, they have been developed in many different countries (while wind was much more concentrated in fewer countries).Footnote 76 In other words, the CDM, as a global climate-policy instrument, led to technology-specific incentives that translated directly into market openings for biomass.
There are also country-specific factors beyond these general patterns (cf. figure 3): Large countries such as Brazil, China, and India have been among the first with market openings, which was expected given that their large markets are attractive to investors (a location advantage under the Eclectic Paradigm).Footnote 77 Additional early markets have included comparably higher-income nations, such as Israel, South Korea, and Singapore (all of which are categorized as non-Annex I parties to the UNFCCC, despite their growth during the 1970s–90s period), which could afford costly renewables early on and offered a comparatively more stable macro-economic investment environment.
To illustrate the potential role of national (and sub-national) policies on the diffusion of RE technologies, figure 4 shows the introduction of RE-deployment policies (including renewable portfolio standards, feed-in tariffs, and auctions) by technology. Recent years have seen a comparably high number of countries newly introducing policies for solar PV. Otherwise, the pattern over time is quite similar across technologies, with policies only being introduced starting in 2007 to a significant extent. Hence, while extant empirical literature has shown the importance of policies for RE diffusion in general,Footnote 78 it seems to be less relevant for market openings. As additional analysis, figure 5 shows the number of years between the first introduction of an RE policy and the development of the first RE project in each country within the dataset. Over two thirds of the projects were developed in the absence of any deployment policy,Footnote 79 either developed before policy introduction or in contexts in which no policy exists, as recently as 2017. This corresponds with findings from interviews with early developers (see below). Wind and biomass projects were developed particularly early, with solar PV projects more frequently following policy introduction. However, out of the forty-three projects developed at least one year after policy introduction, seventeen were developed more than four years after the policy was introduced, also indicating that policy alone may not be the key driver of these market-opening projects.
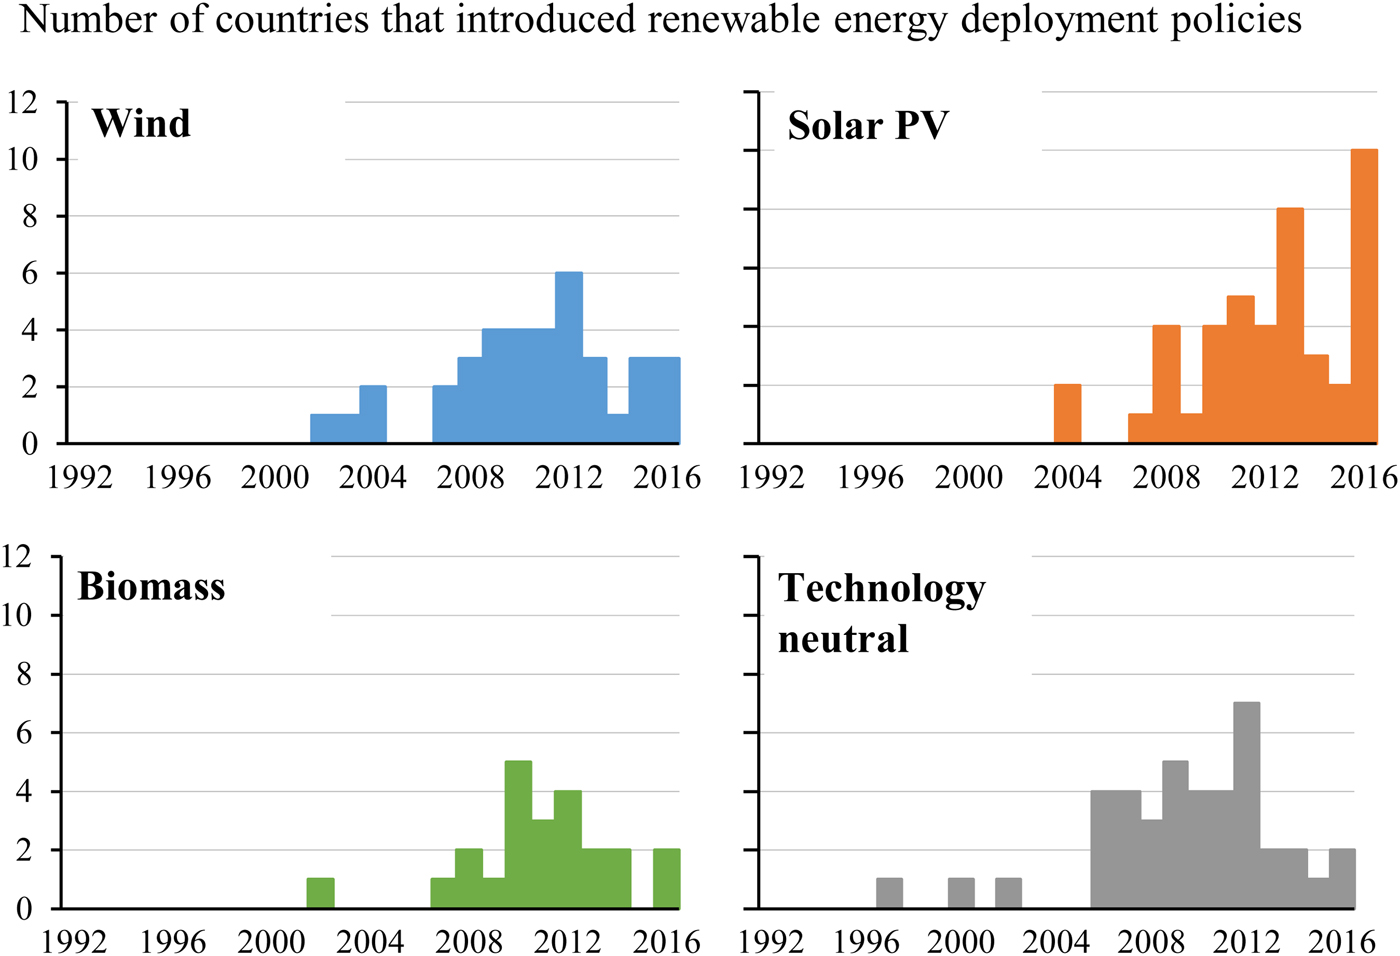
Figure 4: Introduction of renewable-energy deployment policies

Figure 5: Lag between first introduction of renewable-energy deployment policies and first-project developments
5. Actors engaging to open new markets
Data on the project developers behind the market openings summarized in figure 3 are used to discuss the role of different project developers in three steps: In section 5.1, the relevance of private developers (compared with public entities) is analyzed. In section 5.2, we investigate how technology characteristics influence whether domestic or international developers open markets. Section 6 then discusses the motivation of the latter.
5.1 Role of private project developers
The structure of the electricity sector differs considerably across countries, ranging from integrated public monopolies, to hybrid models, to unbundled and competitive markets. Many developing countries traditionally consider power generation a public service, electrifying their countries with state-owned utility companies.Footnote 80 However, independent power producers became more common starting in the 1990s.Footnote 81 Also, international donors, e.g., multilateral development banks, provide financing for both public- and private-sector activities in power generation.Footnote 82
Indeed, private developers have been responsible for a considerable share of market openings across wind, solar PV, and biomass, as seen in figure 6. For each technology, the numbers of first and follow-up projects that have been realized by private developers, public-private joint ventures, and public developers, respectively, are indicated. The share of each type of developer can be read from the y-axis. Across technologies, private developers are very relevant already for a nation's first projects. They make up 45 percent of first-project developers for wind, 61 percent for solar PV, and 89 percent for biomass. Many biomass plants originate in adjacent businesses, e.g., in agriculture or pulp and paper that produce bio feedstock as waste. Consequently, those developers mitigate the core supply-chain risk of biomass projects (see section 5.2, below).Footnote 83
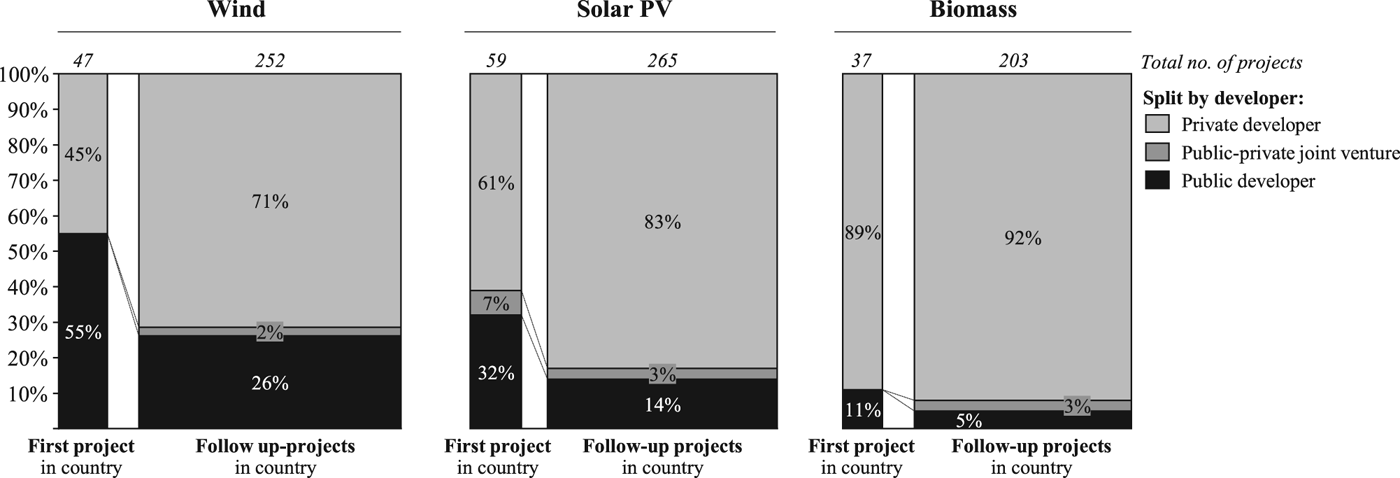
Figure 6: Split between public and private developers by technology
Once a market has been opened, for all technologies, the share of private developers increases over time, already within the direct follow-up projects (cf. figure 6). It seems to be the case that some public players’ advantages (such as insights into the workings of government agencies) are relevant early, especially for first projects, when regulations are still being shaped, but less relevant later. One developer explained: “It is difficult early-on when there isn't any legal framework—if a country is more advanced with a law for grid connection, a nice rulebook, an authority for renewable energy, it becomes much easier” (Interview 8).
5.2 Domestic and international players
With private players being responsible for most first projects, it is worth further differentiating that group. Figure 7 splits the private developers into domestic and international players. The patterns for wind and solar PV are almost identical, with 58 percent and 61 percent of all private first-project developers coming from abroad, respectively. Interviewees indicated that tacit knowledge accumulated by realizing projects in other countries, including knowledge related to the technology itself, project management, and navigating regulatory frameworks provided key advantages for international players in the market-opening phase.

Figure 7: Split between domestic and international private developers by technology
First, regarding technical competencies, the whole value chain of competencies often needed to realize wind and solar PV projects are being brought to the country by the international developer: “In choosing new markets, technical capabilities in the countries do not play a role, as we have to bring all the know-how with us anyway” (Interview 8). International developers can also bring specific competencies that give them a competitive advantage in a new market compared with local developers, as explained by one wind developer: “We developed this wind-mapping software … so we were able to find windy sites where no one else thinks that there's wind, because we understand wind” (Interview 5).
Second, the (typically tacit) knowledge on project-management processes, or how to develop RE projects specifically in new markets, is relatively easy to apply across national contexts: “You have the process, the project management … because you've done a lot of installations that are very similar, so that's basically something you can export to new markets. You also have the experience of how to deal with similar issues that they have in every part of the world” (Interview 1). One of these issues in new markets is understanding how to cope with and shape local regulations (compare section 4), which also can be a capability acquired by developers through learning-by-doing, as “it is always comparable [between countries]: How to deal with partners, how to secure land, who to contact in which order without causing problems … how to deal with grid operators etc.” (Interview 8). Thus, many international developers, due to their knowledge accumulated through learning-by-doing in developing RE projects in other countries, often were better-equipped to open new markets abroad.
However, the share of a nation's domestic developers for wind and solar PV increases during follow-up projects. This effect could be due to “spillovers” from international firms into the local market. While initially, international developers may bring competencies completely from abroad, there is often a natural transfer and buildup of local capabilities in the process of project development. A solar PV developer explains it: “The technical team [from the home country] on the ground was two people, who have done, of course, all the system design, quality control during installation, and instruction of the local technicians …they trained many technicians around that project, both private sector and from the grid operator … so if you want, you can say that our work laid the foundations for solar competence in that part of Africa” (Interview 9). In addition to these knowledge spillovers, first-mover project developers often shape the necessary regulatory frameworks, including familiarizing regulators with RE technologies and “remov[ing] the fear of the utility, the grid operator, of having [renewables] on the grid” (Interview 2), or even pushing for policy incentives, as explained by a developer who “started discussing net metering with the government one and a half years before the project finally started” (Interview 9). Once these enabling frameworks are established, they often lower the barriers to entry for subsequent project developers that may lack the capabilities to manage such processes.
For biomass, the results are different, with the share of domestic developers much higher (61 percent of first projects). This result is driven by the inherent need to manage the aforementioned supply-chain risk, which often is a show-stopping risk for biomass power plants, with the bankability of the project depending on certainty of low-cost biomass supply. One local biomass project developer explained: “There was a lot more interest coming from other corporates and individuals. The big barrier to entry was biomass supply. A lot of these projects are geared quite highly, and [the banks] become very risk-averse […] so of the about five or six projects […] ours was the only one that was successful, and I expect that was because of the security of supply, because we were our own [biomass] supplier” (Interview 11). As a result, biomass-project developers are often owners of the biomass-feedstock plant (e.g., local pulp and paper-mill companies or agricultural companies). In addition, many of these companies already have tacit knowledge in project management and in managing the design and operation of combined heat- and electricity-production processes using their context-specific feedstocks to meet internal heat loads. As one local developer explained it, as the developer's company was breaking into utility-scale biomass: “It's on a sawmill, and we trust that saw-millers know sawmilling best, so we would be able to make better choices than an external company […] we have 16 boilers in our fleet at the moment, we do have an electricity plant [for self-consumption] – we've been working on this for five years, so we've already established a competency” (Interview 12). In follow-up projects, the share of local developers increases even further (to 85 percent), possibly after a track record for the technology has been set. The lack of (tacit) design know-how around the biomass plant-design is often compensated for by strong involvement of (international) actors in the upstream supply chain, particularly through turn-key suppliers, that both play an important role in biomass plant design, as well as procurement of components and construction.
Interestingly, international-domestic joint ventures seem to play only a very limited role (<7 percent of projects under study), even though the Uppsala Model considers this entry mode to be part of the typical gradual internationalization.Footnote 84 However, the data only cover obvious joint ventures with two companies being listed as original project developers, and it might be the case that some of the international entrants have a close partnership with a domestic player that is not visible in the BNEF database or who forms local teams in host countries under the parent name.
In sum, the analysis points to some variety among early project developers, but private international players clearly play an important role: In total, fifteen wind-power markets, twenty-two solar-PV markets, and eleven biomass markets in developing countries have been opened through private project developers’ cross-border activities. While interviews suggest this trend could be due to the advantage that international developers typically have with respect to tacit knowledge related to project-development processes, we explore the drivers for these international market openings in more detail in section 6.
6. Origin and internationalization of private project developers
The notion that the clean-energy transition has become a globalized phenomenon is underlined by the global footprint of international project developers. Figure 8 shows the home countries and entry destinations of international developers that realize first projects in developing countries.Footnote 85 These actors typically are active well beyond their home continents. Five countries stand out as the places of origin for market openers: France (five market openings), Germany (four), Spain (four), the United States (four), and the United Kingdom (three). Germany, the United Kingdom, Spain, and the United States have been forerunner countries in terms of RE deployment, primarily driven by stringent domestic policies for RE sources early-onFootnote 86: Germany's feed-in tariff has been considered a role modelFootnote 87; the United Kingdom used tenders, then quotas/green certificates later; and Spain used a feed-in premium.Footnote 88 In the United States, policies were cultivated on both the federal and state levels, in which various laws were enacted on renewable portfolio standards and tax incentives, among other initiatives, some dating back to the 1980s.Footnote 89 As international developers who open new markets originate primarily from countries with a significant home market for RE, RE-support policies in forerunner countries seem to affect project development abroad.

Figure 8: Home country and destination of international first-project developers
Concerning regional linkages, it is noticeable that developers from these forerunner countries often expanded into countries with which their home countries have post-colonial ties and share the language, such as Latin America for Spanish developers and parts of Africa for French developers. This finding is in line with the Uppsala Model, suggesting that the internationalization of firms starts with host countries that share similar cultures and institutions.Footnote 90 Only a few “South-South entries” to neighboring countries occurred (e.g., from South Africa to Zimbabwe, and from Chile to Argentina), primarily for biomass. However, for wind and solar PV, developers from industrialized countries dominate, particularly from countries with major local manufacturing industries that produce these technologies. This industrial base enables experimentation and close collaboration with the original equipment manufacturers (OEMs), allowing not only the transfer of tacit knowledge and buildup of technology-specific capabilities,Footnote 91 but also access to a strong network of value chains that they can easily tap when entering a virgin market.
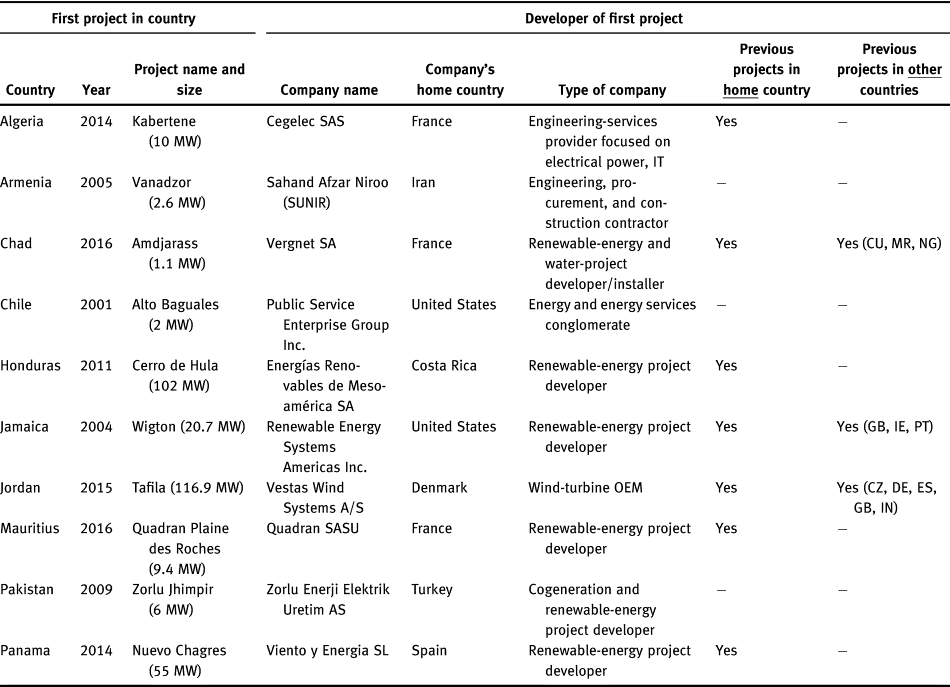
To further inspect the relationship between home markets and first-project developers, tables 2–4 present additional details on international developers of first projects in wind power, solar PV, and biomass, respectively.Footnote 92 For wind and solar PV, about half the players are specialized companies focusing on RE-project development. These companies typically realized projects in their home countries before moving on to developing countries. In addition, RE-technology equipment manufacturers that also act as project developers play a role. For solar PV, many of the firms are multinationals with previous PV projects in several countries. Conversely, biomass involves a different set of actors, including agricultural and industrial players such as sugar or pulp and paper producers.
Table 2: First wind projects developed by international firms
Note: Excludes joint ventures. Company names and home country as of project realization. CU = Cuba, CZ = Czech Republic, DE = Germany, ES = Spain, GB = United Kingdom, IE = Ireland, IN = India, MR = Mauritania, NG = Nigeria, PT = Portugal.
Source: Own analysis based on Bloomberg New Energy Finance, company websites, further desk research.
Table 3: First solar projects developed by international firms

Note: Excludes joint ventures. Company names and home country as of project realization. AR = Argentina, BG = Bulgaria, BR = Brazil, CL = Chile, CO = Colombia, DO = Dominican Republic, ES = Spain, FR = France, GR = Greece, IN = India, IT = Italy, MX = Mexico, PR = Puerto Rico, RO = Romania. Source: Own analysis based on Bloomberg New Energy Finance, company websites, further desk research.
Table 4: First biomass projects developed by international firms
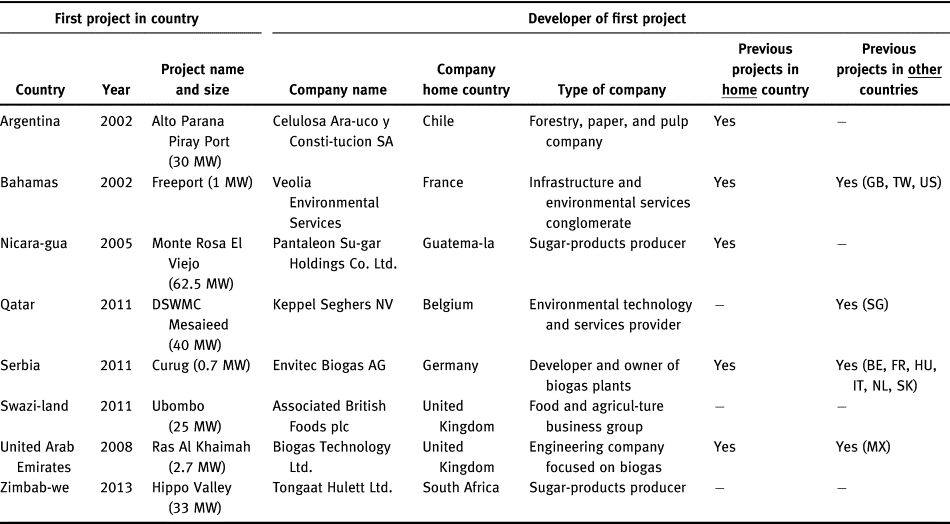
Note: Excludes joint ventures. Company names and home country as of project realization. BE = Belgium, FR = France, GB = United Kingdom, HU = Hungary, IT = Italy, MX = Mexico, NL = Netherlands, SG = Singapore, SK = Slovakia, TW = Taiwan, US = United States.
Source: Own analysis based on Bloomberg New Energy Finance, company websites, further desk research.
Specialized companies focusing on wind- and solar-project development, especially in Germany, Spain, and France, typically emerged in response to strong RE deployment and industrial policies in those countries.Footnote 93 As their home markets stagnated, many of these specialized companies sought opportunities abroad, bringing their know-how and tacit knowledge in RE-project development to the table. For instance, a developer from Germany explained that they had been “doing solar development in Germany, but then the renewable-energy policy changed and the feed-in tariff for utility-scale solar was stopped. This was quite a big hit to the organization. […] how it has developed over the years is that now the development on the solar side takes place internationally” (Interview 7). Likewise, a Spanish developer explained that after the solar market in Spain collapsed, the company decided to “look for new markets to implement our know-how in solar energy. Because we'd spent many years doing solar PV projects, because everything was subsidized or there was a big demand, so we did a lot in a short period of time in terms of solar energy in Spain” (interview 4).
New markets provided a forum in which these experienced and highly specialized developers had a competitive advantage due to their well-developed technological capabilities. As the first developer in a country explained it: “Because the [host country] market was pretty virgin, we had the chance to take advantage of our know-how and have a little advantage over our competitors” (Interview 4). Thus, the market opener tried to reap the benefits of being a first mover, as discussed in section 2.3. For already internationalized companies, opening new markets also allowed for utilizing otherwise-idle capacities: “[For the new country], we formed a development team out of the sales team from the Dutch market, because the Dutch market at that point in time was stuck” (Interview 3). Thus, strong RE policies in forerunner countries led to actors that were experienced and stable enough to spread abroad once home-market demand plunged.
Overall, these results illustrate how international developers, often specialized firms with home-country experience, have taken the important role of being first developers of a technology. These results suggest a spillover of policies from the Global North to the Global South through actors, complementing the previously studied effects of policy diffusion, technology-cost reductions, and capital flows.
7. Implications and conclusion
Overall, the experiences from the eighty developing countries that have commissioned RE plants as of 2016 show that the patterns of RE-market openings have differed markedly among wind, solar PV, and biomass. Technology characteristics determine the importance of global and local learning, and international spillovers through technology-cost reductions have been the largest for solar PV, whose components comprise mostly commodities sourced from the global supply chain.
Once technology costs fell sufficiently to allow for their more widespread deployment in developing countries, a variety of players acted as first-project developers and opened new markets. Private actors seem to be particularly important. In total, approximately fifty first projects deploying wind, solar PV, or biomass have been realized by international developers, most of which came from industrialized countries with a large home market for RE. Consequently, evidence suggests there has been a spillover effect of national RE-support policies in frontrunner countries to other countries, by creating or fostering companies that are willing and able to take the entrepreneurial challenge of developing projects in new countries, starting the transfer of technology and capabilities, and creating positive externalities for followers overall.
Understanding these potential spillovers holds several implications for policy makers: First, it supports the appeal of national regulatory and industrial policies aimed at building an RE industrial complex. To date, many green industrial policies have targeted the buildup of manufacturing facilities for RE equipment. In addition, the growth of local RE-project developers into multinational players not only creates jobs in project development, but also can increase and stabilize manufacturers’ business activities from the same country across business cycles. For example, opportunities abroad helped not only Spanish project developers, but also their equipment suppliers remain in the RE market, even after their home market collapsed following subsidy cuts in 2012. The impact of domestic project developers on different types of manufacturers in the same country (e.g., wind turbine engineering versus solar PV cell production) is worth further research.
Second, actor-level spillovers can help diffuse RE further into those developing countries that do not yet have a single utility-scale wind or solar PV plant. Given that the results showed the importance of international private actors in opening new renewable markets, policy makers could focus on creating an environment that is attractive to the private sector, including establishing frameworks for private-sector participation in electricity generation. While financing for risky first-RE projects might need to come from the public purse,Footnote 94 it still can be private actors that draw on public finance instruments to bring renewables to new shores.
Third, results also have implications beyond renewables. It might be a promising pathway to specifically foster private actors that can accelerate the global diffusion of other, less-mature, low-carbon technologies around which a country aims to build an industry. One example is grid-scale battery-electricity storage, which is being intensively supported by some East Asian countries.
By revealing global patterns, the large-N analysis in this article contributes to the understanding of interactions between domestic clean-energy policies and global technology diffusion. Subsequent interviews also shed some light on the reasons why specifically international private developers have been instrumental in opening new markets. Still, we consider this paper only a starting point for further research regarding international spillovers on the actor level, which could, for instance, assess the moderating effect of home and host-country institutions on market openings by private developers. In the future, it also will be important to consider the growing number of RE-support policies in newly industrialized and developing countries. For instance, China has had ambitious policies in place for quite some time already, such that we might see more Chinese developers open new markets in the near future, including for emerging technologies such as battery storage. With additional deployment policies foreseen in several developing countries’ Nationally Determined Contributions under the Paris Agreement, the relevance of “South-South” spillovers through developers also might increase. In sum, private actors’ potential cross-border, market-shaping activities should be considered when analyzing spatial policy spillovers in the future.


