


Over 60 % of Australian adults are overweight or obese( 1 ). Increases in consumption of high-sugar/fat, energy-dense foods over the past few decades have contributed to this high rate of overweight and obesity( Reference Prentice 2 ), and fast-food outlets are an increasing source of energy-dense foods in the Australian diet( 3 ).
One initiative that may reduce the impact of fast food on the population’s diet is the display of energy (kilojoule or calorie) values on fast-food menus( Reference Burton, Creyer and Kees 4 , Reference Dumanovsky, Huang and Nonas 5 ). The primary objective of fast-food menu labelling is to provide consumers with information that may facilitate healthier meal choices and increase consumer knowledge of the contribution of fast food to energy intake( 6 , Reference Bruemmer, Krieger and Saelens 7 ). However, because fast-food chains may prefer consumers to view their menu items positively, menu labelling may also motivate chains to improve the healthiness of menus by removing unhealthy items, adding healthier items, reducing item portion sizes or reformulating items to reduce the energy content( Reference Bruemmer, Krieger and Saelens 7 , Reference Saelens, Chan and Krieger 8 ). Research from the USA has shown that new menu items introduced after the implementation of menu labelling have been reducing in energy( Reference Bleich, Wolfson and Jarlenski 9 , Reference Jarlenski, Wolfson and Bleich 10 ).
Mandatory menu labelling has been introduced in some Australian states (New South Wales (NSW), South Australia and the Australian Capital Territory)( 6 , 11 , 12 ) and the USA( 13 ), and voluntary menu labelling has been implemented in the UK( 14 ). In NSW, menu labelling legislation became enforceable in 2012( 6 ). Fast-food chains with twenty or more stores across the state or fifty or more stores nationally are required to display kilojoule information on paper menus and menu boards at the point of sale( 6 ).
To date there have been no studies examining the effect of NSW’s menu labelling legislation on the energy content of menu items available at leading fast-food chains. In an aggregated analysis of thirty-seven American sit-down restaurants and fast-food chains, there was a trend towards the availability of lower-energy meals eighteen months after implementation as compared with six months after( Reference Bruemmer, Krieger and Saelens 7 ). However, significant decreases in energy, saturated fat and Na were not seen when fast-food chains were examined independently and there was no change in the energy, saturated fat and Na contents of menu items( Reference Bruemmer, Krieger and Saelens 7 ). A potential explanation for this is that new unhealthy menu items may have been added during the same time period that some nutritional improvements were made to existing menu items( Reference Bruemmer, Krieger and Saelens 7 ). More recent US studies on fast-food children’s meals( Reference Moran, Block and Goshev 15 , Reference Deierlein, Peat and Luz 16 ) and chain menu items more broadly( Reference Bleich, Wolfson and Jarlenski 9 , Reference Jarlenski, Wolfson and Bleich 10 ) found very little change in nutrient composition.
To the authors’ knowledge, there is no published evidence comparing the energy composition of fast-food menu items both before and after menu labelling implementation. The present study investigated changes to the energy content of fast foods by comparing menu items available at five major Australian fast-food chains over seven years both before and after implementation of menu labelling legislation in NSW.
Methods
Sampling
The present study included five of the eight largest fast-food chains in Australia in terms of outlets( 17 ): Hungry Jack’s, KFC, McDonald’s, Oporto and Red Rooster. Of the other three chains, Subway was excluded due to its made-to-order style menu, and Domino’s Pizza and Pizza Hut were excluded due to their made-to-share style menu.
Procedures
The study recorded the energy (kilojoule) content of menu items available at a single time point, each year from 2009 to 2015. Best practice suggests that at least three time points prior to the implementation of an initiative are required to enable changes resulting from an initiative to be seen( Reference Eccles, Grimshaw and Campbell 18 ). Three time points included (2009, 2010 and 2011) were prior to the announcement of legislation requiring fast-food chains to include kilojoule values on menu boards and four time points (2012, 2013, 2014 and 2015) were after implementation. All time points were in March or April of that year. As the legislation was enforceable as of 1 February 2012, the 2012 data were considered after implementation.
At each time point, the energy contents per 100 g and per serving of all listed menu items were collected from the Australian website for each of the chains. Chains were contacted to obtain nutrition information for any other menu items available that were not listed on the websites. For the purposes of the present study, standard menu items were those that had been on the menu for more than one consecutive time point and limited-time only menu items were available at only one time point. Where nutrition information was listed in multiple locations, such as on a PDF as well as the webpages, the information with the most recent update date was included. Where no update date appeared, the PDF information was used as the default.
Examples of inconsistent nutrition information available within websites were identified. This included one item with a serving size of 150 g listed as having more saturated fat per 100 g than per serving. In this case, the item was excluded.
Menu items were grouped into categories to allow comparisons between similar types of items. Categories were based on previous research( Reference Dunford, Webster and Barzi 19 , Reference O’Donnell, Hoerr and Mendoza 20 ) and included breakfast items, burgers, chicken and seafood items, salads, sandwiches and wraps, sides (e.g. French fries) and desserts. Beverages were excluded from this analysis as many chains serve only pre-bottled beverages, meaning the reformulation of these items is beyond the chain’s control.
The publication date of the available nutrition information was recorded and used to determine the information’s currency.
Reliability
To increase reliability, two data collectors were trained using a standard protocol. To ensure data integrity, data were entered by two researchers working independently and cross-checked by a third researcher. Although these steps were taken to improve the reliability of data collection and entry, the accuracy of the data provided by the chains is unknown.
Data analysis
Data were entered in a Microsoft® Excel 2013 spreadsheet and analysed using the statistical software package SAS version 9.3. P values of <0·05 were considered statistically significant.
Before v. after menu labelling
The energy per 100 g and energy per serving were compared before (years 2009–2011) and after the mandatory energy menu board labelling was implemented (2012–2015). Bivariable comparisons of energy before and after implementation were carried out using the Wilcoxon rank-sum test for all menu items in all years, as well as by chain and menu item category. Multivariable regression modelling was used to determine differences in energy before and after implementation adjusted for chain and menu item category. As menu labelling was legislated in 2012, a sensitivity analysis also checked the results without the 2012 data. Other sensitivity analyses included restricting to standard menu items, restricting to items that were available for the full seven years, excluding discontinued items, and using year as a continuous variable to test for trend rather than a binary before/after implementation categorisation of items.
Standard v. limited-time only menu items
As fast-food chains use limited-time only menu items to attract new customers( Reference Glanz, Resnicow and Seymour 21 ), analysis was conducted to determine if there were differences between these types of menu items. Bivariable χ 2 tests were used to determine if there were differences in the proportion of standard and limited-time only menu items by year, chain and menu item category. The independent effect of each of these factors was assessed using multivariable logistic regression. The energy contents of standard items and limited-time only items were also compared, both per 100 g and per serving. A bivariable comparison was carried out using the Wilcoxon rank-sum test and a multivariable general linear model was used to test for any differences after adjusting for year, chain and item category. If a new menu item was added in 2015, then it was not possible to know if it was a limited-time only item or a new standard item, so the 2015 data were excluded from these analyses.
Results
Across the five fast-food chains, there were 552 unique menu items observed over the study period. The number of items in each category can be seen in Table 1.
Table 1 Characteristics of the sample of all standard and limited-time only menu items available at five of Australia’s largest fast-food chains, data collected annually for seven years, 2009–2015

* Bivariable χ 2 test, excluding 2015 data as we cannot be sure of the standard/limited classification for new items in 2015.
† Denotes significant results, P < 0·05.
Before v. after menu labelling legislation
Including all items and years of data and adjusting for menu item category and chain, there was no evidence of a change in energy per serving in menu items available before implementation of menu labelling legislation and those available after, with a non-significant adjusted difference of +17 kJ/100 g (95 % CI −9, 43 kJ/100 g, P = 0·19; Table 2). Looking by menu item category and chain, the energy content per 100 g for burgers was higher after implementation (1040 v. 999 kJ/100 g before implementation, P < 0·001) and menu items from Oporto had significantly higher energy per 100 g after implementation (1013 v. 950 kJ/100 g before implementation, P < 0·001), but there were no other differences by menu item category or chain (see online supplementary material, Tables S1–S4).
Table 2 Energy content per 100 g and per serving for menu items available at five of Australia’s largest fast-food chains before (2009–2011) and after (2012–2015) implementation of menu labelling legislation in New South Wales
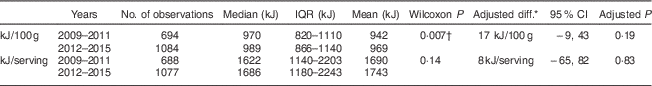
IQR, interquartile range.
* Difference for items available after implementation minus items available before implementation, adjusted for menu item category and chain.
† Denotes a significant result, P < 0·05.
After adjusting for menu item category and chain, there was no evidence of a change in energy per serving before or after implementation, with a non-significant adjusted difference of +8 kJ/serving (95 % CI −65, 82 kJ/serving, P=0·83; Table 2). Looking by chain there was again an increase for Oporto (1870 kJ/serving after implementation v. 1590 kJ/serving before implementation, P < 0·001), but there were no other differences by chain or menu item category. Comparisons by menu categories within chains cannot be made due to small cell sizes and changes being subject to the addition and removal of items. However, the mean energy per 100 g and per serving of menu categories within chains can be seen in the online supplementary material, Tables S5 and S6.
Sensitivity analyses
After adjusting for menu item category and chain, there were no differences between before and after implementation in terms of either energy per 100 g or energy per serving for any of the following: using only standard menu items, excluding discontinued items, just using items available in all seven years (n 110), comparing before implementation with 2012 only, or using year as a continuous variable to test for trend (all P≥0·10 for kJ/100 g and P≥0·60 for kJ/serving). The only slight difference found was using standard items and excluding 2012 data (the changeover year), where there was weak evidence of an increase in kJ per 100 g after implementation (adjusted difference +30 kJ/100 g, 95 % CI 1, 59 kJ/100 g, P = 0·04). There was no evidence of a reduction in energy content either per 100 g or per serving for any of these tests (data not shown).
Standard v. limited-time only items
There were significant differences in the proportion of standard and limited-time only menu items by year and by menu item category (Table 1). After adjusting for menu item category and chain, there was no difference in the proportion of limited-time only items before implementation v. after implementation (P=0·77; data not shown).
After adjusting simultaneously for category, chain and year, limited-time only items had significantly higher energy content per 100 g than standard items, with an estimated difference of 74 kJ/100 g (95 % CI 27, 120 kJ/100 g, P=0·002; Table 3). There were no differences in energy per serving of standard or limited-time only items (P=0·96; Table 3), suggesting that limited-time only menu items were more energy-dense but had smaller serving sizes than standard menu items.
Table 3 Differences in energy content of standard and limited-time only menu items available at five of Australia’s largest fast-food chains, data collected annually for seven years, 2009–2015
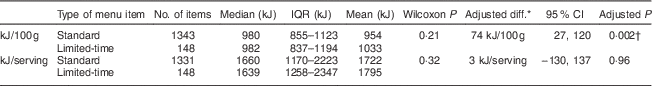
IQR, interquartile range.
* Difference for limited-time items minus standard items, adjusted for menu item category, chain and year.
† Denotes significant results, P < 0·05.
Discussion
Overall, the present study observed no key changes in fast-food energy content following the introduction of mandatory menu labelling in NSW in 2012. The introduction of energy labelling in Australian fast-food chains has not resulted in reformulation changes which could have a more significant and sustainable impact on energy consumption levels. Our study indicates that the fast-food industry in Australia has not considered a sector-wide approach, or even a chain-wide approach to reformulation, at least not in relation to a reduction in energy content.
The results of our study provide the first Australian evidence on changes (or lack thereof) to fast-food menu item energy content following the implementation of menu labelling. An early study from the USA showed modest energy reductions in fast-food menu items after the implementation of mandatory menu labelling( Reference Bruemmer, Krieger and Saelens 7 ); however, that study did not assess energy contents before the implementation of menu labelling. Internationally, the present study is the first to utilise nutrient composition data from both before and after the implementation of menu labelling legislation.
Fast-food chains regularly introduce limited-time only menu items to entice new customers in-store and retain existing regular customers( Reference Glanz, Resnicow and Seymour 21 ). In contrast to research conducted in the USA( Reference Bleich, Wolfson and Jarlenski 9 ), our study found that these items were higher in energy per 100 g than the standard menu items, although not in energy per serving, indicating smaller serving sizes in limited-time only items. A systematic review of energy density and serving weight showed that people consume a similar weight of foods regardless of the energy density( Reference Pérez-Escamilla, Obbagy and Altman 22 ). This may be a concern as the serving sizes of the more energy-dense limited-time only items were smaller, which may lead consumers to eat more, which may in turn increase the energy consumed. As consuming foods lower in energy density has been linked to weight loss and maintenance( Reference Pérez-Escamilla, Obbagy and Altman 22 , 23 ), reducing the energy density of fast food should be considered a priority by the industry to help address the growing public health burden of obesity and diet-related chronic disease.
Our results suggest that the introduction of menu labelling legislation has not resulted in comprehensive changes in energy content of fast-food menus in Australia. However, an evaluation of the menu labelling legislation in NSW on customer purchasing behaviour showed lower energy content of customers’ purchases since the introduction of menu labelling compared with before the implementation( 24 ). Our study shows that chains have not reduced the energy content of menu items, and therefore this reduction in kilojoules purchased may be the effect of menu labelling in improving customer knowledge of energy levels, resulting in healthier choices. To further improve the benefit of reducing kilojoules purchased, reformulation of menu items has the potential to positively impact the energy purchased at fast-food chains. This is an area that the government could pursue to enhance the success of menu labelling.
In 2009, the Australian Government committed to working with the food industry on a range of initiatives( 25 ). The Food and Health Dialogue( 26 ), now replaced by the Food Service Working Group of the Australian Government’s Healthy Food Partnership, was formed to improve the food supply via the food-service sector( 27 ). The Food and Health Dialogue sought voluntary commitments from industry to ‘encourage appropriate portion size in food service sectors’ and ‘reduce energy content of food offerings in food service settings’, among other activities( 27 ). However, the fast-food industry has not yet released portion size or energy content reformulation targets, nor has it been compelled to do so by the government.
Our research shows no action has been taken by the fast-food industry to reduce energy contents of menu items between 2009 and 2015. This may be because the fast-food industry does not believe there is demand from consumers for lower-energy foods, or the lack of impetus from the government( Reference Elliott, Trevena and Sacks 28 ); however, there has been no research published to justify this. Reformulation has the potential to improve population dietary intake as it does not require behaviour change by consumers( Reference Schwartz and Brownell 29 ). However, while voluntary reformulation effects some change, in the case of salt reduction effectiveness could be increased twentyfold through the implementation of a mandatory approach( Reference Cobiac, Vos and Veerman 30 ). To improve public health, systematic reformulation of menu items is needed throughout the fast-food sector and a coordinated, government-led approach is recommended( Reference Reeve and Magnusson 31 , Reference Collins, Mason and O’Flaherty 32 ).
The main strengths of our study are the seven years of systematic data collection and the adherence to best-practice principles for conducting monitoring research on policy initiatives( Reference Eccles, Grimshaw and Campbell 18 ). A limitation of the study is the accuracy of the data sources. A number of nutrition information brochures available on chain websites provided different values for the same menu items. In this case, the most recently updated value was used. The online nutrition information for many menu items at two chains did not change over the duration of the study. This may be because the nutrition information was not updated, or the menu items have not changed in six years.
The nutrition information provided by chains online during the study may not have been accurate. For example, Red Rooster updated some of the nutrition information available in HTML format but not the PDF nutrition information available during the study period, with the last stated update on the PDF occurring in 2011. The website for KFC provided multiple nutrition information brochures with different nutrition values for some items. The values listed on the most recently updated information were included in this case. As our study relied solely on electronic nutrition information, the accuracy of the information gathered cannot be guaranteed. A costly solution to this limitation would be to conduct laboratory analysis of menu items over time. However, many chains did provide analysed nutrition information.
As the present study sampled only five fast-food chains in Australia, results cannot be generalised to smaller fast-food chains or other types of outlets covered by the menu labelling legislation, such as ice-creameries, pizza or coffee and snack chains. This research could be repeated in such chains to determine whether the results are mirrored in other types of outlets. Further, as no sales data are available, we could not determine whether the higher-selling items had reductions in energy contents.
Conclusion
While reformulation across the entire Australian fast-food supply has the potential to positively influence population nutrient intake, our study found that energy levels per 100 g and per serving across five major Australian fast-food chains did not decrease following the introduction of menu labelling legislation. This suggests there has been no systematic or significant energy reductions made by the fast-food industry. To encourage widespread reformulation by the fast-food industry, the government should work with the industry to set reformulation targets. To ensure the entire fast-food industry responds to such targets, they should be mandatory.
Supplementary material
To view supplementary material for this article, please visit https://doi.org/10.1017/S1368980017003706
Acknowledgements
Financial support: This research received no specific grant from any funding agency in the public, commercial or not-for-profit sectors. E.K.D. was supported by a National Health and Medical Research Council Early Career Fellowship (grant number APP1088673). Conflict of interest: None. Authorship: L.W.-C., W.L.W., C.H. and K.C. formulated the research question and designed the study. L.W.-C., M.H. and W.L.W. collected and entered the data. L.W.-C., M.H. and D.G. conducted the data analysis. L.W.-C. prepared the manuscript. All authors contributed to the review of the manuscript and preparation for submission. Ethics of human subject participation: Not applicable.


