


Observational data show that fibre-rich diets are associated with lower body weight or BMI( Reference Du, van der and Boshuizen 1 , Reference Liu, Willett and Manson 2 ). Moreover, experimental studies have shown that foods naturally rich in dietary fibres may result in earlier satiation( Reference Viskaal-van Dongen, Kok and de Graaf 3 ) and suppressed hunger feelings( Reference Holt, Miller and Petocz 4 , Reference Clark and Slavin 5 ). A strategy for body weight management might therefore be to increase dietary fibre intake through fibre-supplemented foods that promote satiety or dilute energy density. However, dietary fibres are a heterogeneous group of compounds, some of which lower body weight and some of which do not influence appetite or body weight( Reference Wanders, van den Borne and de Graaf 6 , Reference Poutanen, Dussort and Erkner 7 ).
A dietary fibre that has been often studied in relation to body weight management is oligofructose. Oligofructose is a soluble inulin-type fructan with a degree of polymerisation of 2–8. It has a sweet taste and may be used to replace sugar in sweet foods( Reference Coussement 8 , Reference Mensink, Frijlink and van der Voort Maarschalk 9 ). Oligofructose is neither digested nor absorbed in the small intestine and therefore delivers less energy – that is, 6·3 kJ/g (1·5 kcal/g) instead of 17 kJ/g (4 kcal/g) – compared with fully digestible carbohydrates( Reference Roberfroid 10 ). This fibre is obtained from chicory root inulin( Reference Roberfroid 11 ) and is well known for its prebiotic effect( Reference Roberfroid 11 – Reference Roberfroid, Gibson and Hoyles 13 ).
Several animal studies have shown that oligofructose supplementation lowers energy intake (EI), prevents body weight gain and improves body composition( Reference Cani, Dewever and Delzenne 14 – Reference Hadri, Chaumontet and Fromentin 20 ). However, the evidence from human data on food intake tends to be contradictory. Several short-term clinical studies have found effects of oligofructose on satiety feelings and food intake( Reference Cani, Joly and Horsmans 21 ), whereas others found only effects on satiety( Reference Cani, Lecourt and Dewulf 22 , Reference Pedersen, Lefevre and Peters 23 ) or food intake( Reference Verhoef, Meyer and Westerterp 24 , Reference Hess, Birkett and Thomas 25 ), or no effects at all( Reference Peters, Boers and Haddeman 26 , Reference Karalus, Clark and Greaves 27 ).
It has been hypothesised that oligofructose triggers weight loss or maintains body weight because it decreases food intake. This decrease may be due to a modified satiety (hormone) response( Reference Parnell and Reimer 28 ). Oligofructose may influence satiety and food intake through fermentation by the gut microbiota; oligofructose can selectively stimulate growth and activity of the gut bacteria Bifidobacterium genus, which are associated with health( Reference Slavin 12 ). However, a longer study period is required in order to observe beneficial health effects such as reduced body weight due to lower EI.
To date, several long-term parallel trials have investigated oligofructose supplementation on weight management outcomes( Reference Parnell and Reimer 28 – Reference Guess, Dornhorst and Oliver 30 ). One study conducted a 12-week trial with forty-eight overweight and obese adults providing 21 g/d oligofructose compared with maltodextrin. This study showed a 29 % reduction in EI after 6 weeks and 1 kg reduction in body weight after 12 weeks. However, subjects did not report differences in appetite and satiety( Reference Parnell and Reimer 28 ). A shorter study performed an 8-week intervention with 30 g/d oligofructose in twenty-two similar subjects. The results showed no effect on body weight and EI, but they did demonstrate that their subjective hunger and motivation to eat were reduced in the oligofructose group( Reference Daud, Ismail and Thomas 29 ). Recently, a trial with pre-diabetic subjects (n 44) showed that 18-week consumption of 30 g/d oligofructose-enriched inulin reduced body weight and food intake, but showed no effect on appetite( Reference Guess, Dornhorst and Oliver 30 ). Thus, the aforementioned studies give inconsistent outcomes: in some cases positive effects on body weight and EI, whereas other studies affect appetite alone. The most important differences between the studies are the duration of supplementation, the study population and the dosage. That said, none of the long-term studies provided oligofructose in a real product, but instead used prepacked sachets that were added to foods or drinks.
In the present study, we investigated the efficacy of 16 g of oligofructose supplementation on several weight management outcomes, including satiety, EI, body weight and body composition. We hypothesised that subjects replacing their daily snacks with bars supplemented with oligofructose would have increased satiety feelings and have lower EI, which would result in a lower body weight and lower body fat mass (FM) compared with subjects replacing snacks with regular bars.
Methods
Subjects
In total, sixty-two volunteers with overweight or obesity (age: 20–60 years; BMI≥25 and ≤35 kg/m2) were recruited from Wageningen and surroundings. The flow diagram of the inclusion of subjects can be found in Fig. 1. Inclusion criteria were apparently healthy as measured by questionnaire (i.e. not reported CVD or abnormalities, liver or pancreas disease, renal disease, thyroid disease, diabetes, stomach or bowel diseases, unstable hypertension or unstable dyslipidaemia), and no use of medicines judged likely to interfere with the experiment in the preceding 3 months to study entry (e.g. appetite or EI suppressing drugs, antibiotics, bulk laxatives). Participants who reported weight fluctuations >5 kg for the last 3 months and those following a diet or exercise regimen, or being excessively physically active, were excluded from the study. Participants were required to have a normal appetite and to regularly consume snacks. Participants were excluded if they were allergic to the study food, followed a special diet (e.g. vegetarian), consumed ≥3 alcoholic drinks/d on average, were pregnant or breast-feeding. In addition, individuals were excluded if they had a fasting glucose concentration >6·9 mmol/l or fasting total cholesterol concentration >6·5 mmol/l or fasting TAG concentration >2·2 mmol/l or the presence of glucose or protein in urine.

Fig. 1 Consolidated Standards of Reporting Trials (CONSORT) 2010 flow diagram of the inclusion of subjects in the intervention study. OF-Bar, oligofructose granola bar; Co-Bar, control granola bar.
We estimated that we needed twenty-five subjects per group to detect a change of 1·5 (sd 1·9) kg body weight (our primary outcome measure). This sample size calculation was based on data collected by Parnell & Reimer, which had a similar design and setting as the present study( Reference Parnell and Reimer 28 ). Furthermore, an 80 % power and α=0·05 were taken into account. Because of an expected dropout rate of 20 %, we aimed to include sixty participants in total. The participants were pair-matched according to sex, age, smoking status and BMI and subsequently randomly allocated to the intervention group (bar with oligofructose (OF-Bar)) and the control group (bar without oligofructose (Co-Bar)) by an independent researcher. The study was triple-blind – that is participants and researchers were blind to the treatment during data collection and data analyses. At completion of the study, the subjects indicated in a questionnaire whether they knew which type of bar they had received. This was in order to check blinding, and after that they were debriefed. The study was performed according to the guidelines laid down in the Declaration of Helsinki, and all procedures involving human subjects were approved by the medical research ethics committee of Wageningen University (ABR 45006.081.13). Written informed consent was obtained and subjects received monetary compensation. This trial was registered at www.trialregister.nl as NTR 4075.
Study design
The present triple-blind, parallel, randomised controlled 12-week intervention study was carried out between September 2013 and January 2014 at the Division of Human Nutrition, Wageningen University. All participants were asked to consume a bar twice a day replacing their normal snack for 12 weeks. Throughout the study, participants lived at home, and purchased and prepared their own meals except on the 3 study days at baseline, weeks 6 and 12. Participants were provided with the following instructions: ‘replace a snack you normally eat for the bar (comparable in energy with the bar) in the morning and in the afternoon and keep a normal activity pattern. Furthermore, consume the bars together with a glass of water, the first bar 30–90 min before lunch and the other bar 30–90 min before dinner’. In a meeting before the start of the study, the participants received examples of common snacks that could be replaced by the granola bar. The study was designed to examine the effects of oligofructose independent of any other diet or exercise regimen. Therefore, participants were asked to maintain their regular lifestyle, to eat until comfortably full and not to consciously try to lose or gain weight during the study.
Screening procedures
After receiving oral and written information and signing the consent form, ninety-one participants completed a health and lifestyle questionnaire to determine eligibility (Fig. 1). This among others included the Dutch Eating Behaviour Questionnaire( Reference van Strien, Frijters and Bergers 31 ) and a FFQ aimed to measure habitual fibre and EI. Next, the participants joined a screening test in fasting state. This test included a measurement of height and body weight wearing light clothes in order to check whether the participants had the required BMI. In addition, blood was drawn to check fasting glucose, total cholesterol and TAG concentrations. Subsequently, urine was tested for glucose and proteins using a test strip.
Study procedures
For all test days, subjects had to arrive in a fasting state, which means that the participants were not allowed to eat after 21.00 hours and not to drink after 23.00 hours the evening before the test day. Each test day the participants arrived at the same time at the University between 07.15 and 10.00 hours. On the full test days (at baseline, weeks 6 and 12), the participants were invited for anthropometric measurements and their spontaneous food intake was measured during 24 h. After weeks 1, 3 and 9, participants had a short test day to check whether the subject suffered from any discomfort and whether he or she succeeded in replacing his/her snacks by the granola bar by measuring body weight and waist circumference. During the first 3 weeks, weight gain was monitored; if subjects were systematically gaining over 0·2 kg of body weight/week, this was seen as an indication of not being able to equally replace their snacks. They were then contacted by our dietitian to give personalised advice to replace snacks equivalent in energy. In total, the dietitian contacted fifteen participants: nine in the OF-Bar group and six in the Co-Bar group. In week 6, these subjects were monitored again. At that moment, for ethical reasons, we excluded one participant in the OF-Bar group and two in the Co-Bar group who gained >1·2 kg in the first 6 weeks.
Physical activity monitoring during the test day
Participants recorded their physical activity at baseline and after weeks 6 and 12, in order to monitor maintenance of the physical activity level throughout the study. They used a 1-d retrospective questionnaire with fourteen categories( 32 , Reference Ainsworth, Haskell and Herrmann 33 ).
Test product and intervention
The OF-Bar group received two chocolate chip, chewy granola bars in which 8 g of oligofructose (Frutalose® L92; Sensus, containing 92 % oligofructose and 8 % monosaccharides and disaccharides on a dry weight basis) was added per bar – that is a total of 16 g of oligofructose on a daily basis. The 16-g dose was chosen based on a previous study, which suggested a positive impact on EI and appetite, and was well tolerated( Reference Cani, Joly and Horsmans 21 ). The Co-Bar group received a control chocolate chip, chewy granola bar without oligofructose. In the Co-Bar, oligofructose was substituted with sugars, mainly coming from high-maltose maize syrup, maize syrup and starch (from crisp rice). The amount of maltodextrin in the Co-Bar was 1·7 % (dwb) compared with 0 % (dwb) in the OF-Bar. The bars were cold-formed and not subjected to temperatures above 65 °C. The bars were packaged per portion in identical opaque packages to ensure the double-blind status of the study. Moreover, the bars were coded by an independent colleague and investigators, and participants did not know who received which type of bar. Compositions of both bars are presented in Table 1. The bars were kindly provided by Sensus, Roosendaal, The Netherlands.
Table 1 Weight and nutrient composition of the isoenergetic granola bars per bar (Mean values and standard deviations)
Co-Bar, control granola bar; OF-Bar, oligofructose granola bar; OF; oligofructose.
* Forty granola bars.
† Calculated as protein 17 kJ, carbohydrates 17 kJ, OF 6 kJ, fat 37 kJ.
‡ Calculated as protein 17 kJ (4 kcal), carbohydrates 17 kJ (4 kcal), OF 6·3 kJ (1·5 kcal), fat 37·7 (9 kcal).
§ Determined at the Division of Human Nutrition.
|| Determined at the Department of Food Chemistry. Calculated based on average degree of polymerisation=4.
During the 1st week, the participants ate one bar per day in order to prevent gastrointestinal discomfort caused by a sudden increase in dietary fibre consumption. The bars – including some spare ones – were provided to the participants for the upcoming period at the end of every meeting at the University. Subjects were instructed to bring leftovers back to University at the next meeting, so that we could count their compliance. Furthermore, participants were asked to write down the time at which they ate the bars in a daily journal.
Outcome variables
Body weight and body composition
Height was measured once during the screening visit; it was measured to the nearest mm, with the participant standing erect on bare feet and the head in the ‘Frankfurt plane’ using a wall-mounted stadiometer. Body weight was measured to the nearest 0·1 kg using calibrated electronic weighing scales (Seca 877 and Tanita®-scale attached to the BodPod; Life Measurement Inc.). Waist circumference was measured to the nearest 0·25 cm using a measuring tape at the mid-point between the ribs and the hips. At the test days (at baseline and after weeks 1, 3, 6, 9 and 12), participants were assessed on body weight and waist circumference in the fasting state, after relieving themselves, wearing the same swim suit at every visit.
At the test days (baseline, weeks 6 and 12), body composition was non-invasively determined using air-displacement plethysmography by using the BodPod device according to the manufacturer’s guidelines (Life Measurement Inc. of Cosmed). A two-step calibration was carried out before each measurement. All participants wore a tight-fitting swim suit and hat. Body weight was measured, and then two repeated body volume measurements were performed, averaged and corrected for the predicted body surface area (BSA) and predicted thoracic gas volume, to obtain the body density. To convert body density to percentage body fat, Brozek’s( Reference Brožek, Grande and Anderson 34 , Reference Fields, Goran and McCrory 35 ) two-compartment model was used. Fat-free mass was calculated as the difference between each participant’s body weight and body FM. Body density is dependent on body weight and body volume (body density=body weight/body volume). Body volume=raw volume+BSA artifact+0·4×Lung volume. BSA was calculated as BSA=71·84×BW0·425×height0·725. BSA artefact was as follows: BSA×k (a constant which is 4·67×10−5)( Reference Bosy-Westphal, Danielzik and Becker 36 ). Then, the Brozek’s equation, where % FM=(4·57/body density−4·142)×100, was used.
Food intake during the test day
To measure spontaneous 24-h food intake, all meals were served ad libitum during the test day. After the anthropometric measurements, participants received day-1 breakfast in buffet style at the University; subsequently, they received a bag with lunch and snacks, which they were allowed to eat as much they wanted at home or at work until dinner. These bags also contained the bars, which were mandatory (at baseline, all participants received two control bars). Between 17:00 and 18:00, a pasta meal was served in portions of 200 % of the amount they would eat according to their assumed EI according to the Harris–Benedict formula. For the evening, participants received a bag with snacks. The subsequent morning participants had the day-2 buffet breakfast at the University. Participants were asked not to eat or drink something outside the provided foods, except for coffee, tea and water (without sugar or milk). The food items, which participants could choose, were foods Dutch people habitually eat. For a complete list of all foods, see the online Supplementary Appendix A. Food was offered in excess to minimise external food intake cues. Food intake was calculated by weighing all food and drinks before serving and weighing leftovers. Energy and macronutrient intake was estimated using the Dutch Food Composition Database.
Subjective appetite during the test day
Subjective hunger, fullness, prospective food consumption, desire to eat and thirst were registered every hour on eleven-point scales with an anchor on the left side ‘not at all’ and on the right side ‘very much’( Reference Wanders, Mars and Borgonjen-van den Berg 37 ). Participants completed these questionnaires before they ate breakfast, then after breakfast and then every hour that participants were awake. In addition, before and after lunch and before and after dinner participants completed these questionnaires. The questionnaire was provided in the form of a booklet for each test day. For the analysis, the mean values of the appetite parameters and the mean time were divided to calculate weighted hunger, fullness, desire to eat, prospective food consumption and thirst.
Weekly appetite questionnaires, liking of the bar and tolerance
Every week participants completed 100-mm visual analogue scale (VAS) questionnaires during which they reflected on their appetite feelings of the last week. In addition, liking of the bars and tolerance, that is bloating, regurgitation, flatulence, nausea and looser stools, were measured by 100 mm VAS, anchored with “not at all” (0 mm) to “very much” (100 mm).
Statistical analyses
Results are expressed as means and standard deviations, unless stated otherwise. Variables were visually checked for normal distribution; all data were normally distributed. Baseline differences between intervention groups were tested by means of an unpaired Student’s t test. Data were analysed by means of repeated mixed-model ANOVA (PROC MIXED). Best fitted covariance structures were used per model. Models included treatment, time and treatment×time interaction. Post hoc tests were performed with least significant difference test. The level of significance was set at P<0·05. All data were analysed using SAS 9.3 (SAS Institute).
Unblinding of the trial occurred in two steps. Study investigators performed the primary analyses while being blind to the treatments, which means that they knew which participants were in a group together. After these analyses the treatments were fully unblinded.
Results
Subjects
A total of sixty-two suitable and willing participants were enrolled in the study, among whom forty-eight started in September and forty-eight in November 2013. Finally, fifty-five completed the total study (OF-Bar: n 29, Co-Bar: n 26). Characteristics of fifty-five participants whose data were analysed are presented in Table 2. In total, three participants in the OF-Bar group and four participants in the Co-Bar group dropped out. There were no significant differences between the groups in any of the baseline characteristics. During the study the level of physical activity did not differ between both groups (Co-Bar baseline: 1·56 (sd 0·21); week 12: 1·51 (sd 0·22); and OF-Bar baseline: 1·60 (sd 0·18); week 12: 1·56 (sd 0·21) physical activity level). Counting the returned bars showed that on average 98 % of the 162 bars that needed to be eaten were eaten and all subjects reported that they consumed over 90 % of the bars during the intervention period. Eventually, to the question ‘which bar do you think you had?’, 30·9 and 12·7 % of the subjects for the control bar and oligofructose bar, respectively, were correct in their answer; 30·9 % received the oligofructose bar and thought to be in the Co-Bar group; 21·8 % received the control bar and thought to be in the OF-Bar group; and 3·6 % had no idea, while they were in the Co-Bar group.
Table 2 Baseline characteristics of study participants (Mean values and standard deviations)
Co-Bar, control group; OF-Bar, oligofructose group; EI, energy intake.
* Independent samples t test showed no statistical significant difference between groups.
† Measured by BodPod (Life Measurement Inc. of Cosmed).
‡ Calculated from a 24-h physical activity recorded in the diary( 32 , Reference Ainsworth, Haskell and Herrmann 33 ).
§ Habitual intake estimated by means of a FFQ completed before the start of the study.
|| Measured with the Dutch Eating Behaviour Questionnaire( Reference van Strien, Frijters and Bergers 31 ), scores 1–5, 1 is low restrained and 5 is high restrained.
Body weight and body composition
OF-Bar consumption did not result in beneficial changes in body weight change and body composition compared with the Co-Bar (all time×treatment effects; P>0·05 (Table 3)). Over time, body weight did not change in both groups, whereas waist circumference decreased (time effect: P<0·0001). Body composition measured by air-displacement plethysmography showed that percentage (P=0·03) and absolute lean body mass (P=0·001) decreased in both groups. Percentage FM increased in both groups (P=0·03), whereas absolute FM did not change (P=0·17).
Table 3 Body weight, waist circumference and body composition during the study (Mean values and standard deviations)
Co-Bar, control granola bar; OF-Bar, oligofructose granola bar.
a,b Mean values with unlike superscript letters were significantly different (P<0·05).
Food intake during the test day
Food intake was not different at baseline, except for the baseline values of the day-2 breakfast, which were significantly lower for the OF-Bar group (Co-Bar: 2·0 (sd 0·7) MJ v. OF-Bar: 1·6 (sd 0·4) MJ; P=0·01). The addition of oligofructose did not significantly affect total EI. At baseline, EI was 9882 (sd 2541) and 9334 (sd 1983) kJ with the Co-Bar and OF-Bar group, respectively. After 6 weeks, EI increased in the Co-Bar group to 10 089 (sd 2902) kJ and reduced in the OF-Bar group to 8965 (sd 2252) kJ (time×treatment P=0·41). There were no significant differences for any meal or snack moment (Table 4). The day-1 breakfast showed a significant increase in EI over time for both groups (P=0·03) (Table 4). EI at lunch did not change. At dinner, EI showed a downward trend over time for both groups (P=0·07). In both groups, the evening snack intake tended to decrease at week 6 (−0·1MJ; NS), but significantly increased in week 12 compared with week 6 (+0·2MJ; P=0·01).
Table 4 Dietary energy intake on an ad libitum test day (Mean values and standard deviations)
Co-Bar, control granola bar; OF-Bar, oligofructose granola bar, EI, energy intake.
a,b Mean values with unlike superscript letters were significantly different (P<0·05).
Subjective appetite during the test day
At baseline, both groups were not different from each other for the five scales for weighted average appetite/satiety outcomes (all P>0·05). We found no significant effect of oligofructose supplementation on the weighted average values for hunger, fullness, prospective consumption, desire to eat or thirst (Table 5). Only hunger tended to be lower in the OF-Bar group at baseline (−0·4; P=0·09).
Table 5 Weighted average score of appetite during the test day (Mean values and standard deviations)
Co-Bar, control granola bar; OF-Bar, oligofructose granola bar.
Weekly appetite questionnaires
Weekly hunger, fullness, desire to eat, prospective food consumption and thirst ratings were not significantly different at baseline for the OF-Bar and Co-Bar group. As shown in Fig. 2, participants of the OF-Bar group reported to have significantly less overall hunger and thirst (time × treatment P=0·044 respectively P=0·003) compared with the Co-Bar group. Moreover, ratings for prospective consumption were lower for the OF-Bar group compared with the Co-Bar group (time×treatment P=0·03). A trend was seen that participants consuming oligofructose tended to have a lower desire to eat compared with the Co-Bar group (time×treatment P=0·097). There was no difference in fullness (time×treatment P=0·23).

Fig. 2 Effects of oligofructose bars (OF-Bar; 8 g oligofructose twice daily) or control bars (Co-Bar) as replacement for a morning and mid-day snack for 12 weeks on feelings of hunger (a), fullness (b), desire to eat (c), prospective food consumption (d) and thirst (e) measured weekly on a visual analogue scale (VAS). Baseline values are not different. Values are means with their standard errors. * Mean value OF-Bar was significantly different from control at the same week (P<0·05). † Mean value was significantly different from that at baseline (week 0) for the same group (P<0·05).
Liking of the bars and tolerance
At baseline, everybody received the control bar, so they rated the control bar for liking at baseline.
Fig. 3 shows that the liking of the oligofructose bar is quickly reduced compared with the control bar (P=0·03). Moreover, this figure also shows a decline in liking of both bars (P=0·02).
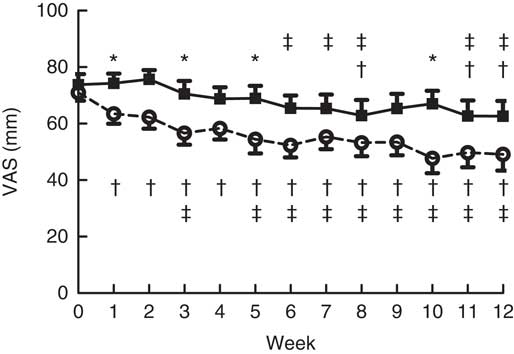
Fig. 3 Liking of the bars during the intervention. Main effects: treatment (Tr), P=0·03; time (Ti), P=0·02; Tr×Ti, P=0·03. Values are means with their standard errors. ![]() , Control granola bar (Co-Bar);
, Control granola bar (Co-Bar); ![]() , oligofructose granola bar (OF-Bar); VAS, visual analogue scale. * Mean value was significantly different from OF-Bar at the same week (P<0·05). The mean difference between treatments was 12 mm. † Mean value was significantly different from that at baseline (week 0) for the same group (P<0·05). ‡ Mean value was significantly different from that at week 1 for the same group (P<0·05).
, oligofructose granola bar (OF-Bar); VAS, visual analogue scale. * Mean value was significantly different from OF-Bar at the same week (P<0·05). The mean difference between treatments was 12 mm. † Mean value was significantly different from that at baseline (week 0) for the same group (P<0·05). ‡ Mean value was significantly different from that at week 1 for the same group (P<0·05).
Flatulence, bloating, looser stools, regurgitation and nausea were not significantly different at baseline for the OF-Bar and Co-Bar groups. In the first 2 weeks, the OF-Bar group perceived significantly more flatulence and bloating than at baseline. Notably from week 7, both groups noted no differences for tolerance scores between the Co-Bar and OF-Bar (Fig. 4).
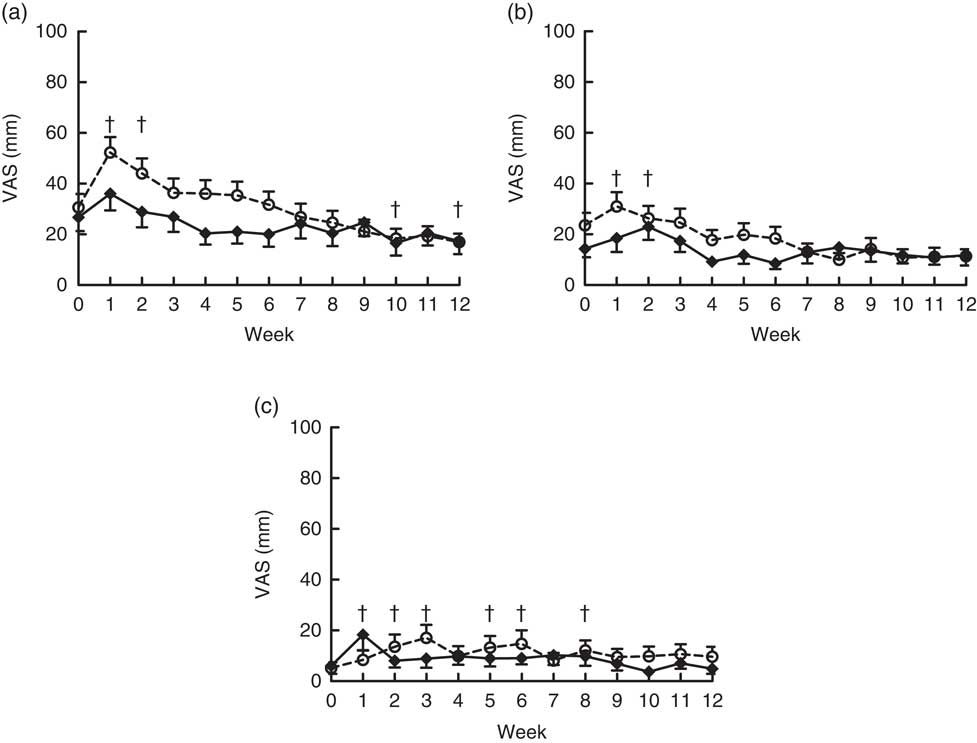
Fig. 4 Effects of oligofructose bars (OF-Bar; 8 g oligofructose per bar, twice daily) or control bars (Co-Bar) as replacement for a morning and mid-day snack for 12 weeks on feelings of flatulence (a), bloating (b) and looser stools (c) measured weekly on a visual analogue scale (VAS). Regurgitation and nausea were also measured, but these were low and not significantly different. Values are means with their standard errors. † Mean value week was significantly different from that at baseline (P<0·05). (a) Main effects: treatment (Tr), P=0·15; time (Ti), P≤0·0001; Tr×Ti, P=0·22. Week 1 was significantly different compared with all other weeks (P<0·05). (b) Main effects: treatment (Tr), P=0·20; time (Ti), P=0·01; Tr×Ti, P=0·29. (c) Main effects: treatment (Tr), P=0·53; time (Ti), P=0·045; Tr×Ti, P=0·08.
Discussion
The results showed that 12-week replacement of snacks twice a day with granola bars enriched with 8 g of oligofructose had no significant impact on weight management outcome measures, such as body weight, body composition, EI and acute appetite in a group of overweight or obese adults. However, weekly appetite feelings seemed to be lower in the OF-Bar group compared with the Co-Bar group.
The results of the present study on body weight are in contrast to the findings of other long-term randomised controlled trials. In the present study, the non-significant difference in body weight was +0·4 and −0·2 kg for the Co-Bar and OF-Bar group, respectively, after 12 weeks. In comparison, another study using 21 g/d oligofructose reported a significant change in body weight of +0·5 and −1·0 kg in the control group and the oligofructose group after 12 weeks of supplementation( Reference Parnell and Reimer 28 ). On the other hand, another study with a higher dose of 30 g/d oligofructose did not affect body weight in overweight and obese subjects following 8 weeks of supplementation( Reference Daud, Ismail and Thomas 29 ). However, when inulin was supplemented as 30 g/d during and after an active weight loss phase, body weight and FM were significantly reduced( Reference Guess, Dornhorst and Oliver 30 ). The instruction in the present study was only to replace a snack, so not to actively lose weight, which may have diminished the effect on body weight reduction.
Despite the instruction to replace a snack that one typically consumes with the snack bar (comparable in energy with the bar) in the morning and in the afternoon, maybe the subjects were not able to replace their daily snack as instructed. If subjects were not able to adequately replace their snacks during these 12 weeks, they could gain approximately 2 kg by eating the bars on top of their diet. As these subjects already were overweight, substantial weight gain has to be avoided during the study. Therefore, subjects whose weight increased during the first 3 weeks were phoned by the dietitian in order to help them find a suitable snack from their regular diet that could be replaced with the bar. Of the fifteen subjects that our dietitian called, nine were in the OF-Bar group and six in the Co-Bar group. In case subjects still gained weight after 6 weeks, they were omitted from the study; this occurred with three subjects (one subject in the OF-Bar group and two subjects in the Co-Bar group).
The non-significant changes in body weight, body composition and EI may have been influenced by the relatively small sample size or insufficient power to detect slight differences between treatments. Our sample size estimation was based on a study using a higher dose of oligofructose for which we did not correct( Reference Cani, Joly and Horsmans 21 ). However, a similar study of Guess et al. ( Reference Guess, Dornhorst and Oliver 30 ) with only thirty-nine subjects did find positive results consuming 30 g/d inulin in the weight maintenance phase. The effect we found on body composition over time – that is decrease of lean body mass, waist circumference and an increase of percentage of FM – was similar in both intervention groups. The reduction of lean body mass, as this is mainly muscle mass, could have been caused by a decreased level of physical activity during the end of the calendar year( Reference Tucker and Gilliland 38 ). However, no large changes in physical activity levels were reported during the intervention. Presumably, the measurement days were not reflecting an average day of the intervention period. Another cause for the reduction of lean body mass may be an alteration in diet composition; however, we did not assess diet composition.
During the intervention, we asked subjects to report their satiety feelings in two different ways. First, we asked them to fill out a satiety questionnaire during the test days; i.e. they rated their appetite every hour that they were awake with five different parameters. Second, every week subjects reported their satiety feelings of the last week in the study diary on similar parameters. Hunger scores during the test days tended to be lower in the OF-Bar group. However, the other parameters did not show such an effect. On the other hand, data from the weekly questionnaire substantiated these data; the OF-Bar group reported lower hunger, lower desire to eat and lower prospective consumption. Therefore, it might be that consuming additional oligofructose affected satiety feelings, but that filling out appetite ratings every hour is not an appropriate measure for this specific group of subjects. Weekly ratings filled out at home might give possibly more valid answers. This hypothesis is supported by the satiety feelings reported in week 6, which show deviating results compared with the overall pattern of ratings during the 12 weeks of intervention. We speculate that coming to the research centre has an effect on these outcomes, which is visible in weekly hunger, prospective consumption, desire to eat and thirst. For the measurements during the test days, we used the Likert scales, which are less sensitive compared with a VAS. In addition, every participant had different timings of food consumption and could eat ad libitum, which could have affected the sensitivity of the hourly appetite questionnaire, because subjects were full after each eating occasion.
Similar to some other studies( Reference Pedersen, Lefevre and Peters 23 , Reference Daud, Ismail and Thomas 29 ), we did not find an effect on daily EI. The average EI of the subjects on the test days was relatively low, although with a large variation. During the intervention, subjects ate on average 9·6 MJ, which is about 81 % of the energy needs that we estimated in the beginning of the intervention (11·8 MJ). Although this group was not very physically active, as indicated by their low physical activity score of 1·5–1·6, this intake is very low. Considering their stable body weight, this may not reflect their normal intake. Otherwise, overweight and obese adults may have consumed less owing to socially desirable behaviour, as they know their eating behaviour was being observed( Reference Bel-Serrat, Julián-Almárcegui and González-Gross 39 ). We measured EI with an ad libitum method, as described in previous studies( Reference Wanders, Mars and Borgonjen-van den Berg 37 , Reference Winkels, Jolink-Stoppelenburg and de Graaf 40 ), as it is well known that overweight subjects tend to underreport their intake by means of diaries( Reference Goris, Westerterp-Plantenga and Westerterp 41 , Reference Poslusna, Ruprich and de Vries 42 ). We observed that subjects tended to eat more breakfast and evening snacks, and less dinner over time. This might indicate that they got bored with the dinner and compensated this with their evening snacks and breakfast. We observed a small mean decline in EI of 369 (sd 1490) kJ (−4·0 %) in the OF-Bar group during the first 6 weeks and an increase in EI of 207 (sd 1490) kJ (2·1 %) in the Co-Bar group. Nevertheless, this was accompanied by a large variation between subjects and did not reach statistical significance (treatment×time: P=0·41). Other studies found only a significant reduction of EI half-way during the studies (after 6–9 weeks of supplementation), but not at the end of the study (after 12–18 weeks of supplementation) for the oligofructose group compared with the control measured by a 3-d food record or an ad libitum meal( Reference Parnell and Reimer 28 , Reference Guess, Dornhorst and Oliver 30 ). One can speculate that the microbiota composition may be changing upon initial intervention and play a role in this reduced EI, but this effect does not persist after a longer period (7–12 weeks) of supplementation. At baseline, subjects filled out a FFQ, which was designed to quantify fibre intake( Reference Wanders, Mars and Borgonjen-van den Berg 37 ). The subjects reported a relatively normal fibre intake of 22 g/d, which may render them possibly less responsive to fibre supplementation. However, we did not select on fibre intake, which makes this group a normal population for this efficacy study. Their intake was marginally lower than the recommended daily intake of fibre (for adults: 25–30 g/d( 43 , 44 )), but is somewhat higher compared with the mean intake of the average Dutch population, which is 20 g/d( 45 ).
As expected, subjects reported significantly more flatulence in the 1st weeks of the study, indicating colonic fermentation of oligofructose, which was also reported for other studies( Reference Guess, Dornhorst and Oliver 30 , Reference Dahl, Wright and Specht 46 ). Interestingly, the level of flatulence became similar returning to baseline in both groups after about 7 weeks, suggesting an adaptation to the oligofructose( Reference Kolida, Meyer and Gibson 47 ). However, this adaptation was not recognised in another study( Reference Dahl, Wright and Specht 46 ). Despite this side effect, subjects were not aware of their treatment group; approximately 50 % guessed correctly in which treatment group they were, which we assume is a matter of chance.
Major strengths of this study are the high compliance to the intervention, the realistic dosage of oligofructose and the matrix of supplementation. All participants reported to have consumed over 90 % of the bars during the intervention period with an average compliance of 98 %. Oligofructose was added at a relatively high, but realistic, level of 16 g/d. Moreover, it was supplemented by means of a granola bar; this is in contrast to other studies in which fibres were supplemented by means of a powder in sachets dissolved in a drink( Reference Cani, Joly and Horsmans 21 – Reference Pedersen, Lefevre and Peters 23 , Reference Parnell and Reimer 28 – Reference Guess, Dornhorst and Oliver 30 , Reference Liber and Szajewska 48 ). In real life, it is more ecologically valid to supplement a commonly eaten food, which does not need preparation and participants can easily bring it with them, such as a granola bar.
A limitation of the present study was that subjects had only one choice of snacks for 12 weeks, and during the intervention liking of the bars decreased significantly. There is a risk that the subjects could have eaten other snacks to compensate for the boredom owing to the same flavour and texture of the bar, and consequently did not lose weight. Although the initial (non-significant) increase in flatulence and bloating, as well as effect on stool consistency, indicates that fermentation in the colon was occurring in the OF-Bar group, future studies should include serum and stool samples to measure levels of satiety hormones, SCFA or changes in microbiota composition to speculate about possible biological mechanisms.
Overall, it can be concluded that an intervention of 12-week replacement of daily snacks twice a day with an oligofructose-enriched granola bar does not have a significant effect on weight management outcomes when compared with replacement of daily snacks with normal granola bars. However, it seemed that satiety feelings were increased in subjects replacing their snacks for oligofructose-containing granola bars. This trial gives further insight in the use of oligofructose supplementation in weight management.
Acknowledgements
The authors would like to thank all volunteers who participated in this study. The authors further thank Henriette Fick, Desiree Lucassen, Corine Peerenboom and Nhien Ly from the division of Human Nutrition, and Melliana Jonathan from the department of Food Chemistry for their assistance with the data collection and chemical analyses.
This research was supported by Sensus BV, Roosendaal.
The authors’ responsibilities were as follows: K. P. collected the data, analysed the data and wrote the manuscript; C. d. G. contributed to the design of the experiment, provided consultation and advice throughout the whole project and approved the manuscript; D. M. was involved in designing the study and writing of the protocol; M. M. designed the experiments, supervised the data collection and analyses, provided consultation and advice throughout the whole project and gave significant input to the manuscript. All authors read and approved the final version of the manuscript.
At the time of execution of the study, D. M. was an employee of Sensus BV. C. d. G. is a member of the scientific advisory board of Sensus BV. K. P. and M. M. declare that they have no conflicts of interest.
Supplementary material
For supplementary material/s referred to in this article, please visit https://doi.org/10.1017/S0007114518000211


