

According to the USDA there were 309,365 acres of cut Christmas tree production in 2012, with acreage down 10 percent from 2007. However, the number of harvested trees was only down 1 percent to 17,319,060 in 2012 (USDA Table 35). Counting domestic and import sales, there are around 25–30 million Christmas trees sold every year, with a retail value in 2014 of around $1.04 billion for real trees alone (National Christmas Tree Association 2014). Even with the large number of Christmas trees sold each year, there are particular consumer segments with a higher likelihood of purchasing a tree, notably Christians, households with children, and consumers who spend Christmas at home. Furthermore, consumers who are Caucasian, younger, have a higher income, and live in a single-family dwelling are more likely to have a real tree (Hamlett et al. Reference Hamlett, Herrmann, Warland and Zhao1989). More recent studies have validated that younger consumers are more likely to purchase a real tree compared to older consumers most likely due to the perceived extra cleanup associated with a real tree by older consumers (Florkowski and Lindstrom Reference Florkowski and Lindstrom1995, Behe et al. Reference Behe, Walden, Duck, Cregg and Kelley2005, Bauerlein Reference Bauerlein2011).
Given the number of Christmas trees sold and the retail value associated with those sales every year, it is essential to understand and provide information to tree producers to help facilitate good decision-making at the outset of production. For instance, it takes an average of seven years for a Christmas tree to reach the typical six- to seven-foot height consumers desire (National Christmas Tree Association 2014). Thereby, a producer must forecast out half a decade or more as to what tree species will be desirable, anticipated height needed, which retail outlets to target, and estimated price needed to remain profitable. Adding to the complexity of the market are artificial trees, which have seen an 18 percent increase in purchases from 2008 to 2014 (National Christmas Tree Association 2014). As noted by Davis and Wohlgenant (Reference Davis and Wohlgenant1993), artificial and real trees are substitutes, with a 1-percent increase in artificial tree price, resulting in an 11.8 percent increase in the quantity demanded for real trees.
Understanding the value of attributes that influence a consumer's decision to purchase a real Christmas tree is essential to providing actionable recommendations to producers and other stakeholders. As noted by Davis (Reference Davis1993), consumers with knowledge of tree species valued height, branch spacing, and color, and had a negative value of needle length, while consumers who were not knowledgeable valued only color. Outside of the Davis (Reference Davis1993) paper there has been little work examining consumer valuation of real Christmas tree attributes (not including tabletop trees). In order to provide information to producers and retailers as well as to fill this gap in the literature, we used a choice experiment with latent class modeling to value various attributes to better understand the drivers of purchase for real Christmas trees. Of particular interest, we examined the value of retail outlets and the potential impact local labeling (i.e., grown in Connecticut [CT]) might have on preference and willingness-to-pay (WTP). Local labeling of food products has been thoroughly examined, but little effort has focused on the value of local labeling on nonfood products, in particular for plants and trees. Our main hypothesis was that local labeled trees at choose-your-own and nursery/greenhouse retail outlets would receive a premium compared to locally labeled trees sold in home improvement centers across latent classes. Furthermore, we hypothesized that CT trees would be valued more than trees imported from outside of CT.
Materials and Methods
In the fall, during the first two weeks of October 2012, we initiated an online survey of CT consumers to value key attributes of Christmas trees. CT was chosen for a variety of reasons, notably due to the funding source for this project. However, CT provides an interesting case study, given the rise in Christmas tree production from 2007–2012. CT had 5,389 acres in production during 2012, up from the 3,887 acres in production in 2007. Furthermore, CT ranked in the top ten states, with 159,091 trees cut in 2012, up 40 percent from 2007 (USDA-National Agricultural Statistical Service 2012). Based on these statistics, it is clear that CT Christmas tree production is trending upward, so understanding how local labeling might influence tree sales is essential.
Survey respondents were obtained from the database of Global Market Insight, Inc. (GMI). Panelists from the GMI database were emailed an invitation to participate in the survey, with those agreeing to participate being directed to the survey. The survey instruments for this study were evaluated and approved by the University of Connecticut Internal Review Board. The online survey had an 80 percent response rate and produced 640 completed responses.
Respondents to the survey not only answered a choice experiment about Christmas trees but also answered demographic questions such as household income, age, number of children and adults in household, education level, race, gender, and zip code. Table 1 presents some basic demographic and behavior characteristics of the sample. Optimally, we could test whether our sample demographics were different from the CT population. However, standard errors are not provided for census estimates, meaning significance testing is not feasible. We do provide discussion below to get a better understanding of the potential differences. As can be seen in Table 1, our sample respondents were 89 percent Caucasian, which is slightly greater than the 82 percent reported in the census for CT. Further, the median income for the sample was $95,000. For comparison, the CT population median income was $69,461 (U.S. Census Bureau 2015). The difference in income is worth mentioning, as it may affect the generalizability of the results outside the sample. However, given that the goal of the paper is to generalize to both buyers and potential buyers of Christmas trees, the impact of the higher income is less than if we were trying to generalize to the general CT population because people with higher incomes are more likely to purchase trees (Hamlett et al. Reference Hamlett, Herrmann, Warland and Zhao1989). As for age, the sample median age is 51, which is 11 years older than the median CT age of 40 years (U.S. Census Bureau 2011). However, the census estimate of 40 years is slightly misleading when compared to our sample's age, because the census estimate includes minors (residents less than 18 years of age). Given that 22 percent of the CT population are 18 years old or younger (U.S. Census Bureau 2015), the median age of residents who would qualify to take our survey is most likely in line with the age of our sample.
Table 1. Descriptive statistics for key demographic and behavior variables.
a Experience = 1 implies a respondent purchased a Christmas tree at least once during the past two years.
b Data source: United States Census Bureau (2016).
c Data source: United States Census Bureau (2011).
In constructing the choice design, the first step was to determine potential drivers of purchase for real Christmas trees. Using previous literature in conjunction with experts at the CT Department of Agriculture, several attributes were identified as being important in the decision process, notably price, retail location, tree species, and height (Table 2). The price range ($20 to $75) was determined by surveying several producers in CT in conjunction with past prices obtained from the CT Department of Agriculture.
Table 2. Attributes (and levels) included in the choice experiment.
In order to capture the effects of various retail outlets and local labeling on the purchasing decision for Christmas trees, we used a number of options that integrated retail outlet and origin label. For the nursery/greenhouse outlet we labeled trees as grown in CT because the majority of trees at these outlets were from CT. Cut-your-own trees were also labeled as grown in CT because the trees were cut by consumers in the field. However, for trees sold via home improvement centers there is potential for an array of tree origins. Home improvement center trees were labeled as grown in CT, Oregon, Pennsylvania, or Canada. Oregon was chosen because it is the largest-producing Christmas tree state (by both acres and trees cut), while Pennsylvania was the largest-producing state in the Northeast (acres and trees cut) in 2012 (USDA Table 35). Canada was included, given that it is a net exporter of Christmas trees, with almost half of the fresh-cut trees exported in 2014 going to the United States (Statistics Canada 2015).
The tree origin and retail outlet attributes are combined, because keeping these attributes separate implies that they are independent from each other. However, this is not the case, given that some options are not independent, thereby creating options that are not feasible in the marketplace. Notably, a choose-and-cut-your-own tree at a CT farm cannot be produced at another location. In order to value local we can we can get WTP for local by comparing home improvement/grown in CT to the other home improvement product origin attribute levels, such as home improvement/grown in Oregon or home improvement/grown in Canada. This WTP is conditional on store location (i.e., home improvement center), but it allows for a value of local to be ascertained. With respect to the value of retail outlet, the WTP for trees at each location can be found by comparing retail outlets with trees grown in CT. Again, this creates a retail value conditional on the tree being grown in CT, but it provides important information as to the value of a local tree across retail outlets.
With respect to tree species, we used White Spruce, Scotch Pine, Frasier Fir, and Douglas Fir. These species represent the most common tree species purchased during Christmas (i.e., Douglas Fir and Scotch Pine), as well other trees that are a little less common (i.e., White Spruce and Frasier Fir) but still frequently used (National Christmas Tree Association, 2016). As noted by Davis (Reference Davis1993), Fir trees attract a price premium compared to Spruce trees, while Spruce trees generate a premium compared to Pine trees. Potential preference/premiums for the tree types are most likely due to their distinct characteristics. According to the National Christmas Tree Association (2016), the Douglas Fir is dark green to blue green with softer, longer needles (compared to other trees in this study), while the Scotch Pine are bright green and have good needle retention and good survivability throughout the holiday season. The White Spruce is a bluish-green to green color, excellent for ornaments, and has a good natural shape. Frasier Firs have upward-turned branches with good needle retention and are dark blue-green, with a pleasant scent.
In designing the final number of choice sets for each product, we utilized the D-efficiency criterion (Kuhfeld Reference Kuhfeld2010). By optimizing the D-efficiency criterion, which compares design efficiency with an orthogonal balanced design, we determined the final design to be used in the experiment (Kuhfeld Reference Kuhfeld2010). The final number of choice sets was eight, with each set including three product profiles plus a “none” option. The choice sets and choices within each set were randomized to minimize bias. Figure 1 is an example of a choice set presented to respondents.
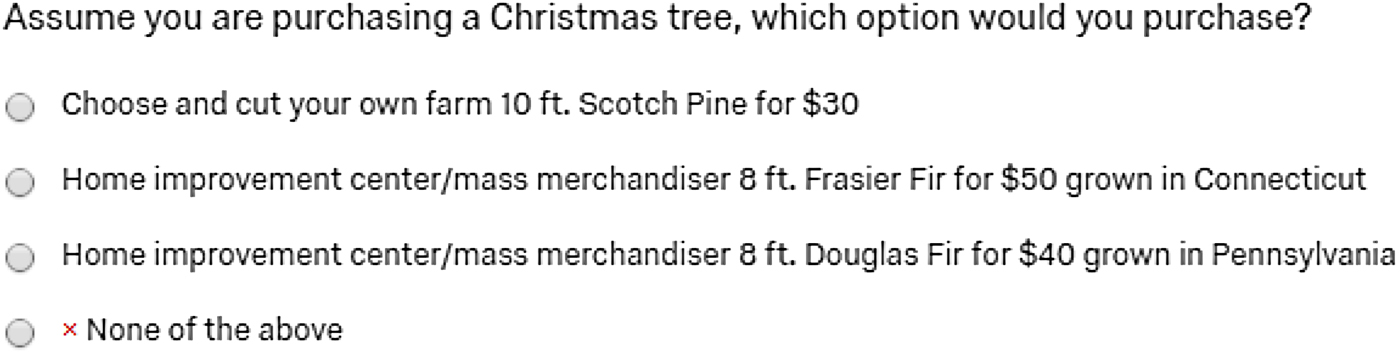
Figure 1. Example of a choice set presented to survey respondents.
Given the multinomial nature of the data, we initially used a multinomial logit model (MNL) to assess consumer preference for the attributes included in the choice experiment. However, an MNL does not account for potential taste and preference differences across consumers. Given that consumers are most likely heterogeneous across tastes and preferences (Wedel and Kamakura Reference Wedel and Kamakura2000), the MNL model may be inadequate to deal with the heterogenous nature of consumers. To account for the unobserved heterogeneity, we used a latent class model (LCM) (Wedel and Kamakura Reference Wedel and Kamakura2000, Boxall and Adamowicz Reference Boxall and Adamowicz2002, Greene and Hensher Reference Greene and Hensher2003, Kafle, Swallow, and Smith Reference Kafle, Swallow and Smith2014). LCM is a semiparametric extension of the MNL model and similar to the mixed logit model commonly used for discrete choice analysis (Greene and Hensher Reference Greene and Hensher2003). However, the LCM relaxes the mixed logit model requirement that specific assumptions must be made about the distribution of parameters across individuals (Green and Hensher Reference Greene and Hensher2003). The final number of latent classes to be included in the model was chosen by finding the model with the lowest Bayesian Information Criteria (BIC), given a varying number of latent classes (MNL for 1 latent class and LCM for 2–5 latent classes). The lowest BIC was achieved using three latent classes.
The LCM model can be viewed in the following context. The indirect utility for a consumer i corresponds to segment s when choosing product j such that
 $$U_{ij \vert s} = X_j\beta _s + \varepsilon _{ij}$$
where X j is a vector of product attributes j. β s is a vector of class-specific taste parameters, and ε ij is the error term that follows an i.i.d Type I extreme value distribution. The LCM estimates the unconditional probability that consumer i can be attributed to class s based on socio-demographic characteristics, as noted in equation two.
 $$Prob_{is} = \displaystyle{{\exp \lpar {\theta _sZ_i} \rpar} \over {\mathop \sum \nolimits_s \exp \lpar {\theta _sZ_i} \rpar}}$$
where Z i is a set of socio-demographic characteristics for consumer i, and θ s is a vector of parameters that determine the class membership probability. After matching an individual with their likely class, conditional on belonging to class s, probability that individual i chooses product j is given by:
 $$Prob_{ij \vert s} = \displaystyle{{\exp \lpar {\mu _sX_j\beta _s} \rpar} \over {\mathop \sum \nolimits_j \exp \lpar {\mu _sX_j\beta _s} \rpar}}$$
where μ s is the scale parameter for a class s and is normalized to 1. Therefore, the joint probability that consumer i in class s choosing product j can be expressed as:
 $$Prob_{ijs} = Prob_{ij \vert s}\;{\ast}\;Prob_{is} = \displaystyle{{\exp \lpar {\mu _sX_j\beta _s} \rpar} \over {\mathop \sum \nolimits_j \exp \lpar {\mu _sX_j\beta _s} \rpar}}\;{\ast}\;\displaystyle{{\exp \lpar {\theta _sZ_i} \rpar} \over {\mathop \sum \nolimits_s \exp \lpar {\theta _sZ_i} \rpar}}$$
Using the utility parameters from the LCM, the WTP values for each attribute can be calculated as
 $${\rm WTP}_{\rm j} = - \left({\displaystyle{{\beta _j} \over {\beta _p}}} \right)$$
where β is the estimated coefficient for each attribute level j, and p is the price attribute. Confidence intervals for the WTP estimates were calculated via the Delta Method.
Results and Discussion
Table 3 includes the results of the LCM analysis. Of interest, we see that the price coefficients for each latent class are significant and negative, implying that as price increases, consumers are less likely to choose a product. This finding is consistent with economic theory that consumers have a downward sloping demand curve. Furthermore, the price coefficient for latent class two is much higher than for classes one or three, which indicates that class two is more price sensitive than the other classes.
Table 3. Latent class model results for Christmas trees.
BIC values for varying latent classes: 1 = 5152.0, 2 = 2819.9, 3 = 2800.1, 4 = 2807.3, and 5 = 2836.4.
Latent Class 1
Latent class one has the most significant attributes compared to the other classes. Notably we see that consumers in this class were more likely to prefer a smaller tree as noted by the −0.163 coefficient associated with tree height. However, we see that only Scotch Pine was significantly less preferred than the Douglas Fir. The other tree species were preferred equally to the Douglas Fir.
By comparing the home improvement center outlet across origin label we can determine how consumers value CT-grown trees. For class one, we find CT trees were preferred compared to imported trees (i.e., Oregon = −0.880, Canada = −0.513, Pennsylvania = −0.626 vs. base = home improvement grown in CT). This partially validates one of our hypotheses that consumers would value a CT-labeled tree. Given that the ‘buy local’ movement has been primarily focused on food, this result indicates that the ‘buy local’ movement can affect decision making for nonfood items as well. As noted by Onozaka, Nurse, and McFadden (Reference Onozaka, Nurse and McFadden2010), supporting the local economy, farmers receiving fair returns, and maintaining local farmland are some of the most important factors when choosing local produce. These characteristics can easily be applied to nonfood products as well, which may lead to the perception that purchasing a CT-grown tree supports the local community and provides fair returns to farmers.
Many nursery/greenhouse operations in CT and throughout the United States have struggled due to the recession (Bischoff Reference Bischoff2014). Some nursery/greenhouse operations have investigated offering new types of products, such as Christmas trees, in order to offer a broader product selection and compete with home improvement centers. By comparing CT-grown trees offered at a home improvement center, nursery/greenhouse, and choose-your-own outlet we can determine whether differences exist between varying retail outlets. As can be seen in Table 3, consumers in class one prefer nursery/greenhouse trees and choose-and-cut outlets more than a home improvement center (i.e., nursery/greenhouse CT-grown = 0.677, choose-and-cut CT-grown = 0.803 vs. base = home improvement grown in CT). On the surface this finding provides evidence that nursery/greenhouse operations may be able to gain extra revenue by offering Christmas trees during the holiday season.
Age and income have been shown to be key indicators of whether a consumer will purchase a tree (Hamlett et al. Reference Hamlett, Herrmann, Warland and Zhao1989). With respect to our analysis, we find that older consumers were less likely to be in class one compared to class three. Furthermore, we find that having experience buying a tree (i.e., having purchased a real tree at least once during the past two years) has a negative impact on being in class one. Taking the results that nursery/greenhouse trees are preferred over home improvement center trees, and that people in class one are more likely to be inexperienced tree buyers, nursery/greenhouse operators who sell trees need to find ways to turn inexperienced buyers into buyers. This may entail direct communication with potential buyers or other means to address concerns about purchasing a real tree.
Latent Class 2
Latent class two is by far the smallest class, with a share of 19.2 percent of consumers (Table 3). Similar to class one, tree height is a primary determinant of purchasing a real tree for class two. The height coefficient is negative (−0.827), implying that these consumers are averse to a tall tree. Furthermore, we find that tree species is not that important. This result seems to indicate that the tree selection process with respect to the specific type of tree purchased may be a point-of-sale decision, such that consumers have no real preference for tree species.
However, class two has unique preferences regarding local labeling that do not align with a priori expectations. In particular, class two does not prefer CT-grown trees to imported trees, conditional on sales taking place at a home improvement center. Even given the small share associated with this class, results indicate that firms may not be able to rely simply on a grown-in-CT label to facilitate tree sales. Furthermore, we find that consumers in this class did not have a preferential view of purchasing a CT-grown tree at a nursery/greenhouse or choose-and-cut outlet compared to a home improvement center. Based on this finding, it is clear that non-home improvement center outlets may need to work harder to bring this class to their business, given that there is no preferential view toward these outlets.
Latent Class 3
Latent class three is similar to class one, except class three tends to have stronger preferences, as noted by the larger coefficients, across many of the attributes. As with the other classes, height is an important driver of preference with smaller trees preferred to taller trees. Similar to the other classes, we see no significance across tree species. However, in contrast to class one, class three does not prefer CT trees over Pennsylvania trees, but it does prefer CT over Oregon and Canada trees (i.e., home improvement Oregon = −2.303, home improvement Canada = −1.171, vs. base = home improvement CT-grown). This finding implies that class three has a slightly expanded view of “local” that includes CT as well as regional production. Furthermore, this class prefers trees sold at a nursery/greenhouse or choose-and-cut retail outlet more than those sold at home improvement centers (i.e., nursery/greenhouse CT-grown = 1.012, choose-and-cut CT-grown = 1.955, vs. base = home improvement CT-grown).
Based on the results of the class probability model for classes one and two, we can infer that class three is made up of younger consumers. Given that tree buyers are more likely to be younger (Hamlett et al. Reference Hamlett, Herrmann, Warland and Zhao1989), class three may be the primary group that Christmas tree retailers and producers should target. Adding credence to this assertion is the fact that compared to class one, class three members were more likely to have recent purchasing experience with a real tree.
Willingness to Pay
As noted above, height is an important factor for each class's tree purchasing decisions. We find on average that class one would pay $5.86 less for each extra foot of tree compared to class three, which would pay $3.41 less (Table 4). In comparison, class two would pay $4.14 less for each extra foot of tree. Examination of the confidence intervals indicates that the height WTP across classes were not statistically different so we could expect the true WTP discount to be around $3-$5 per foot.
Table 4. Willingness to pay estimates from the latent class model results.
When examining the impact of CT labeling we find that class one would pay between $18-$32 more for a CT-grown tree. However, class three would discount an Oregon tree by almost $42.77 and the Canadian tree by $21.74, while not discounting a Pennsylvania tree compared to a CT tree purchased at a home improvement center. For class two the Canadian tree was discounted by $13.37. Based on these results it is clear that the classes have differing views of local. Class one was the pure local consumer that discounts imported trees. Class two discounts international imports while having no difference between CT and domestic imports. Finally, class three was more of a regional consumer given the discounts associated with Oregon and Canada and the lack of discount for Pennsylvania trees.
Home improvement center trees can expect a discount of $24.36 and $28.91 from a class one consumer compared to nursery/greenhouse and choose-and-cut retail outlets, respectively. Class two consumers show no discount/premium between choose-and-cut and home improvement center CT-grown trees; however, nursery/greenhouse CT-grown trees were discounted by $6.84. Class three sees a wide disparity in retail outlet prices. Nursery/greenhouse outlets can expect an $18.79 premium while choose-and-cut outlets can expect a $36.30 premium compared to home improvement centers.
Conclusions
As Christmas tree producers make production decisions it is essential that they understand they are making a five-plus-year commitment before any returns are realized. Production decisions should be based on anticipated consumer wants instead of producer preferences. Results of this study provide insights into what consumers' value and how producers may use the information in production and pricing decisions. Based on the results of this study, producers should focus on maintaining smaller trees, because smaller trees were preferred in the range we tested (6–10 feet). Furthermore, we find tree species was not as important in the decision process compared to other attributes, leading to the general recommendation that retail outlets primarily focus on the tree species that creates the largest margin for their business. This is especially true for outlets catering to older consumers, because no species was preferred. However, outlets targeting younger consumers need to be a little more wary about only carrying one tree species, given that class one had some preference for Douglas Fir over Scotch Pine.
With respect to origin labeling, we find that a grown-in-CT label does not influence all consumers, though a majority of our sample had a preferential view and would pay a premium for a CT tree. Finally, we find that nursery/greenhouse and choose-and-cut retail outlets are preferred by a majority of consumers; however, not all consumers have a preference for nursery/greenhouse and choose-and-cut outlets (notably class two).
Based on where a Christmas tree is being sold, the recommendation for increasing its chance to be sold differs. For instance, home improvement centers must overcome the preferential view of nursery/greenhouse and choose-and-cut outlets when purchasing a Christmas tree when dealing with consumers in classes one and three. Home improvement centers need to capitalize on consumers who come to their stores to purchase other products, given that no class prefers home improvement centers to nursery/greenhouse or choose-and-cut. Using in-store advertising that CT trees are available, and attempting to make a connection with the community and local producers, could be key in increasing sales at home improvement centers. However, nursery/greenhouse and choose-and-cut need to maximize the preferential perception that many consumers have about their outlet and continue to leverage the CT-grown trees and supporting the local economy image. To expand to different consumer basis these outlets need to focus on younger consumers, particularly those with experience with a real tree (class three).
Taking all the results in totality, producers need to be cognizant of their clientele, because some older consumers are more likely to value CT-grown and choose-and-cut retail outlets. On the other hand, younger consumers have mixed preferences, with some valuing CT-grown and retail outlets while others only value price and height. Therefore, producers should implement different marketing strategies in order to target older and younger consumers, given the distinct differences in their preferences.


 Open access