


Childhood obesity is epidemic in the USA and there are significant racial/ethnic disparities in obesity rates, with Latino children disproportionately affected( Reference Ogden, Carroll and Kit 1 ). The most recent National Health and Nutrition Examination Survey (NHANES) found that 39 % of Mexican American children aged 6–11 years were overweight (BMI ≥ 85th percentile) and 22 % were obese (BMI ≥ 95th percentile)( Reference Ogden, Carroll and Kit 1 ). Childhood obesity significantly increases the risk of being obese in adulthood( Reference Whitaker, Wright and Pepe 2 ) and is also associated with numerous morbidities in childhood( Reference L'Allemand-Jander 3 ). Consequently, it is crucial to understand the aetiology of childhood obesity in Mexican American children to improve the efficacy of prevention measures.
Of the dietary habits which may contribute to child obesity, beverage consumption is of particular interest. However, there are unanswered questions with respect to the effects of different beverages on obesity risk. Energy from sugar-sweetened beverages (SSB) now comprises nearly 10 % of total energy intake for children in the USA, and the greatest increases in SSB consumption have been in minority youth( Reference Wang, Bleich and Gortmaker 4 ). Several studies have found an association between SSB consumption and obesity in children( Reference Ariza, Chen and Binns 5 – Reference Warner, Harley and Bradman 8 ). However, other studies have found no association( Reference Newby, Peterson and Berkey 9 – Reference Vanselow, Pereira and Neumark-Sztainer 11 ), and recent review articles and meta-analyses differ in their conclusions on the strength of the evidence linking SSB consumption to obesity in children( Reference Bachman, Baranowski and Nicklas 12 – Reference Mattes, Shikany and Kaiser 15 ). With respect to beverages other than SSB, several observational and one experimental study found that the consumption of milk and other dairy products may be protective against obesity in children( Reference Barba, Troiano and Russo 16 – Reference Louie, Flood and Hector 20 ); although other studies have found that dairy consumption has a neutral effect on childhood obesity( Reference Spence, Cifelli and Miller 21 ). Finally, while some studies have found that 100 % fruit juice consumption is associated with obesity( Reference Tanasescu, Ferris and Himmelgreen 18 , Reference Dennison, Rockwell and Baker 22 – Reference Melgar-Quinonez and Kaiser 24 ), other studies have not confirmed this finding( Reference Skinner and Carruth 25 , Reference O'Neil, Nicklas and Rampersaud 26 ).
Of the previous studies that have analysed the association between beverage consumption and obesity in Latino children, all but one were limited to children aged 6 years or younger and most examined a limited number of beverage categories( Reference Ariza, Chen and Binns 5 , Reference Davis, Whaley and Goran 6 , Reference Warner, Harley and Bradman 8 , Reference Rosas, Guendelman and Harley 27 , Reference Wilson, Adolph and Butte 28 ). We sought to broadly characterize the beverage consumption habits in a sample of Mexican American children aged 8–10 years and to determine whether beverage consumption was associated with obesity in this population.
Experimental methods
Study design
This was a cross-sectional study using baseline data collected on a cohort of Mexican American children aged 8–10 years living in the San Francisco Bay Area.
Recruitment
Participants were recruited from the membership lists of Kaiser Permanente of Northern California, an integrated health-care system. Parents of potential participants were sent letters introducing the study which included a stamped addressed refusal postcard to opt out of any further contact. After a 2-week waiting period, they received a telephone call from a trained bilingual research assistant and were screened for eligibility. If eligible, they were invited to participate in the study. Children were eligible to participate if they were between the ages of 8 and 10 years old, their mother was of Mexican origin (born in the USA or Mexico) and they had no major illnesses. There were no restrictions to study entry based on child's BMI. Of families screened and found eligible, 37 % of mothers agreed to participate in the study. There were 326 total children enrolled and we have complete beverage consumption data for 319. Prior to entering the study, written informed consent was obtained from parents and assent was obtained from children. The study was conducted according to the guidelines laid down in the Declaration of Helsinki and all procedures involving human subjects were approved by the Committee on Human Research at the University of California San Francisco and the Institutional Review Board of Kaiser Permanente of Northern California.
Data collection and measures
The data for the study were collected during an in-home assessment with the mother and child on entrance to the study. The assessment was conducted by a bilingual research assistant, in the language of the participant's choice. The data were collected over a 2-year period during both the school year and summer months. The questions, adapted from the Youth/Adolescent FFQ( Reference Rockett, Breitenbach and Frazier 29 ), provided more detailed beverage frequency and quantity information than previously existing validated questionnaires. To determine beverage consumption mothers were asked: (i) ‘How many days per week does (child) have (beverage)?’ (ii) ‘On one of the days that (child) has (beverage), how much does he/she have altogether?’ The child was present for the interview and assisted the mother in answering the questions. Based on the mother's response, the interviewer converted the amount described to liquid ounces (1 ounce = 30 ml). The interviewers had been previously trained on dietary recall procedures, which included converting commonly described quantities of beverages to an exact measure in ounces. Mothers were asked about regular soda, diet soda, other SSB (including fruit drinks, sports drinks, flavoured ice teas and other flavoured drinks containing sugar), 100 % fruit juice, whole milk, 2 % milk, 1 % milk, skimmed milk, flavoured milk and plain water (tap or bottled). If a mother was unsure what category a particular beverage fit into, the interviewer provided clarification. For each beverage, average consumption in liquid ounces per week was determined by multiplying the number of days per week that the beverage was consumed by the typical volume consumed. This value was then divided by eight to determine the number of 8 ounce (240 ml) servings per week. The interviewers also measured both children's and mother's height and weight during the in-home assessment, using standard procedures( Reference Stallings and Fung 30 ). Height and weight were measured in duplicate while the participant was wearing light indoor clothes and no shoes.
In addition to maternal BMI, other potential covariates that were measured included: child fast-food consumption, child screen time, child physical activity, maternal country of origin, maternal Spanish language use (as a measure of acculturation), maternal education, household income and the mother's occupational status if employed or formerly employed. To measure fast-food consumption, mothers were asked how often the child eats dinner at a fast-food restaurant, with options ranging from ‘never or almost never’ (= 1) to ‘every day’ (= 6). Mothers were also asked how often the child eats fast food for lunch on weekends, with answers ranging from ‘never or almost never’ (= 1) to ‘2 weekend days per week’ (= 4). Child screen time was determined through an interview with the child( Reference Robinson 31 ). For the most recent weekday and most recent weekend day, children were asked to quantify the total amount of time that they spent watching television, videos or DVDs, playing video games and playing on the computer (excluding homework). Child physical activity was determined by having children wear an Actical accelerometer (Mini-Mitter Co., Inc., Bend, OR, USA) for a 72 h period that captured activity on two weekdays and one weekend day. The accelerometers were fixed to an elastic belt with an adjustable buckle and positioned on the child above the iliac crest of the right hip. The accelerometer was worn at all times during the monitoring period except for when the participant was bathing. The accelerometer data were utilized to determine the child's percentage of time spent engaging in moderate-to-vigorous physical activity.
Acculturation was assessed with the Spanish Language Use subscale of the Bidimensional Acculturation Scale for Hispanics (α for our sample = 0·94)( Reference Marin and Gamba 32 ). Mothers reported the highest educational level that they had attained. The interviewers ranked the occupational status of mothers’ employment using Hollingshead's (1975) scale which ranges from 1 (lowest, e.g. personal service worker) to 9 (highest, e.g. executive or major professional)( Reference Hollingshead 33 ). To determine household income, mothers were asked to estimate annual pre-tax incomes of all individuals living in the home.
Analysis
Maternal BMI was calculated (kg/m2). Children's BMI was also calculated and converted to age- and gender-specific percentiles using the US National Center for Health Statistics growth charts( Reference Kuczmarski, Ogden and Grummer-Strawn 34 ). Children's BMI was converted to a dichotomous variable of obese (BMI ≥ 95th percentile) or not. Mothers’ responses to the questions on fast-food frequency for dinners and weekday lunches were summed together to create one fast-food frequency variable. Children's average daily screen time was created by averaging the weekend and weekday screen time.
All statistical analyses were performed using the statistical software package Stata version 12. We used univariate logistic regression to determine the relationship between beverage consumption and child obesity using the dichotomous variable of obese (BMI ≥ 95th percentile) or not as our outcome and a continuous variable of servings (240 ml servings) of each beverage per week as a predictor. We also examined the relationship of each potentially confounding covariate with child obesity. We retained beverage variables and covariates which were associated with obesity (P < 0·1). We then entered the retained covariates, age and gender and the retained beverage variables in a multivariate logistic regression model.
Results
Complete beverage consumption and BMI results were available for 319 children. Table 1 presents demographic and behavioural characteristics of our sample. There were high rates of both overweight and obesity, with 51 % of children above the 85th percentile for BMI and 31 % above the 95th percentile. Of mothers, 33 % were overweight (BMI = 25·0–29·9 kg/m2) and 47 % were obese (BMI ≥ 30·0 kg/m2). The percentage consuming regular soda, diet soda, other SSB (fruit drinks, flavored teas, flavoured waters and sports drinks), whole milk, 2 % milk, 1 % milk, skimmed milk, flavoured milk, 100 % fruit juice and water (tap or bottled) is presented in Fig. 1 and the mean weekly consumption of these beverages in servings (240 ml) among children who reported consuming any is presented in Fig. 2. The beverages most commonly consumed were water and 100 % fruit juice. Consumption of soda and other SSB was also common; 64 % of children consumed soda and 69 % consumed other SSB. Most children (87 %) consumed either soda or another SSB. Nearly all (99 %) of the children consumed some form of milk, with 2 % milk being the most common followed by flavoured milk. Only 9 % of children consumed non-fat milk. Mean weekly consumption of milk (all forms) was 3·15 litres. The correlations between soda consumption and consumption of the other beverages are displayed in Table 2.
Table 1 Child, parental and household characteristics in a study examining the association of beverage consumption with obesity in Mexican American children (n 319) aged 8–10 years, San Francisco Bay Area, USA
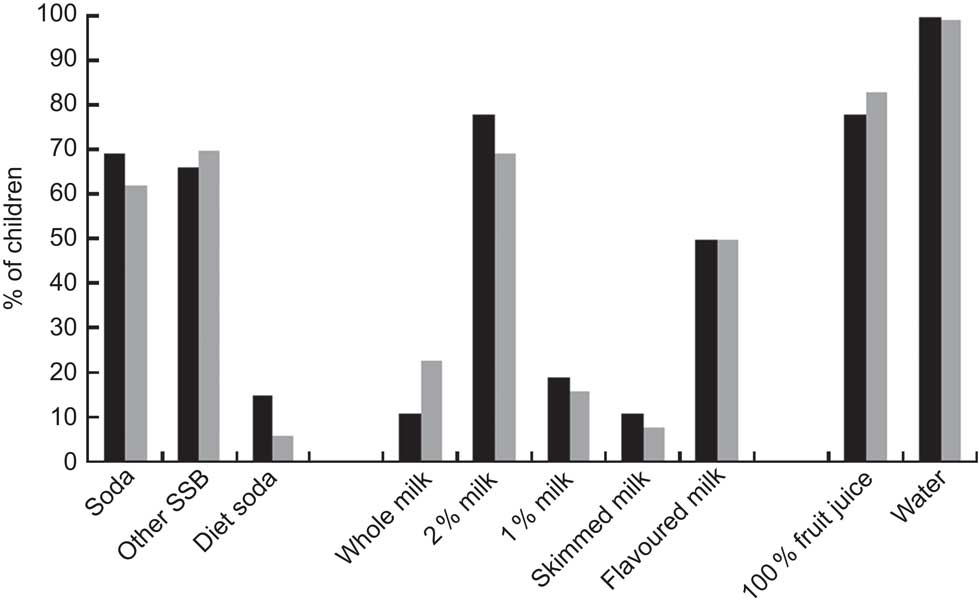
Fig. 1 Percentage of obese (![]() ) and non-obese (
) and non-obese (![]() ) participants who consume each surveyed beverage in a typical week; Mexican American children (n 319) aged 8–10 years, San Francisco Bay Area, USA (SSB, sugar-sweetened beverages)
) participants who consume each surveyed beverage in a typical week; Mexican American children (n 319) aged 8–10 years, San Francisco Bay Area, USA (SSB, sugar-sweetened beverages)
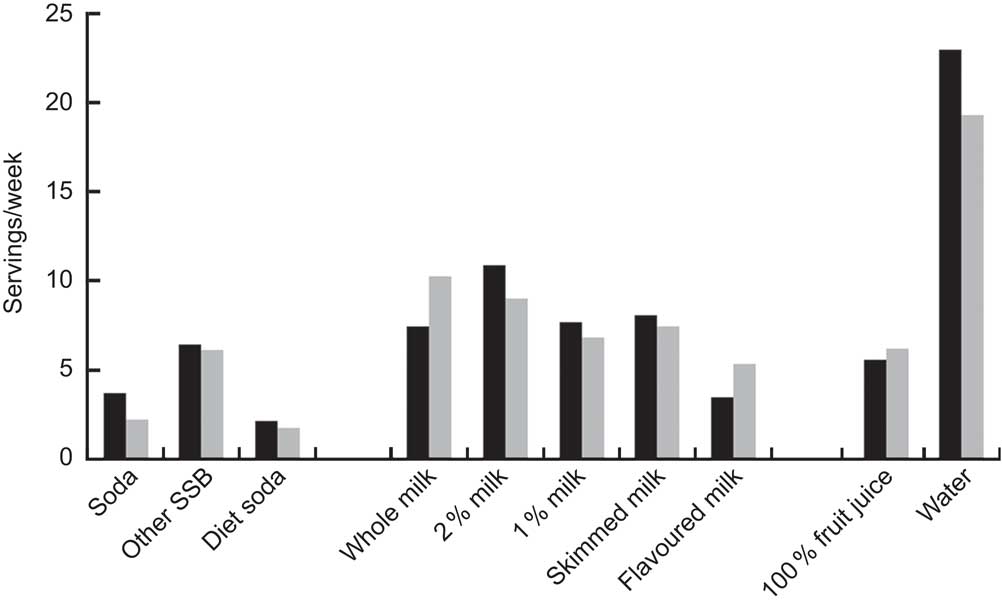
Fig. 2 Mean weekly consumption in servings (240 ml) among obese (![]() ) and non-obese (
) and non-obese (![]() ) participants who consume each beverage; Mexican American children (n 319) aged 8–10 years, San Francisco Bay Area, USA (SSB, sugar-sweetened beverages)
) participants who consume each beverage; Mexican American children (n 319) aged 8–10 years, San Francisco Bay Area, USA (SSB, sugar-sweetened beverages)
Table 2 Correlations between servings (240 ml) of soda consumed in a typical week and servings of all other beverages surveyed; Mexican American children (n 319) aged 8–10 years, San Francisco Bay Area, USA
SSB, sugar-sweetened beverages.
In univariate analyses, consumption of soda, 2 % milk and water were associated with increased odds of obesity; and consumption of whole milk and flavoured milk were associated with lower odds of obesity (Table 3). Consumption of diet soda, other SSB, 100 % fruit juice, 1 % milk and skimmed milk were not associated with obesity. Potential confounding variables that were associated with obesity in univariate analyses with P < 0·1 were: child age, child physical activity (percentage of time in moderate-to-vigorous activity), maternal BMI, maternal acculturation and maternal occupational status (Table 3). Other potential confounding variables not associated with obesity were: gender, fast-food consumption, weekly screen time, maternal education, maternal country of origin and household income. The beverage consumption variables and covariates that were associated with obesity, as well as age and gender, were entered in a multivariate analysis. In the multivariate logistic regression model, soda consumption remained significantly associated with increased odds of obesity and flavoured milk consumption remained significantly associated with lower odds of obesity (Table 3). For flavoured milk consumption, the adjusted odds ratio for obesity was 0·88. For soda consumption, the adjusted odds ratio was 1·29. Thus, for each additional serving of soda (240 ml) consumed weekly, the odds of obesity increased by 29 %. Of the covariates in our model, maternal BMI was the only variable to retain significance in the multivariate analysis (P < 0·001), while child moderate-to-vigorous physical activity neared significance (P = 0·07).
Table 3 Results of univariate and multivariate logistic regression models with obesity (BMI ≥ 95th percentile) as outcome variable and servings (240 ml) of each beverage per week as predictor among Mexican American (n 319) children aged 8–10 years (31 % obese), San Francisco Bay Area, USA
Discussion
In this sample of Mexican American children aged 8–10 years, we found high rates of overweight and obesity. We also found that consumption of soda and other SSB was common. Nearly all of the children also consumed some form of milk, and 80 % consumed 100 % fruit juice. Our analyses revealed that soda consumption was associated with obesity after controlling for multiple potential confounders. For each additional 240 ml serving of soda per week, the odds of obesity increased by 29 %. We also found that flavoured milk consumption was associated with lower odds of obesity. In univariate analysis, whole milk consumption was associated with lower odds of obesity and both water and 2 % milk were associated with increased odds of obesity. However, these variables did not remain significant in an adjusted model. Consumption of 100 % fruit juice, SSB other than soda, 1 % milk and non-fat milk were not associated with obesity.
The prevalences of overweight and obesity in the current sample were higher than national averages for Mexican American children aged 6–11 years( Reference Ogden, Carroll and Kit 1 ). The rate of obesity among mothers in our study was also higher than national averages( Reference Flegal, Carroll and Kit 35 ). The higher rates of obesity in the children in our sample compared with NHANES data may be due to the relatively older age of the child participants (all children were aged 8 years or older). It is also possible that parents of overweight and obese children and parents who are themselves overweight may have been more interested in participating in a study on dietary practices than parents of normal weight children.
Our finding that soda consumption was associated with obesity is consistent with previous work in younger populations of Latino children. Warner et al.( Reference Warner, Harley and Bradman 8 ) found that 2-year-old Mexican American children who consumed one or more sodas daily were more likely to be obese than those who consumed no soda. Similarly, a study of Latino children aged 2–4 years living in Los Angeles discovered that those who consumed two or more beverages with added sugar on a daily basis had increased odds of obesity( Reference Ariza, Chen and Binns 5 , Reference Davis, Whaley and Goran 6 ). Ariza et al.( Reference Ariza, Chen and Binns 5 ) reported that 5- and 6-year-old Latino children who consumed drinks containing sugar (soda, fruit punch and atole) on a daily basis were more likely to be overweight than those who did not. In contrast to our findings, Rosas et al.( Reference Rosas, Guendelman and Harley 27 ) did not find that either soda or other sweetened drink consumption was associated with overweight in 5-year-old Mexican American children and Wilson et al.( Reference Wilson, Adolph and Butte 28 ) found that the percentage of total energy intake from soda was not predictive of obesity in a large cohort of low-income Latino children aged 4–19 years.
Our study adds to the growing evidence linking soda consumption with childhood obesity. One reason why SSB such as soda may contribute to obesity is that energy consumed in liquid form may not produce the same sensation of satiety as energy from solid food and hence may not be compensated for with reduction in later intake( Reference Pan and Hu 36 ). In our study, we did not find an association between consumption of SSB other than soda with obesity. This may be because our ‘other SSB’ category comprised a wide range of beverages with different sugar and energy contents, whereas most soda brands have relatively similar energy content. It is important to note that the consumption of SSB has also been directly linked to the metabolic syndrome and type 2 diabetes, independent of its association with obesity( Reference Malik, Popkin and Bray 37 ). In a meta-analysis of studies conducted with adults, those who consumed one or more SSB per day were found to have a 26 % increased risk of diabetes compared with those who consumed one or fewer sodas per week( Reference Malik, Popkin and Bray 37 ). Higher SSB consumption has also been linked to higher systolic blood pressure in adolescents( Reference Nguyen, Choi and Lustig 38 ). Thus, SSB consumption may be a risk factor for future disease, irrespective of BMI.
Our finding of an association between flavoured milk consumption and lower odds of obesity has not been previously reported. While the sugar and fat contents of flavoured milk vary from brand to brand, flavoured milks generally have more energy per unit volume than non-flavoured milk. Thus, it may be that parents of lean children in our population were more comfortable serving their child a relatively higher energy beverage. We also found that whole milk consumption was significantly associated with a lower risk of obesity in univariate analysis and neared significance in our multivariate analysis (P = 0·07). Three previous studies have found an association between whole milk consumption and lower odds of obesity in children( Reference Barba, Troiano and Russo 16 , Reference Wilson, Adolph and Butte 28 , Reference LaRowe, Moeller and Adams 39 ). One possible explanation for these findings is that the fat content of whole milk promotes satiety and thus reduces overall energy consumption. As all of these studies were cross-sectional rather than longitudinal, it is also possible that lean children were more likely to consume higher-fat dairy products because their parents were not actively attempting to restrict energy and fat in their diets. However, three longitudinal studies of adults have found reduced weight gain and improved measures of adiposity over time in those consuming high-fat dairy products( Reference Louie, Flood and Hector 20 ). Longitudinal studies in children are needed to further substantiate the link between high-fat dairy consumption and lower risk of obesity and to determine the direction of the association.
Of note, we did not find an association between screen time and obesity in the present study. The link between excess television viewing time and obesity in children has been shown in several prior studies( Reference Ariza, Chen and Binns 5 , Reference Anderson and Whitaker 40 , Reference Lumeng, Rahnama and Appugliese 41 ). It is possible that our measure of screen time was inaccurate because it required the child to estimate total time spent in various screen time activities. Alternatively, it may be that diet is a more important risk factor for obesity in this population than sedentary time.
There are several strengths to our study. These include the large sample size, the in-home interview format and the inclusion of a wide array of beverages. Furthermore, we were able to control for multiple potential confounders in our analyses. Another strength of our study is that it addresses an important and still controversial question regarding the link between beverage consumption and obesity in a population with a high prevalence of overweight and obesity. An important limitation of the study is that it used a cross-sectional design. Thus, it is not possible to determine the direction of causality in the associations we uncovered. Additionally, as our predictor variables were determined through a parent interview, it is possible that some parents answered in a way that they thought was socially desirable and may have reported lower consumption of certain beverages that they considered to be unhealthy.
Conclusion
We found that soda consumption is an independent predictor of obesity in Mexican American children aged 8–10 years. Interventions to prevent obesity and other related conditions in Mexican American children should target reducing the consumption of soda. These interventions should begin prior to school age to promote the establishment of healthy beverage consumption patterns.
Acknowledgements
Sources of funding: This study was supported by grant R01 HL084404 from the National Heart, Lung, and Blood Institute. Conflicts of interest: All authors state that they have no conflicts of interest. Authors’ contributions: A.L.B. conducted data analysis and drafted the manuscript. J.T. contributed to study design, data analysis and edited the manuscript. N.F.B. contributed to study design and edited the manuscript. C.P. contributed to study design and edited the manuscript. L.C.G. contributed to study design and edited the manuscript. Acknowledgements: The authors acknowledge the contributions of Dr Irene Takahashi and Dr Jennifer Cho who assisted with recruiting participants.


