The evolution of the IBA concept
Site-based conservation initiatives, such as protected area networks, form a major focus of conservation investment by governments, donors and civil society. Site protection can be effective in preventing or reducing habitat loss and other threats driving the biodiversity crisis (e.g. Beresford et al. Reference Beresford, Eshiamwata, Donald, Balmford, Bertzky, Brink, Fishpool, Mayaux, Phalan, Simonetti and Buchanan2013). However, biodiversity is very unevenly distributed around the planet, and can be highly concentrated in a relatively few small areas; for example, just 1% of the world’s forest area supports 27% of the aggregate range-rarity (a measure that captures both species richness and endemism) of forest birds (Buchanan et al. Reference Buchanan, Donald and Butchart2011). There is evidence of a considerable mismatch between the distribution of biodiversity and the location of protected areas, which form one of the cornerstones of site-based responses to biodiversity loss (Rodrigues et al. Reference Rodrigues2004, Beresford et al. Reference Beresford, Buchanan, Donald, Butchart, Fishpool and Rondinini2011, Butchart et al. Reference Butchart, Scharlemann, Evans, Quader, Arinaitwe, Bennun, Besançon, Boucher, Bomhard, Brooks, Burfield, Burgess, Clay, Crosby, Davidson, De Silva, Devenish, Dutson, Díaz Fernández, Fishpool, Foster, Hockings, Hoffmann, Knox, Larsen, Lamoreux, Loucks, May, Millett, Parr, Skolnik, Upgren and Woodley2012, Reference Butchart, Clarke, Smith, Sykes, Scharlemann, Harfoot, Buchanan, Angulo, Balmford, Bertzky, Brooks, Carpenter, Comeros, Cornell, Ficetola, Fishpool, Harwell, Hilton-Taylor, Hoffmann, Joolia, Joppa, Kingston, May, Milam, Polidoro, Ralph, Richman, Rondinini, Skolnik, Spalding, Stuart, Symes, Taylor, Visconti, Watson and Burgess2015). There is therefore a clear need to identify the sites of greatest importance for biodiversity and to target conservation actions towards them.
The Important Bird Areas (IBA) programme (later changed to Important Bird and Biodiversity Areas when their importance for other taxa was demonstrated; see below) has its origins in legislation laid down by the European Economic Community (now the European Union) in the late 1970s. The 1979 Birds Directive (2009/147/EC) on the conservation of wild birds requires all Member States of the EU to take measures to conserve birds through the identification and designation of a network of special protection areas (SPAs), among other measures. At the time of its introduction, the Birds Directive highlighted a significant lack of understanding of where the most important sites for birds were and stimulated an effort to identify and document them. The IBA programme was therefore developed to guide the identification of areas of significance for birds in the EU, and so from the outset sought to delineate discrete sites that can be managed through conservation action. Their scale therefore differs from a number of subsequent approaches to identifying global priorities for conservation at a regional or landscape scale, such as Centres of Plant Diversity (WWF and IUCN 1994, 1995, 1997), the Global 200 Ecoregions (Olson and Dinerstein Reference Olson and Dinerstein1998), Endemic Bird Areas (Stattersfield et al. Reference Stattersfield, Crosby, Long and Wege1998) and Biodiversity Hotspots (Myers et al. Reference Myers, Mittermeier, Mittermeier, da Fonseca and Kent2000, Mittermeier et al. Reference Mittermeier, Gil, Hoffmnann, Pilgrim, Brooks, Mittermeier, Lamoreux and Da Fonseca2004). These broad-scale approaches are important for understanding the distribution of threatened biodiversity, for identifying priority regions and for promoting the more efficient allocation of geographically flexible conservation funding (Brooks et al. Reference Brooks, Mittermeier, da Fonseca, Gerlach, Hoffmann, Lamoreux, Mittermeier, Pilgrim and Rodrigues2006) but offer less insight into targets for practical site-based actions.
For nearly 40 years, the IBA programme of BirdLife International has aimed to identify, document, safeguard, manage and monitor a network of sites of international significance for birds. This has created the globally most extensive site-based, spatially explicit, systematically rigorous biodiversity dataset yet compiled. The approach has inspired the development of similar protocols to identify key sites for other taxa, and these different approaches have recently been unified under the banner of Key Biodiversity Areas (KBAs; IUCN 2016), which can be viewed as a logical development of the IBA programme.
The recent publication of the KBA Standard and the renewed interest it has raised in the identification of important sites for biodiversity makes a review of the IBA programme particularly timely. We review for the first time the evolution of the IBA programme since its beginnings, covering the development of the IBA concept, the criteria by which IBAs are identified and the characteristics of the resulting inventory of sites. We also assess how IBAs function as a network, consider their provision of ecosystem services and reflect on the likely impacts of climate change and other threats on the functioning and future distribution of IBAs. The relevance and impact of the IBA programme in influencing conservation policy and practice, their role in systematic conservation planning and the important role of local conservation groups in conserving IBAs on the ground are discussed elsewhere (Waliczky et al. in press).
History and coverage
Terrestrial and freshwater IBAs
The IBA programme dates back to 1979, when the International Council for Bird Preservation (ICBP, now BirdLife International) and the International Waterfowl and Wetlands Research Bureau (IWRB, now Wetlands International) proposed to the Commission of the European Community that a study be undertaken to identify areas that might be considered under Article 4 of the newly adopted European Council Directive 79/409/EEC (the Birds Directive). A working group was established to oversee the development of the criteria by which such sites were to be identified and for the compilation of site-level data. The first output of this process was an inventory of 694 sites in the (then) nine Member States of the European Community (Osieck and Mörzer Bruyns, Reference Osieck and Mörzer Bruyns1981). In the early 1980s, work with the EU Commission began to identify priority sites for the conservation of European migrant birds on their wintering grounds in Africa (Ledant et al. Reference Ledant, Roux, Jarry, Gammell, Smit, Bairlein and Wille1986). This study was the first to promote the idea that the IBA concept could be applied beyond Europe.
Further collaborative work between ICBP and IWRB resulted in the publication of a regional inventory of IBAs for Europe (Grimmett and Jones Reference Grimmett and Jones1989), which expanded the European IBA network beyond the borders of the European Union. This milestone publication was a major step towards realising a continent-wide bird conservation strategy and accelerated progress towards maintaining and enhancing the conservation value of the sites it identified. In the same year, a separate inventory, commissioned by the European Commission, was published on IBAs in the (by then) 12 Member States of the European Community (Grimmett and Gammell Reference Grimmett and Gammell1989). With the publication of these inventories, national conservation organisations in many European countries began increasingly to focus their site conservation activities on national IBA networks, and local volunteers were mobilised at numerous IBAs to help protect, monitor and manage these sites.
In the early 1990s, the IBA programme was extended to the Middle East (Evans Reference Evans1994) and then, following the creation of BirdLife International in 1993 and the development of standardised global IBA criteria, increasingly across the rest of the world (Table 1, Figs. 1, 2). The four global criteria (A criteria) are used to assess sites on the basis of the presence of globally threatened species (Criterion A1), range-restricted species (A2), biome-restricted species (A3) and large congregations (A4). In 2000, a second inventory of European IBAs was published (Heath and Evans Reference Heath and Evans2000), which contained 50% more IBAs than the 1989 inventory. This substantial rise reflected the growing recognition of the importance of site-based inventories, the development and application of regional IBA criteria (B criteria) and criteria developed to guide conservation in the European Union (C criteria), and increased knowledge of the distribution of biodiversity, which was largely a result of the stimulus provided by the first inventory. The break-up of the Soviet Union also led to greater participation by a larger number of states. Continent-wide IBA inventories of Africa (Fishpool and Evans Reference Fishpool and Evans2001) and Asia (BirdLife International 2004a) followed shortly after, then inventories for Australia (Dutson et al. Reference Dutson, Garnett and Gole2009) and most of the Pacific (BirdLife International 2010a). An IBA inventory of the five countries of the Tropical Andes (BirdLife International and Conservation International 2005) was soon followed by inventories of the Caribbean (BirdLife International 2008a) and the whole of the Americas (Devenish et al. Reference Devenish, Fernández, Clay, Davidson and Zabala2009). IBA inventories have also been compiled for Palau, New Caledonia, Fiji, Antarctica and the UK and French Overseas Territories, among many others. The only major gap remaining in the coverage of terrestrial IBAs is New Guinea (both Papua New Guinea and West Papua). Thus, in a little over a decade, the identification of IBAs spread from Europe to most of the rest of the world, a remarkably rapid proliferation given the considerable resources required to undertake and publish IBA inventories. All of these inventories have been compiled using systematic criteria (see below), using data gathered locally by BirdLife Partners (national NGOs, generally one per country, that are part of the global BirdLife Partnership) or other organisations, and curated in a central database maintained by BirdLife International (http://www.birdlife.org/datazone/site/search). Published inventories have often taken the form of regional compendia, but the large size of these permits only the most basic data to be presented. Increasingly, IBA inventories have also been published in the form of national or even sub-national publications, which have the benefits of using local languages, allowing more detailed and more recent information to be presented, placing the set of sites within a conservation context at an appropriate scale and raising the profile of the organisations that produced them. A list of national and sub-national IBA inventories is available at: http://www.birdlife.org/datazone/info/ibainventories.
Table 1. Summary of the number, area and protected area coverage of global and regional IBAs in 2017. Protected area coverage was assessed by a spatial intersection of IBA polygons with data in the World Database of Protected Areas (April 2017). IBA area was measured from polygons in GIS using a Behrmann equal-area projection; where polygons were not available (3.6% of global IBAs, 1.6% of regional IBAs), the locally-entered estimate of IBA size was used instead. Note that 33 global IBAs (0.3%) lack data on area and are excluded from the area statistics. Overseas territories are listed under their geographical region, not the region of their political affiliation. Marine IBAs falling within national jurisdictions are listed under their respective regions; those falling outside any national jurisdiction are shown separately under “High Seas”
*these totals exclude sites identified in North America (the USA and Canada) using national-level criteria.
Figure 1. The increase in the number of IBAs, 2000-2015. Light grey: global IBAs, dark grey: regional IBAs. Regional criteria have been applied only in Europe, the Middle East and the Caribbean. These figures do not include sites identified in North America using national-level criteria similar to those used to identify IBAs.
Figure 2. Distribution of the world’s global IBAs in July 2017.
Marine IBAs
Extending the terrestrial IBA programme to the marine environment was a logical and significant development, but one that posed conceptual and practical challenges, both in terms of data collection and in the application of the criteria in environments whose dominant features are often dynamic and poorly known (Hyrenbach et al. Reference Hyrenbach, Forney and Dayton2000). As a result, the global inventory of marine IBAs, particularly those located in offshore areas, is still in development. As with the terrestrial IBA programme, initial work on the identification of marine IBAs began in Europe, in response to the recognition that the European Union’s Birds and Habitats Directives applied also to Member States’ Exclusive Economic Zones (EEZs). The identification of marine IBAs began in the Baltic (Durinck et al. Reference Durinck, Skov, Jensen and Pihl1994, Skov et al. Reference Skov, Vatikus, Raudonikis, Sidlo, Kalamees, Luigijze, Stipneice, Welander, Kondratyev, Grishanov, Scheller, Struwe-Juhl, Leivo, Flensted and Rasmussen2000) and the North Sea (Skov et al. Reference Skov, Durinck, Leopold and Tasker1995), followed by the Bering Sea (National Audubon Society 2004); these projects were, however, specific to the regions concerned and did not attempt to develop common approaches.
Subsequently, a process of standardisation was begun, stemming from an initial review by Osieck (Reference Osieck2004). A follow-up analysis of existing IBA datasets (Howgate and Lascelles Reference Howgate and Lascelles2007) found that, across 158 countries and territories worldwide, some 2,000 IBAs had by that time been identified on the basis of their seabird populations, nearly all of which were in near-shore coastal waters. At the same time, a collaborative project involving BirdLife Partners in Portugal and Spain sought to identify marine IBAs within Iberian waters through the testing of different data-collection and analytical approaches, resulting in the first repeatable methods of site selection in both coastal and pelagic waters (Ramírez et al. Reference Ramírez, Geraldes, Meirinho, Amorim and Paiva2008, Arcos et al. Reference Arcos, Bécares, Rodríguez and Ruiz2009, Lascelles et al. Reference Lascelles, Langham, Ronconi and Reid2012). There has been an increase in the number of BirdLife Partners engaged in marine IBA work, the focus of which has been within their respective national Exclusive Economic Zones (or equivalents). In ‘Areas Beyond National Jurisdiction’, the BirdLife Secretariat’s Marine Programme leads the IBA identification process, which has drawn heavily upon analyses of seabird tracking data contributed by seabird researchers worldwide and held at www.seabirdtracking.org. Global standards for collecting, analysing and interpreting data from a range of sources (e.g. satellite tracking, at-sea surveys, foraging preferences from literature reviews) to identify marine IBAs using the IBA criteria have now been developed (BirdLife International 2010b, Lascelles et al. Reference Lascelles, Taylor, Miller, Dias, Oppel, Torres, Hedd, Le Corre, Phillips, Shaffer, Weimerskirch and Small2016). To date, 2,621 IBAs have been identified for seabirds, of which 999 (38%) include a significant marine component, and the remainder are essentially coastal or terrestrial (e.g. seabird breeding colonies).
Regional IBAs
In addition to the global IBAs described above, sites have been identified as IBAs using criteria and thresholds applicable at regional levels (Table 1). To date, this has been done most comprehensively in Europe, largely to ensure that IBA qualification complements European Union legislation. The set of 20 criteria used to identify sites of European (regional or ‘B-level’) and of European Union (‘C-level’) significance (Heath and Evans Reference Heath and Evans2000) were developed such that they nested within the global set as far as possible. For example, the regional criteria use regionally threatened species as triggers (thus shadowing global Criterion A1; Table 2), or lower thresholds for congregatory species (thus shadowing global Criterion A4). More recently, the value of regional IBAs has also been taken into account under the Bern Convention on the Conservation of European Wildlife and Natural Habitats, by governments required to designate sites as part of the Emerald Network, the de facto extension of the EU Natura 2000 network outside the EU, thereby contributing to the Pan-European Ecological Network.
Table 2. A description of the four global IBA criteria. Most IBAs qualify under more than one criterion, as shown in Figure 4.
Outside Europe, small numbers of regional IBAs have been identified in the Caribbean and in the Middle East using criteria similar, but not identical, to those used in Europe. Work is currently underway to produce a harmonised set of regional IBA criteria. A few countries, including the USA and Canada and Finland, have also identified important sites for birds at the national, state or local levels, in some cases using criteria developed especially for the purpose. While the identification of these sites may have substantial conservation value, in particular in countries that have the resources to conserve them effectively, only sites of international conservation significance are recognized as IBAs by the entire BirdLife International Partnership, in order to maintain the consistency of IBA designation.
IBA criteria
Key to the success of the IBA programme has been the development of standardised, data-driven criteria that are applied consistently across all countries worldwide. As the application of IBAs expanded beyond Europe, it became clear that the methods used to identify them needed to be modified to produce a set of criteria that could be globally applied to identify a unified set of sites of comparable significance for the conservation of birds. In the mid-1990s considerable efforts were therefore devoted to refining and agreeing a set of simple, robust, semi-quantitative criteria of worldwide applicability (Bibby Reference Bibby and Sutherland1998, Fishpool et al. Reference Fishpool, Heath, Waliczky, Wege and Crosby1998, Bennun and Fishpool Reference Bennun and Fishpool2000). This set remained compatible with those used in Europe and the Middle East and drew heavily on the lessons learned there. The resulting IBA criteria and the thresholds used to identify them at the global level are summarised in Table 2. More detailed explanations of the criteria, and how they have been applied in different regions, can be found in Heath and Evans (Reference Heath and Evans2000), Fishpool and Evans (Reference Fishpool and Evans2001), BirdLife International (2004a, 2008a), BirdLife International and Conservation International (2005), and Devenish et al. (Reference Devenish, Fernández, Clay, Davidson and Zabala2009); see also http://datazone.birdlife.org/site/ibacriteria.
These categories and criteria have been designed to identify a network of sites for all bird species and assemblages of species for which a site-based approach is appropriate (Table 2) and have been used to identify IBAs worldwide in all environments in which wild birds occur. The considerable body of experience that has accrued in their use has led to minor modifications to some of the criteria (Table 2). All IBAs that were previously identified using species or thresholds now excluded by these revised criteria continue to qualify as regional IBAs.
Applying IBA criteria in the marine environment
Extending the IBA programme into the oceans necessitated a review of how to apply the IBA criteria in the marine realm. Following a review of relevant work within the European Union, Osieck (Reference Osieck2004) concluded that, in addition to their breeding colonies, there were four aspects of seabird life-cycles potentially amenable to site-based conservation and to which the IBA criteria could therefore be applied: (i) seaward extensions of breeding colonies, (ii) non-breeding coastal concentrations, (iii) migratory bottlenecks and (iv) at-sea areas for pelagic species. This informed subsequent studies, which have shown that the IBA criteria were capable of capturing all life-cycle stages while recognising that, as with landbirds and waterbirds, a site-based approach to conservation is not appropriate for all species (Ramírez et al. Reference Ramírez, Geraldes, Meirinho, Amorim and Paiva2008, Arcos et al. Reference Arcos, Bécares, Rodríguez and Ruiz2009, BirdLife International 2010b).
The increasing availability of seabird tracking data has created opportunities for identifying pelagic IBAs without the need to visit them, but applying criteria developed largely for terrestrial species to identifying key sites far from land on the basis of tracking data alone has proved challenging. Different researchers have deployed different tracking devices (light loggers, GPS loggers, satellite PTTs, etc.), which have variable spatial and temporal resolutions. Furthermore, the number of birds tracked from a particular colony typically represents a very small, and not necessarily representative, proportion of the total number present in that colony, so some extrapolation and caution are always necessary. However, sophisticated statistical methods have now been developed to improve the identification of important marine areas (Lascelles et al. Reference Lascelles, Taylor, Miller, Dias, Oppel, Torres, Hedd, Le Corre, Phillips, Shaffer, Weimerskirch and Small2016, Soanes et al. Reference Soanes, Bright, Angel, Arnould, Bolton, Berlincourt, Lascelles, Owen, Simon-Bouhet and Green2016), greatly increasing the potential to use standardised IBA criteria to identify key sites far from land.
IBA boundary delineation
Allied closely to the development of IBA criteria has been the process of IBA boundary delineation. As far as possible, IBA boundaries are identified such that: (i) the area inside the boundary is different in character, habitat or ornithological importance from surrounding areas; (ii) the IBA exists as a discrete manageable unit, such as a protected area, with or without buffer zones, and (iii) the site is an area that provides the requirements of the trigger species (i.e. those for which the site qualifies) while present, alone or in combination with networks of other sites. In many cases, delineation is straightforward, often dictated by obvious habitat boundaries or guided by existing protected area boundaries, land ownership or management boundaries. Other features that may be used in IBA delineation include roads or rivers, water catchment areas, local topographical features, contour lines, bathymetry, lines of longitude and latitude (particularly in the marine environment), measures of remoteness from settlements or roads (as indicators of intactness of habitat or lack of disturbance), boundaries of ownership or administration (e.g. legal or ethnic), logging concession data, and the geographical occurrence of actual and potential threat.
There is no set maximum or minimum size for an IBA, although the condition that the site forms a single manageable unit places a constraint on the maximum sensible area. In some cases, analysis of quantitative distributional data can help determine site size. A variety of approaches has also been taken on how to treat a number of small sites that are close to each other. Depending on the habitat requirements and management needs of the key species, the history of the landscape and the local situation, these could be considered as a series of individual small IBAs (assuming that each separately meets one or more of the selection criteria), a single IBA made up of several parts that are not joined to each other, or as a single larger site containing the key areas and the intervening land/water that may lack ornithological significance. Thus, discrete adjacent sites that have a long history of isolation and have different trigger species or communities might better be identified as separate IBAs, discrete adjacent sites that contain the same trigger species or communities might be better considered as a single IBA comprising several parts, and sites that contain populations of the same trigger species whose range boundaries are poorly defined might best be considered single IBAs within which it is acknowledged that there may be some unoccupied areas or unsuitable habitats.
Characteristics of the IBA network
To date (April 2017), 10,746 global IBAs and 2,447 regional IBAs have been identified (Table 1). Around 2,000 additional national or sub-national (state-level) IBAs have been identified in North America, but the data on these have not yet been assessed against global or regional IBA criteria. The distribution of the sizes of IBAs is approximately log-normal (Fig. 3), so the mean is much larger than the median (Table 1). Most global IBAs are between 10 km2 and 1,000 km2 in area, with an overall median of 153 km2 and a mean of 1,427.9 km2. Sites range in size from less than 1 km2 to over 300,000 km2. Significant differences within and across regions between both mean and median range sizes indicate the different biogeographical characteristics of the regions. For example, the very large mean size of IBAs in Oceania reflects the presence of some particularly extensive marine IBAs, whereas the small median size results from the fact that more than half the IBAs in the region are on small islands. The very small median size of IBAs in Antarctica is a reflection of the tendency of many of the qualifying species there, such as penguins (Spheniscidae), to breed in small, dense colonies on limited areas of ice-free land. Global IBAs are substantially larger than regional IBAs (Kruskall-Wallis test, P < 0.0001), at least partly because most regional IBAs are in Europe, where the mean size of IBAs is smaller than the global average due largely to the more fragmented nature of remaining natural habitats and thus the smaller size of conservation management units.

Figure 3. Frequency distribution of global IBAs of different sizes. Bin sizes are logarithmic, with the number on the x-axis representing the upper limit of each bin.
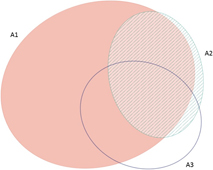
The frequency with which each of the four global criteria are met, as shown in Table 2, does not reveal the extent to which the different criteria are triggered together or independently. Around half of all global IBAs meet two or more criteria (Fig. 4). When considering only the three criteria that capture different elements of rarity or threat (A1-A3), there is a greater coincidence between criteria A1 and A2 than of other pair-wise combinations, or their three-way intersection (Fig. 5). Even though Criterion A3 was not assessed for all IBAs, particularly those on small islands (Table 2), Criterion A2 is that which uniquely triggers fewest IBAs, since most sites meeting this criterion also meet other criteria. Over half of all IBAs meeting criterion A1 are identified on the basis of the presence of a single qualifying (‘trigger’) globally threatened species (Fig. 6), although up to 14 A1 qualifying species have been recorded at a single site (Cuernos de Negros IBA, Philippines).
Figure 4. The number of IBAs qualifying under the four global IBA criteria (see Table 2). The shaded portion of each bar represents the number of IBAs that qualify solely under that criterion.
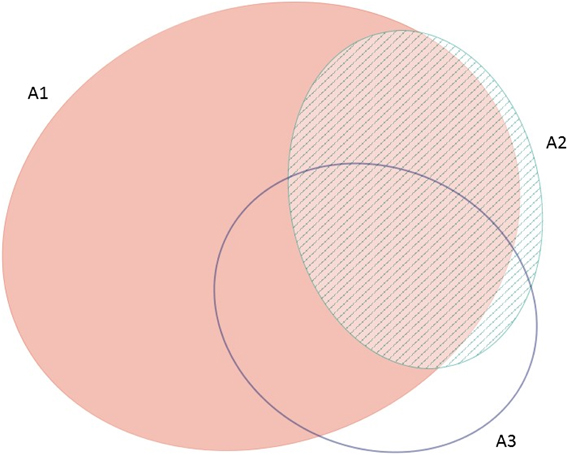
Figure 5. Venn diagram showing the proportion of IBAs meeting one, two or all three of the global IBA criteria relating to species extinction risk (A1), range restriction (A2) or biome restriction (A3). Drawn using eulerAPE (Micallef and Rodgers Reference Micallef and Rodgers2014), which uses ellipses to allow exact area-proportional representation of all intersections.
Figure 6. Histogram (with cumulative %) of the number of qualifying species at IBAs meeting the global A1 criterion.
Compiling a national IBA inventory
The IBA identification process aims to locate, map and document all sites that are known or inferred to meet the selection criteria. Experience across many countries has demonstrated that there is no formulaic approach to compiling an IBA inventory, but some common patterns have emerged. The process entails a thorough review of existing knowledge of the national avifauna and its distribution, including analyses of IUCN Red List of Threatened Species data and data compiled for the identification of Endemic Bird Areas (Stattersfield et al. Reference Stattersfield, Crosby, Long and Wege1998), and consultations with experts and organisations that hold relevant data, such as Wetlands International, whose International Waterbird Census (IWC) data have informed IBA identification. This consultation may involve one or more national workshops that bring together experts and additional stakeholders to compile and discuss the draft IBA lists and undertake an initial gap analysis to ensure that relevant trigger species have not been omitted. These workshops also help publicise the project, involve, train and enthuse participants, build national ownership of the IBA inventory, and ensure institutional buy-in to the results from the beginning. In some larger countries, existing national networks were mobilised, such as the Indian Bird Conservation Network and China Ornithological Society. This has had the incidental benefit of greatly strengthening the capacity of local conservation organisations to generate data relevant to conservation (Arinaitwe et al. Reference Arinaitwe, Ngeh and Thompson2007).
The output of this initial work is a list of potential IBAs, each of which usually falls into one of three broad categories: well-studied sites with adequate and up-to-date data, less well known sites with older or poorer quality information and, in some countries, areas for which there is little information but that are known or thought to hold good quality habitat in which IBA trigger species may be expected to occur. The first of these generally qualify as IBAs in the absence of any further ornithological data, while the second two represent gaps that require additional field work to determine whether or not they hold trigger species in numbers sufficient to meet IBA criteria. Where circumstances permit, surveys are then undertaken to fill in these gaps.
For those countries in which an in-depth approach to identifying an IBA network has not so far been possible (due to lack of resources, lack of a BirdLife Partner organisation or other appropriate body, political instability etc.), national inventories have been compiled by desk-based analyses that bring together all available information, relying on national expertise and input from non-BirdLife organisations. Other regional mechanisms have also been used, for example where there is ongoing species or habitat action planning. Some international agreements, such as the Bern Convention and its Emerald Network (Council of Europe 1979; https://www.coe.int/en/web/bern-convention/emerald-network), and some funding bodies, such as the Critical Ecosystem Partnership Fund (CEPF), invest resources in undertaking systematic site prioritisations before investment using methods similar to those used to identify IBAs.
In order to ensure that proposed IBAs from different countries meet a common standard, a final phase of confirmation is undertaken by the regional and global BirdLife Secretariats, which define lists of potential IBA-trigger species and thresholds, validate and confirm that proposals meet the criteria, and manage the database in which all IBA data are stored.
For all IBAs, data are collected not only on the trigger species present, but also location, physical characteristics, other (non-trigger) avifauna, habitats, land-use, threats, protection status, conservation activities, other significant non-avian biodiversity and literature sources. The methods used for compiling and classifying this information have been standardized as much as possible. Standard classifications have been developed for several of the data fields to simplify data collection and to facilitate subsequent comparisons and analyses. Further details are given in Heath and Evans (Reference Heath and Evans2000), Fishpool and Evans (Reference Fishpool and Evans2001), BirdLife International (2004a, 2008a), BirdLife International and Conservation International (2005) and Devenish et al. (Reference Devenish, Fernández, Clay, Davidson and Zabala2009).
IBAs as networks
As a consequence of their origins and the criteria used to identify them, IBAs have always been considered both as individual sites significant for the conservation of the populations they hold, and collectively as networks of sites. These, in different combinations, function to help secure regional populations, flyway populations of migratory species or indeed entire species. The network function of IBAs is particularly important for migratory species, whose use of IBAs varies seasonally. Many migratory birds follow well-defined flyways, along which they may congregate at certain stages of their annual cycle. IBA criteria allow identification of sites on the basis of migratory congregations and many species make use of different IBAs throughout their annual cycles. For many species, the need to minimise the length of crossings over water or other obstacles when moving between breeding and non-breeding areas results in concentrations at ‘bottleneck’ passage sites. A particular challenge to identifying such sites is that the number of birds present at any one time may represent only a small proportion of the total number of birds passing through the site each season.
Identification and analysis of site networks can help inform prioritisation of conservation action. As part of the collaborative ‘Wings Over Wetlands’ (WOW) African-Eurasian Flyways Project (http://wow.wetlands.org), the latest waterbird data held by BirdLife International and Wetlands International were compiled, combined with spatial data to allow population level analysis and assessed against two quantitative criteria (based on IBA and Ramsar criteria). In this way, 3,087 Critical Sites (all IBAs or sites that would meet IBA criteria) were identified for 559 populations of 244 species (Wings Over Wetlands 2011). Of these, 459 sites were identified for the first time as candidate IBAs on the basis of International Waterbird Census (IWC) data. Some Critical Sites met criteria for a single population, but many qualified for multiple populations and some sites supported more than 40 populations meeting the criteria. The WOW project demonstrates the value of reviewing site networks for particular taxonomic groups and geographic areas with a view to filling gaps in comprehensiveness, and to address gaps in protection and effective management.
IBA data also form the backbone of the Migratory Soaring Bird Sensitivity Mapping Tool (http://migratorysoaringbirds.undp.birdlife.org/en/sensitivity-map), which focuses on wind energy development and combines data on soaring birds at IBAs with count data from other sources and satellite tracking data, then analyses and interprets it for a user-defined area in order to help developers, planning authorities and others to visualise and report on the relative sensitivity of different areas to potential wind energy development.
IBAs, non-bird biodiversity and ecosystem services
Birds are relatively easy to identify and record in the field and have relatively well-understood distributions and habitat requirements. As a result, more information is available on the status and distribution of the world’s birds than for any other major taxonomic group (BirdLife International 2004b, 2008b). A number of studies have shown that IBAs can be effective in capturing key sites or important populations of a wide range of other taxa, both on land (Pain et al. Reference Pain, Fishpool, Byaruhanga, Arinaitwe and Balmford2005, Tushabe et al. Reference Tushabe, Kalema, Byaruhanga, Asasira, Ssegawa, Balmford, Davenport, Fjeldså, Friis, Pain, Pomeroy, Williams and Williams2006, Butchart et al. Reference Butchart, Scharlemann, Evans, Quader, Arinaitwe, Bennun, Besançon, Boucher, Bomhard, Brooks, Burfield, Burgess, Clay, Crosby, Davidson, De Silva, Devenish, Dutson, Díaz Fernández, Fishpool, Foster, Hockings, Hoffmann, Knox, Larsen, Lamoreux, Loucks, May, Millett, Parr, Skolnik, Upgren and Woodley2012, Reference Butchart, Clarke, Smith, Sykes, Scharlemann, Harfoot, Buchanan, Angulo, Balmford, Bertzky, Brooks, Carpenter, Comeros, Cornell, Ficetola, Fishpool, Harwell, Hilton-Taylor, Hoffmann, Joolia, Joppa, Kingston, May, Milam, Polidoro, Ralph, Richman, Rondinini, Skolnik, Spalding, Stuart, Symes, Taylor, Visconti, Watson and Burgess2015) and in the marine environment (Sydeman et al. Reference Sydeman, Piatt and Browman2007, Parsons et al. Reference Parsons, Mitchell, Butler, Ratcliffe, Frederiksen, Foster and Reid2008, Lascelles et al. Reference Lascelles, Langham, Ronconi and Reid2012, Butchart et al. Reference Butchart, Clarke, Smith, Sykes, Scharlemann, Harfoot, Buchanan, Angulo, Balmford, Bertzky, Brooks, Carpenter, Comeros, Cornell, Ficetola, Fishpool, Harwell, Hilton-Taylor, Hoffmann, Joolia, Joppa, Kingston, May, Milam, Polidoro, Ralph, Richman, Rondinini, Skolnik, Spalding, Stuart, Symes, Taylor, Visconti, Watson and Burgess2015). Birds can therefore act as an indicator group for the identification of key sites for biodiversity conservation. For example, in five global biodiversity hotspots spanning 74 countries in which globally important sites (Key Biodiversity Areas) have also been systematically identified for mammals, amphibians and certain reptile, fish, plant and invertebrate clades, IBAs represent 68% of the number and cover 76% of the area of important sites for all these taxa (Butchart et al. Reference Butchart, Scharlemann, Evans, Quader, Arinaitwe, Bennun, Besançon, Boucher, Bomhard, Brooks, Burfield, Burgess, Clay, Crosby, Davidson, De Silva, Devenish, Dutson, Díaz Fernández, Fishpool, Foster, Hockings, Hoffmann, Knox, Larsen, Lamoreux, Loucks, May, Millett, Parr, Skolnik, Upgren and Woodley2012, BirdLife International 2014). In the European Union, IBAs cover 14% of the land area but capture a mean of 27.8% of the distributions of non-avian vertebrates, with coverage being highest for reptiles (34.5%), followed by amphibians (28.4%), and mammals (22.5%; Kukkala et al. Reference Kukkala, Santangeli, Butchart, Maiorano, Ramírez, Burfield and Moilanen2016). Because IBAs guide the designation of Special Protection Areas under EU law, the creation of Special Protection Areas for birds has resulted in the protection of sites of significance for other biodiversity (van der Sluis et al. Reference van der Sluis, Foppen, Gillings, Groen, Henkens, Hennekens, Huskens, Noble, Ottburg, Santini, Sierdsema, van Kleunen, Schaminee, van Swaay, Toxopeus, Wallis de Vries and Jones-Walters2016).
The IBA programme has been instrumental in inspiring and guiding the development of similar protocols to identify sites of importance to other taxa, such as Important Plant Areas (Plantlife 2010) and Prime Butterfly Areas (van Swaay & Warren Reference van Swaay and Warren2006). The proliferation of such initiatives led to a long process of research, trial and consultation to harmonise them and to include other elements of biodiversity not covered by existing approaches, resulting in the launch in 2016 of a Global Standard for the Identification of Key Biodiversity Areas (KBAs) (IUCN 2016). The criteria developed for the Global Standard owe much to those developed by BirdLife for the identification of IBAs (and, to a lesser extent, the opposite is also true; Table 2), and the KBA process can be seen as a logical extension of the IBA programme that began nearly 40 years ago. The recent establishment of a KBA Partnership, comprising 12 global conservation organisations and the launch of the World Database of Key Biodiversity Areas (www.keybiodiversityareas.org) is expected to add considerable impetus to efforts to identify and conserve a global network of sites of importance for all elements of biodiversity.
Sites significant for biodiversity conservation, including IBAs, deliver and support diverse ecosystem services that contribute to human well-being (Larsen et al. Reference Larsen, Turner and Brooks2012). These include food production, provision of clean water, regulation of climate etc., as well as providing cultural, spiritual and recreational services (BirdLife International 2006a; Rands et al. Reference Rands, Adams, Bennun, Butchart, Clements, Coomes, Entwistle, Hodge, Kapos, Scharlemann, Sutherland and Vira2010). An increasing number of IBAs have been the focus of studies to evaluate the ecosystem services they provide. The Toolkit for Ecosystem Service Site-based Assessment (TESSA; Peh et al. Reference Peh, Balmford, Bradbury, Brown, Butchart, Hughes, Stattersfield, Thomas, Walpole, Bayliss, Gowing, Jones, Lewis, Mulligan, Pandeya, Stratford, Thompson, Turner, Vira, Willcock and Birch2013) has been used in at least 40 IBAs to generate comparable estimates for the most likely alternative state of the IBA (e.g. after conversion to agriculture), so that the net consequences of land-use or policy decisions can be assessed. At Shivapuri-Nagarjun National Park in Nepal, for example, the net monetary benefit of protecting the site (compared with conversion to agriculture and urbanisation) was estimated to be at least $11 million per year, with benefits accruing through greenhouse gas sequestration, carbon storage, nature-based recreation and improved water quality (Peh et al. Reference Peh, Thapa, Basnyat, Balmford, Bhattarai, Bradbury, Brown, Butchart, Dhakal, Gurung, Hughes, Mulligan, Pandey, Stattersfield, Thomas, Walpole and Birch2016). At another Nepali IBA, Phulchoki Mountain Forest, the net economic value of the current community forestry management (compared with plausible alternative land-use) was at least $364,000 per year, generated by benefits to water quality, greenhouse gas sequestration, harvested wild goods and nature-based recreation (Birch et al. Reference Birch, Thapa, Balmford, Bradbury, Brown, Butchart, Gurung, Hughes, Mulligan, Pandeya, Peh, Stattersfield, Walpole and Thomas2014). In the Centre Hills Reserve IBA in Montserrat, a programme of hunting to control populations of feral livestock (and prevent ungulate-associated invasion by non-native plants) provides a net benefit of over $200,000 per year generated from annual ecosystem service flows from nature-based recreation and harvested wild meat (Peh et al. Reference Peh, Balmford, Birch, Brown, Butchart, Daly, Dawson, Grey, Hughes, Mendes, Millett, Stattersfield, Thomas, Walpole and Bradbury2014). At Yala Swamp IBA in Kenya, multiple ecosystem services were compared between two future alternative land use strategies (one of continued development and a balanced scenario where conservation and development coexist). The study demonstrated that adopting a balance between development and conservation would reduce agricultural potential but would improve the socio-economic well-being of local communities through better provision of harvested wild goods, water quantity and quality regulation. It would also reduce greenhouse gas emissions and provide higher recreation values while protecting the biodiversity that the site provides (Muoria et al. Reference Muoria, Field, Matiku, Munguti, Mateche, Shati and Odeny2015). IBAs therefore support significant environmental benefits additional to the bird populations for which they are identified.
IBAs and climate change
A large number of studies have been published in recent years on the impacts of climate change on bird species (e.g. reviews in Pearce-Higgins and Green Reference Pearce-Higgins and Green2014, BirdLife International and National Audubon Society 2015). These studies predict that the distributions of many species will both move and shrink, meaning that there will be only partial overlap, or no overlap at all, between their current and future ranges. At the site level, therefore, there may be considerable turnover in community composition, and concerns have been raised about how useful IBAs and other static site-based approaches will prove under climate change (e.g. Coetzee et al. Reference Coetzee, Robertson, Erasmus, van Rensburg and Thuiller2009). However, there is evidence that IBAs will remain important under projected climate change scenarios. For the sub-Saharan continental African IBA network, Hole et al. (Reference Hole, Huntley, Pain, Fishpool, Butchart, Collingham, Rahbek and Willis2009) found that projected turnover in species varied regionally, but was substantial overall, with 10–13% median projected turnover across all IBAs for all species by 2025, rising to 20–26% by 2085. For priority (IBA ‘trigger’) species, turnover was projected to be 18–21% by 2025, rising to 35–45% by 2085. At 42% of IBAs, the turnover of priority species by 2085 was projected to exceed 50%. However, IBAs projected to lose suitable climate space for the largest numbers of priority species are those projected to experience most new colonisations by priority species, as they are located in areas of high overall species turnover. Similar results were obtained for the IBA networks in the eastern Himalayas and the Lower Mekong; considerable turnover in species composition is expected, but the current network is not projected to lose all suitable climate space for any trigger species (Bagchi et al. Reference Bagchi, Crosby, Huntley, Hole, Butchart, Collingham, Kalra, Rajkumar, Rahmani, Pandey, Gurung, Trai, Van Quang and Willis2013). These models are based solely on predicted movements in climate envelopes and do not consider any changes in habitat suitability at individual sites that might be brought about by climate change, but such models have been shown to be efficient in predicting changes in range and population (e.g. Fordham et al. Reference Fordham, Bertelsmeier, Brook, Early, Neto, Brown, Ollier and Araújo2017).
These results suggest that conserving IBAs can play a key role in mitigating the impacts of climate change, and that their conservation, including addressing other threats and ensuring adequate protection and appropriate management, remains a high priority (Hole et al. Reference Hole, Huntley, Pain, Fishpool, Butchart, Collingham, Rahbek and Willis2009, Reference Hole, Huntley, Collingham, Fishpool, Pain, Butchart and Willis2011).
Targets for the future
We identify three key targets in the future development of the IBA inventory and database, as part of the wider BirdLife IBA programme:
1. Completing the marine IBA inventory
The marine IBA inventory remains incomplete, not least in some areas due to political unwillingness (Ramírez et al. Reference Ramírez, Tarzia, Dias, Burfield, Ramos, Garthe and Paiva2017), and it is likely that many marine IBAs await discovery and documentation. Understanding the distribution of seabirds using tracking technologies, and the development of suitable methods to identify the most important foraging hotspots and migratory bottlenecks from tracking data (Lascelles et al. Reference Lascelles, Taylor, Miller, Dias, Oppel, Torres, Hedd, Le Corre, Phillips, Shaffer, Weimerskirch and Small2016), have opened up new ways of delineating IBAs far from land, but the large number of seabird species and the huge number of (often widely dispersed) breeding colonies means that tracking alone is unlikely to identify all IBAs for all species. Efforts are now underway to narrow the search for new marine IBAs by combining existing tracking data with environmental data (such as sea surface temperature, plankton blooms, ocean eddies etc.) through statistical modelling to identify areas where conditions are likely to be particularly suitable for seabirds (e.g. Arcos et al. Reference Arcos, Bécares, Villero, Brotons, Rodríguez and Ruiz2012, McDuie and Congdon Reference McDuie and Congdon2016). Such analyses may reveal that important areas for seabirds vary greatly between years due to the dynamic nature of the marine environment, and a less static approach to site identification may need to be developed that is flexible to this stochasticity.
2. Improving the monitoring of IBAs
The identification of an IBA is just the first step in its conservation. It is then necessary to develop a system for tracking changes in the populations of its trigger species, their habitats, the threats they face and the conservation responses to those threats. BirdLife has developed a field-based protocol for monitoring IBAs using data on the state of the site and its key bird populations, pressure on the site resulting from threats and responses to those threats (BirdLife International 2006b). The protocol was designed to be simple and robust, so that it could be used by local conservation groups to generate data that are comparable across sites. Where this protocol has been applied systematically, it has proved effective in detecting change and stimulating action (Mwangi et al. Reference Mwangi, Butchart, Munyekene, Bennun, Evans, Fishpool, Kanyanya, Machekele, Matiku, Mulwa, Ngari, Siele and Stattersfield2010, Buchanan et al. Reference Buchanan, Fishpool, Evans and Butchart2013, Ndang’ang’a et al. Reference Ndang’ang’a, Barasa, Kariuki and Muoria2016). However, field-based monitoring is costly in time and resources and is impractical in large, remote or hostile areas. The increasing availability of satellite imagery, and the development of tools to interpret such imagery in terms of conservation impact (Bastin et al. Reference Bastin, Buchanan, Beresford, Pekel and Dubois2013), now permit more comprehensive assessment of some threats to IBAs and alert local conservationists to those threats. They also allow the generation of synthetic indices of the health of the IBA network globally (e.g. Buchanan et al. Reference Buchanan, Nelson, Mayaux, Hartley and Donald2009a, Tracewski et al. Reference Tracewski, Butchart, Donald, Evans, Fishpool and Buchanan2016) to feed into processes such as the Convention on Biological Diversity (CBD)’s Aichi Targets (Butchart et al. Reference Butchart, Scharlemann, Evans, Quader, Arinaitwe, Bennun, Besançon, Boucher, Bomhard, Brooks, Burfield, Burgess, Clay, Crosby, Davidson, De Silva, Devenish, Dutson, Díaz Fernández, Fishpool, Foster, Hockings, Hoffmann, Knox, Larsen, Lamoreux, Loucks, May, Millett, Parr, Skolnik, Upgren and Woodley2012). However, while the most frequently reported threats to IBAs are those that can be detected remotely (Buchanan et al. Reference Buchanan, Donald, Fishpool, Arinaitwe, Balman and Mayaux2009b), not all threats can be seen from space, and the population trends of most trigger species can only be weakly inferred. There is therefore an urgent need to expand in-situ monitoring to detect and track threats such as unsustainable exploitation and the impacts of alien invasive species, and to monitor the trends of the species for which a site qualifies as an IBA. This might be helped by the use of increasing volumes of citizen science data, generated by schemes such as eBird (Sullivan et al. Reference Sullivan, Aycrigg, Barry, Bonney, Bruns, Cooper, Damoulas, Dhondt, Dietterich, Farnsworth, Fink, Fitzpatrick, Fredericks, Gerbracht, Gomes, Hochachka, Iliff, Lagoze, La Sorte, Merrifield, Morris, Phillips, Reynolds, Rodewald, Rosenberg, Trautmann, Wiggins, Winkler, Wong, Wood, Yu and Kelling2014), BirdTrack (http://app.bto.org/birdtrack/main/data-home.jsp) and BirdLasser (https://www.birdlasser.com/), and of apps for smartphones, which can be used to collect spatially-referenced data that can be synchronised directly to central monitoring databases. However, significant difficulties remain in deriving reliable population trend estimates from such unstructured data (e.g. Kamp et al. Reference Kamp, Oppel, Heldbjerg, Nyegaard and Donald2016).
3. Keeping the IBA inventory up to date
In the same way that species can move between IUCN Red List categories as their conservation status changes, so sites can change over time in the number of IBA criteria they meet. For example, changes may arise through changes in the trigger species’ conservation status, changes in taxonomy and changes in the populations of trigger species within KBAs, either real or due to improved knowledge (though it is usually impossible to distinguish between these). This can lead to new sites becoming eligible as IBAs under one or more of the existing criteria, or to current IBAs no longer qualifying under the criteria they previously triggered. This state of flux in the biodiversity that IBAs aim to capture represents a logistical challenge in maintaining an up-to-date and accurate inventory of thousands of sites in a rapidly changing world. It also raises a political challenge in balancing short-term changes in site status with the need to have a network of sites whose conservation may require long-term investment or advocacy. There is therefore a need to identify the optimal balance between frequency of site re-assessment and the stasis required for longer-term conservation processes to act.
Acknowledgements
We thank the many people who have contributed to the development of the IBA programme over the years, within the BirdLife Partnership and beyond. We are particularly grateful to Verónica Anadón-Irizarry, Julius Arinaitwe, Simba Chan, Rob Clay, Christian Devenish, Alistair Gammell, Eduard Osieck and Rudyanto. We thank Alison Stattersfield, Tammy Davies and Jez Bird for their inputs to this article. The IBA Programme has received sustained and generous support from Rio Tinto and from the Tasso Leventis Foundation. We are very grateful to Tom Brooks and three anonymous reviewers for very helpful comments on a previous version of this article.