


Food consumption is a modifiable risk factor for short- and long-term disease burden(Reference Pérez-Escamilla, Segura-Pérez and Lott1–Reference Porter, Tindall and Gaffka3). The complementary food introduction in the first 2 years of life represent a window of opportunity for infants to establish long-term healthy dietary patterns(4–Reference Mameli, Mazzantini and Zuccotti7). In contrast, early introduction of unhealthy foods can compromise child growth and development(Reference Pérez-Escamilla, Segura-Pérez and Lott1,Reference Zobel, Hansen and Rossing8) .
In recent decades, changes in dietary patterns have been observed, such as a lower consumption of fresh foods and a higher consumption of ultra-processed foods (UPF), usually with high energy density, free sugar, sodium and saturated fat(Reference Lobstein, Jackson-leach and Moodie9–Reference Relvas, dos S Buccini and Venancio12). The UPF consumption compromises the nutritional quality of diets and is an important contributor to current prevalence of overweight(Reference Zobel, Hansen and Rossing8,Reference Aguayo-Patrón and Calderón de la Barca13–Reference da C Louzada, Ricardo and Steele15) . Overweight prevalence is rising dramatically worldwide(16) and is a public health problem because it is associated with the higher prevalence of chronic diseases, such as type 2 diabetes, cancer and cardiovascular diseases(Reference Sahoo, Sahoo and Choudhury17,Reference Williams, Mesidor and Winters18) .
Some studies already showed a high consumption of UPF in childhood in Brazil(Reference Batalha, França and Conceição11,Reference Longo-Silva, Silveira and Menezes19,Reference Mais, Warkentin and Vega20) ; however, only few studies evaluated the UPF consumption at earlier ages, including children aged from 6 to 24 months(Reference Relvas, dos S Buccini and Venancio12,Reference Karnopp, dos S Vaz and Schafer21) . Considering the role of complementary feeding to the establishment of healthy dietary habits in childhood and adulthood, the increased consumption of UPF observed in all ages and its association with chronic diseases, this study aimed to evaluate the complementary food consumption according to the extent and purpose of food processing based on NOVA classification among children aged 6–24 months from the Federal District, Brazil. Our hypothesis is that the consumption of UPF contributes to an unhealthy dietary pattern, presenting high intake of sugar, saturated fat and sodium.
Materials and methods
Study design and sample
We performed a cross-sectional study including a representative sample of children aged from 6 to 24 months attended at Primary Health Care Units (PHU), health facilities considered the first access to health services of the Unified Health System (SUS), in Federal District, Brazil. We followed the guide Strengthening the Reporting of Observational Studies in Epidemiology (STROBE)(Reference Lachat, Hawwash and Ocké22).
The sample size was calculated assuming a margin of error of 5 % and a confidence level of 97 %. To calculate the sample, we considered the prevalence of exclusive breast-feeding among children under 6 months of age (equal to 50 %) in the Federal District(23) and the number of children attending in childcare consultations in PHU in Federal District in 2015. We adopted a two-stage sampling because children were not evenly distributed among the PHU. First, we listed all the 131 PHU of the Federal District and randomly selected 20 PHU. Second, based on the number of children attending each selected PHU, we defined their proportional sample. The final sample was 538 children.
All children aged from 6 to 24 months who were attending at the PHU for childcare follow-up consultations during the data collection days were invited to participate. The child must be accompanied by their mothers. We excluded twins and non-biological children.
Data collection
The data collection was conducted from March 2017 to March 2018. The questionnaire was applied by trained interviewer to the children’s mothers. The questionnaire was divided into five parts: (I) identification, socio-economic and demographic data; (II) questions about prenatal, childbirth and puerperium; (III) child health; (IV) household food insecurity and (V) child’s food consumption.
We evaluated household food insecurity using the Brazilian Household Food Insecurity Measurement Scale (EBIA)(24). We evaluated household food insecurity by the affirmative answer scores to the 14 EBIA items, classifying the households as: secure (0), mild insecure (1–5), moderate insecure (6–9) and severe insecure (10–14)(24). We evaluated family household income in ranges according to the Brazilian definition of minimum wage (240·26 USD equivalent to 937·00 BRL, in 2017).
We measured children’s weight and length in duplicate according to the recommendations of the Brazilian Ministry of Health(25). We performed the evaluation of children’s weight and length according to the recommendations of the WHO(26). We used Anthro software to calculate BMI for age, expressed in z-scores, and subjected to biological plausibility criteria. After this, all children were classified as underweight, adequate BMI, risk of overweight, overweight or obese. We evaluated children’s individual dietary intake from a single 24-h recall, the most widely used method for obtaining quantitative dietary data(Reference Rutishauser27). To standardise data collection and to reduce food consumption underreporting, interviewers followed the five-step multiple-pass method for dietary recalls(Reference Conway, Ingwersen and Moshfegh28). We asked the mother for a detailed description, including brands, preparation and quantification – using common household vessels, glassware, and silverware for reporting the portion size – of all food and drinks consumed by the children the day before the interview. We also used a photo album containing foods, kitchen utensils and portions sizes to accurately recall the portions consumed by the child(Reference Falcão-Gomes, Barbosa and Miguel29).
Statistical analysis
Dietary data analysis
First, for all 24-h recall, we converted all reported serving sizes’ food amounts into grams or millilitres based on a food photography booklet developed to access children’s food intake(Reference Falcão-Gomes, Barbosa and Miguel29). When the food or drink was not available in this photo album, we used a Brazilian food portion table to convert the portion size into grams or millilitres(Reference Institute30).
Second, we used the Nutrition Data System for Research (NDSR, version 2018) software (Nutrition Coordinating Center – NCC, University of Minnesota) to estimate the dietary nutrient content from every food listed in the 24-h recall, including total energy and amounts of macronutrients and micronutrients. When a food was not found in NDSR database, we have requested the nutritional information insertion by the NCC Customer Support. After finished the data entry, we conducted an exploratory analysis to check for possible errors. After that, we exported the database to Excel, version 2013 (Microsoft Corp.).
Third, we classified all 415 food items of our database according to NOVA food classification(Reference Monteiro, Cannon and Levy10,Reference Monteiro, Levy and Claro31,32) . The NOVA classifies foods in four groups according to the extent and purpose of processing, covering physical, biological and chemical processes that occur after foods are harvested and before they are acquired and consumed. The first group consists of unprocessed foods and includes those obtained directly from plants or animals, which do not undergo any alteration following their harvest, such as vegetables and fruits. This group also includes minimally processed foods: foods which have been submitted to physical processes that may subtract part of the food but do not add oils, fats, sugar, salt or other substances. Some examples are washed tubers and vegetables, frozen cuts of meat and pasteurised milk. The second group consists of processed culinary ingredients, such as oils, fats, sugar and salt. They are defined as products extracted from foods or from nature and they are used for seasoning, cooking foods and to create culinary preparations. The third group consists of processed foods, products manufactured essentially with salt or sugar in addition to unprocessed or minimally processed foods, including canned and bottled vegetables or fruits, cheese and breads. The fourth group consists of UPF, industrial formulations of which manufacture involves several stages and various processing techniques and ingredients, usually used exclusively by industry. Examples include packaged salty, oily snacks, confectionery, soft drinks, sweetened beverages, sweetened breakfast cereals, packaged cookies and cakes, nuggets and instant noodles(Reference Monteiro, Cannon and Levy10,Reference Monteiro, Levy and Claro31,32) .
In our study, the home-made meals were decomposed into their ingredients. Then, we classified all ingredients into the NOVA’s four food groups. A small number of fresh meals, mainly based on unprocessed and minimally processed foods, were not decomposed and were classified in the NOVA first group. As our main objective was to study complementary feeding, we excluded breast milk and infant formula from the analysis.
For data analysis, we united unprocessed, minimally processed foods and processed culinary ingredients into a group (Group 1) and processed and UPF into another (Group 2). Despite the conceptual difference between processed and UPF, they were placed in the same group for two reasons: first, they are both unbalanced and non-recommended food, and second, the contribution of processed foods for total energy intake was very low (1·9 % for children aged between 6 and 12 months and 5·0 % for children aged between 12 and 24 months), which did not justifying its analysis as an isolated group.
We used the ratio of means to estimate the energy from different foods in Group 1 and Group 2, calculated from the ratio between the average of energy from the different food groups and the average of total energy intake. We used the same method to estimate the contribution percentage of Group 1 and Group 2 in relation to the total energy intake, macronutrient contents and micronutrient intakes. Regarding the macronutrient intakes, we calculated the ratio between the average of energy from macronutrients and the average of energy intake from Group 1 and Group 2, separately. Thus, it was possible to present the percentage contribution of macronutrients within the groups.
Dietary data analyses are summarised at Supplementary material.
Data analysis
We conducted the statistical analyses in Statistical Package for the Social Sciences (SPSS), version 20.0. First, we performed a descriptive analysis of the characteristics of children and their families by absolute and relative frequencies. Second, we presented a descriptive analysis of Group 1 and Group 2 food consumption in terms of the energy contribution from complementary food groups (absolute and relative) and in terms of macronutrient and fibre contents and micronutrient intakes. We presented the 95 % CI for all descriptive analyses, according to the sample design. Third, we conducted a multiple linear regression in order to assess the association between the energy intake from Group 2 (processed and UPF) and the daily energy intake from total fat, saturated fat, carbohydrate, total sugars and protein, daily intake of sodium and content of fibre. To perform the linear regression, we calculated the quartiles of energy intake from Group 2 as the independent variable and considered the first quartile as the reference group. We included the daily energy intake from carbohydrate, total sugar, total fat, saturated fat, protein, daily intake of fibre and sodium as the dependent variables. Micronutrients were not included because our main focus was chronic disease-related nutrients. For this analysis, we also considered socio-economic, demographic and health characteristics as possible confounding factors and the variables with P < 0·20 remain at the final model.
Results
We evaluated 178 children between 6 and 12 months and 360 children between 12–24 months of age. Children’s race was predominantly Black or Brown (56·3 and 56·7 % for children aged from 6 to 12 months and children aged over 12 months, respectively). Approximately 23 % of children presented risk of overweight and 14·6 % of children aged from 6 to 12 months and 12·4 % of children aged from 12 to 24 months already presented overweight or obesity. Most of the mothers were over 20 years old, Black or Brown and had from 4 to 8 years of schooling. The family income was most frequently between USD 240·26 and USD 480·52 and over 39 % of the children lived in households with some level of food insecurity (Table 1).
Table 1 Population descriptive characteristics. Federal District, Brazil, 2017–2018

* The total was lower for some variables due to missing information.
† Income range according to the Brazilian definition of minimum wage (240.26 USD equivalent to 937.00 BRL, in 2017).
‡ Nutritional status according to BMI for age(26).
Regarding children’s complementary food consumption (Table 2), the mean daily dietary energy intake was 2393 kJ/d (6–12 months) and 4054 kJ/d (12–24 months). The proportion of unprocessed, minimally processed foods and processed culinary ingredients (Group 1) of total dietary energy intake was, on average, 69·6 % among younger children and 65·2 % among children aged over 12 months. In Group 1, fruits/natural juices, rice/other cereals and meats/eggs contributed the most to the total energy consumed. On the other hand, about one-third of the dietary energy intake (30·4 and 34·8 %) came from processed and UPF (Group 2). In Group 2, infant and child food products, milk-sweetened beverages and bakery products contributed the most to the total daily energy consumed by the children for both age groups as well as processed foods for children aged between 12 and 24 months.
Table 2 Mean energy intake (kJ/d) and percentage of the total energy intake from complementary food by NOVA groups according to children’s age. Federal District, Brazil
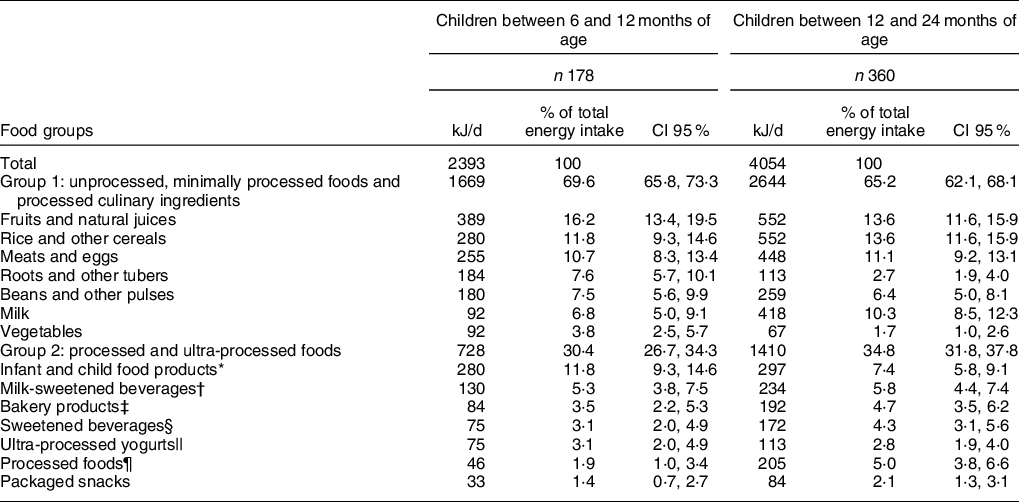
* Flour for porridge, breakfast cereals and industrialised baby foods.
† Powdered and flavoured ready-to-eat dairy beverages.
‡ Crackers, biscuits, cakes and other sweet bakery goods.
§ Soft drinks and artificial fruit drinks.
|| Artificial and flavoured fruit yogurts.
¶ Canned fish, cheese and breads.
Table 3 presents the macronutrient contribution for the total energy intake by NOVA food group. Considering food consumption among children aged from 12 to 24 months, higher percentage of energy came from carbohydrates in Group 2 (%: 70·0; CI 95 %: 64·9, 74·7) when compared with Group 1 (%: 58·3; CI 95 %: 54·3, 62·0) and higher energy from protein in Group 1 (%: 18·9; CI 95 %: 16·1, 22·2) compared with Group 2 (%: 9·8; CI 95 %: 7·1, 13·4). Group 1 presented a higher fibre content when compared with Group 2 both in children aged from 6 to 12 months and children aged from 12 to 24 months.
Table 3 Percentage of the total energy intake of macronutrients and fibre content in complementary food by NOVA groups according to children’s age. Federal District, Brazil
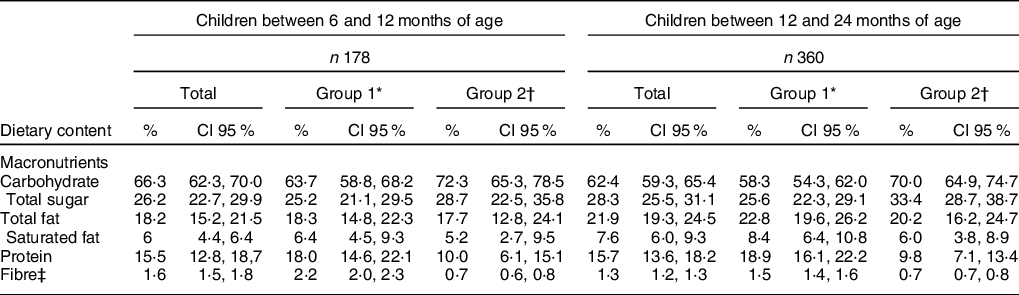
* Unprocessed, minimally processed foods and processed culinary ingredients.
† Processed food and ultra-processed foods.
‡ Results presented in grams per 418·4 kilojoules (g/418·4 kJ/d).
Table 4 presents the micronutrient intakes by NOVA food processing groups. In general, Group 1 was higher micronutrient contributors in both age groups. Group 2 presented higher intakes of iron, retinol, sodium and vitamin D among children aged from 6 to 12 months and children aged from 12 to 24 months. It is worth noting the higher Group 2 sodium intake in both age groups.
Table 4 Mean dietary intake of micronutrients and Na from complementary food by NOVA groups according to children’s age. Federal District, Brazil

* Unprocessed, minimally processed foods and processed culinary ingredients.
† Processed food and ultra-processed foods.
As presented in Table 5, the multiple linear regression showed that the mean daily carbohydrate, total sugar, total fat, saturated fat and protein and sodium intakes gradually increased with the quartiles of energy intake from Group 2 (P < 0·001), especially in the fourth quartile. In other words, the higher the energy intake from processed and UPF, the higher was the daily macronutrient and sodium intakes, with the presence of a dose–response association. However, the daily content of fibre decreased with the quartiles of energy intake from Group 2 (P < 0·001). Therefore, the higher the energy intake from processed and UPF, the lower was the daily content of fibre. Furthermore, the statistical model explains more than 25 % of the included nutrients’ daily intake variance, reaching at 43 % of the carbohydrates’ daily content variance.
Table 5 Multiple linear regression between quartiles of energy from processed and ultra-processed foods and daily energy intake of carbohydrate, total sugar, total fat, saturated fat, protein, fibre and Na. Federal District, Brazil
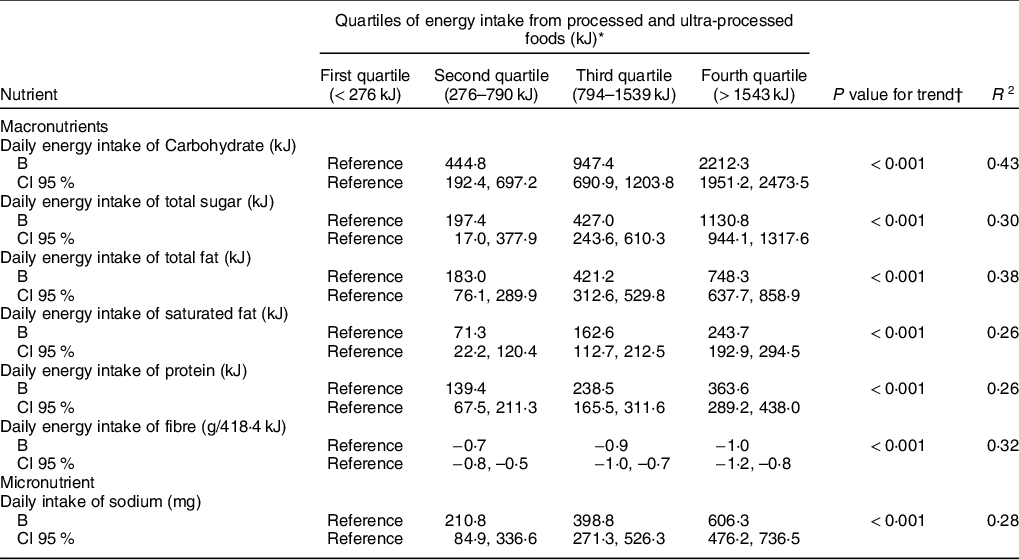
* Multiple linear regression adjusted for household food insecurity, children’s nutritional status according to BMI for age and children’s age.
† P value for trend obtained by multiple linear regression using quartiles of energy intake from processed and ultra-processed foods as continuous variable.
Discussion
Our study found that children are being exposed to UPF very early in life and that the share of UPF is high, affecting the diet’s nutritional quality. UPF contributed to increased consumption of energy and carbohydrates and provided small amounts of fibre, protein and most micronutrients, similar to the results of other studies(14,Reference Monteiro, Cannon and Moubarac33) .
Additionally, we found that children between 6 and 12 months and children between 12 and 24 months of age consumed, on average, 2393 kJ/d and 4054 kJ/d from complementary feeding, respectively. The daily energy requirements, that is the recommended amount of daily energy intake, from complementary feeding for infants are approximately 836 kJ/d at 6–8 months, 1255 kJ/d at 9–11 months and 2301 kJ/d at 12–23 months of age, for developing countries(34). Our results exceed the recommended/estimated amount of daily energy from complementary foods for infants which is associated with potential overweight and obesity in childhood.
In the present study, about 30 and 34 % of the energy intake of children aged between 6 and 12 months and children aged between 12 and 24 months came from processed and UPF, respectively. Batalha et al. (2017) found that processed and UPF consumption reached 25·8 % of daily energy among children from 13 to 35 months of age in the north-east of Brazil(Reference Batalha, França and Conceição11). Karnopp et al. (2017) found that processed and UPF contributed about 20 % of daily energy intake among children aged under 24 months in a southern region of Brazil(Reference Karnopp, dos S Vaz and Schafer21). Among Argentinian infants, the consumption of processed and UPF reached higher percentages than in Brazil (36 %)(Reference Drake, Gilardon and Mangialavori35). Thus, our findings are more alarming when compared with such studies, considering that a higher UPF consumption is related to the establishment of unhealthy dietary patterns and contributes to overweight and obesity development(Reference Pérez-Escamilla, Segura-Pérez and Lott1,14,Reference da C Louzada, Ricardo and Steele15) .
Concerning the type of UPF that mainly contributes to the daily energy intake, our results also corroborate other studies. Batalha et al. (2017) and Dallazen et al. (2018) present a high contribution of cookies, pastries and cakes, sugar-sweetened beverages, and, especially infant and child food products and milk-sweetened beverages, often offered to the child as a breast milk substitute or as a supposed healthy food option(Reference Batalha, França and Conceição11,Reference Dallazen, Silva and Gonçalves36) .
In our study, as recommended by the Brazilian dietary guidelines(32,37) , unprocessed, minimally processed foods and processed culinary ingredients had a greater contribution to the energy intake of children. Although processed and UPF represented a smaller contribution to the total energy intake, it accounted for more than a third of total energy consumed by children under 2 years old. Compared with the group of unprocessed, minimally processed foods and processed culinary ingredients, processed and UPF were higher carbohydrate and lower fibre and protein contributors. Processed and UPF were also lower contributors to micronutrients, such as folate, phosphorus, potassium and niacin, similar to the observations in previous studies(Reference da C Louzada, Ricardo and Steele15,Reference O’Halloran, Lacy and Woods38–Reference Martínez Steele, Popkin and Swinburn40) . We found that average intake of iron, retinol and vitamin D was higher in Group 2. However, many foods with voluntary fortification of vitamins and minerals do not offer a nutritional equivalence compared with unprocessed and minimally processed foods, and micronutrient natural sources. In addition, the UPF consumption is related to the decline of unprocessed and minimally processed foods consumption, increasing unfavourable outcomes for health(Reference Cirino, De Vargas Zanini and Gigante41). Thus, we should not consider UPF as a micronutrient source or recommend their consumption, especially in early life and regarding their overall nutritional profile. Still regarding the micronutrient intake, we highlight the high overall sodium intake. Although the present study is unable to assess inadequate micronutrient intake, high sodium intake should be considered, as it is higher than the recommended intake and can be associated with negative long-term health outcomes(42).
We found that an increase in energy intake from processed and UPF raises the daily energy intake from carbohydrate, total sugar, total fat, saturated fat, protein and the daily intake of sodium and reduces the daily fibre intake. Due to the increase in energy intake, sugars, saturated fat and sodium and low contribution to micronutrient intake, several studies show that UPF are associated with unhealthy dietary patterns and contribute to higher overweight and obesity prevalence(14,Reference da C Louzada, Ricardo and Steele15,Reference Cornwell, Villamor and Mora-Plazas39) . Pan et al. (2014) presented that children who consumed sugar-sweetened beverage in the first 6 months of life had 92 % more chance to become obese in childhood(Reference Pan, Li and Park43). Rauber et al. (2014) showed association between UPF consumption and changes of lipid profiles with higher levels of cholesterol in Brazilian children(Reference Rauber, Campagnolo and Hoffman44). In addition, UPF increase the consumption of sugar, not recommended for children under 2 years old. There is a mounting evidence about the harmful effects of excessive free sugar consumption, related to obesity, diabetes, dyslipidemia and other non-communicable diseases as well as dental caries(45). Furthermore, an adequate protein and fibre intake is necessary for a healthy growth, appetite control and lower risk of obesity, and an adequate consumption of vitamins and minerals is essential for child growth and development, including for cognitive function, protection against infectious diseases and deficiencies(46,47) . The lower percentage contribution of fat from UPF can be explained by the fact that meat and milk, usually with high saturated fat content, were classified as Group 1(Reference Manso, Gallardo and Guerra-Rivas48).
As we evidenced in Brazil(Reference Batalha, França and Conceição11,Reference Karnopp, dos S Vaz and Schafer21,Reference Bielemann, Santos and dos S Costa49,Reference Sparrenberger, Roggia and Dihl50) and worldwide(Reference Cornwell, Villamor and Mora-Plazas39,Reference Martínez Steele, Popkin and Swinburn40,Reference Pries, Huffman and Adhikary51,Reference Cediel, Reyes and Da Costa Louzada52) , UPF has been increasingly introduced earlier in the complementary feeding of children under 2 years old. This scenario is worrying since the early consumption of foods with high energy value is related to a higher energy intake and higher odds of rapid weight gain and overweight(Reference Vos, Kaar and Welsh53–Reference Mennella and Trabulsi55). There is a consistent association between rapid weight gain during infancy and later childhood obesity(Reference Pérez-Escamilla, Segura-Pérez and Lott1,Reference Pietrobelli, Agosti and Palmer6,56) . Furthermore, UPF are often highly palatable, have a lower capacity to induce satiety and can cause overconsumption(14,Reference Gibney, Forde and Mullally57) . It becomes even more concerning as children have an innate preference for sweet taste and more palatable foods, and the exposure of unhealthy foods may magnify their preference for these products(Reference Ventura and Mennella58,Reference Mennella, Bobowski and Reed59) . Considering the first 1000 d as a critical period for childhood obesity prevention, the central role that early feeding practices play in eating habits and food preferences’ establishment and knowing the inappropriate nutritional profile of UPF, their consumption should be avoided in the first 2 years of life and consumed with restriction throughout life(Reference Monteiro, Cannon and Levy10,32,37,Reference Monteiro, Cannon and Lawrence60) . An early introduction of UPF may have consequences for child health and be a major contributor to childhood obesity growth and chronic diseases in adulthood(14,Reference Rauber, Campagnolo and Hoffman44)
Similar to other studies, we found that the consumption of UPF is related to the child’s age, being higher among children over 12 months of age(Reference Batalha, França and Conceição11,Reference Mais, Warkentin and Vega20) . This result can be explained by the greater influence of the environment on older children that can promote unhealthy choices(Reference Sparrenberger, Roggia and Dihl50). The high consumption of UPF also can be associated with low maternal education and family income. It can be related to caregiver’s food patterns and their lack of knowledge on the harmful effects of UPF consumption(Reference Batalha, França and Conceição11,Reference Mais, Warkentin and Vega20,Reference Dallazen, Silva and Gonçalves36) . These issues are magnified due to the intensive advertising of UPF targeted at children and caregivers as a persuasive strategy linking the consumption of low nutritional value foods to the child’s well-being and health(Reference Boyland and Whalen61). It is important to highlight that in early childhood, the family represents the main social influence and the family feeding style can have a meaningful impact on child’s food preferences and obesity risk. Children have a strong observational learning capacity, which refers to the ability to observe, process and imitate what their caregivers do, including eating practice. Thus, as parental feeding behaviour is a key factor in food preferences among infants, parental healthy eating practices is necessary for developing healthy eating habits beginning in childhood(Reference Pérez-Escamilla, Segura-Pérez and Lott1).
Despite government’s efforts and investments in public policies aimed to support actions of food and nutrition education and thus to promote healthy food choices, especially in Primary Health Care, its implementation is insufficient and challenging. It is necessary to improve strategies to promote healthy eating habits by health professionals to caregivers. Several studies present that training professionals for maternal counselling on healthy eating is effective to reduce the consumption of non-recommended foods and to improve dietary patterns among infants(Reference Vazir, Engle and Balakrhisna62–Reference Vitolo, Louzada and Rauber64). In addition, broader actions are needed by government to ensure that caregivers are able to make conscious and healthier food choices, as well as a health-promoting environment for children.
Although our study contributes to the evidence strengthening the importance of evaluating feeding practices by level of food processing, our results need to be interpreted in light of some limitations. First, we have not evaluated usual consumption since we used a single 24-h recall and it does not reflect the eating habits of children and may underestimate individual food consumption. However, we did not aim to assess nutrient intake inadequacy, and the population mean from a single 24-h recall is sufficient to provide a dietary assessment of the children and to evaluate the association between processed and UPF consumption and dietary nutrient intake. Still related to food consumption evaluation, although it is unlikely to affect the association between the consumption of processed and UFP and nutrient intake, we highlight the possibility of underreporting bias for UPF consumption due to the aspects of social desirability. Second, we also highlight the residual confounding as a limitation. We might not have collected or included variables in the statistical model that can play an important role in the association between the consumption of UPF and the nutrient intake. Finally, regarding the sample, we included only children treated in PHU. Nevertheless, in Federal District, the population attended in Primary Health Care of SUS corresponds to 61·26 % of the local population(65).
Conclusions
We found an early and high consumption of UPF among children under 2 years old. We also found that processed and UPF consumption is associated with a poor dietary nutritional quality, since they contributed to increased intake of energy and sugar, and low consumption of fibre, protein and some micronutrients. Our results are concerning especially due to the establishment of food preferences in early life. The food practices in childhood can predict the nutritional and health status throughout life, and the first 2 years of life represent a crucial window of time for the adequate growth and development, and for prevention of obesity and chronic diseases(Reference Pérez-Escamilla, Segura-Pérez and Lott1).
Considering our findings, the recommendations presented in the dietary guidelines for Brazilian children under 2 years of age of not offering UPF at this stage of life and the health repercussions of UFP consumption, it is necessary to promote healthy food consumption among children and caregivers as well as an environment to foster healthy behaviour. Children need healthy feeding practices so they can accept healthy foods and establish long-term healthy dietary patterns. It is crucial to have trained professionals to guide parents and caregivers on adequate food introduction and complementary feeding and to ensure protective measures and access to healthy foods.
Acknowledgements
Acknowledgements: We thank the Brazilian National Council for Scientific and Technological Development (CNPq) and Coordenação de Aperfeiçoamento de Pessoal de Nível Superior – Brasil (CAPES) for their financial support. THMC acknowledges a personal research grant from CNPq (grant number 308630/2017-3). We thank Edina Shisue Miazaki for help with statistical processing of the data. Financial support: This research was funded by the Brazilian National Council for Scientific and Technological Development (CNPq), grant number 446269/2014-0 and by the Coordenação de Aperfeiçoamento de Pessoal de Nível Superior – Brasil (CAPES), Finance Code 001. Conflict of interest: None. Authorship: Conceptualization, methodology, investigation, AMS and MBG; software, AMS and THMC; formal analysis, AMS and MBG; resources, supervision and funding acquisition, MBG and THMC; data curation, AMS; writing – original draft preparation, AMS; writing, review and editing, AMS, THMC, ADMS and MBG. Ethics of human subject participation: This study was conducted according to the guidelines laid down in the Declaration of Helsinki, and all procedures involving research study participants were approved by the Research Ethics Committee of the University of Brasilia and the Research Ethics Committee of the Health Sciences Education and Research Foundation (FEPECS) of the Federal District (under no. 43228515.5.0000.0030). Written informed consent was obtained from all subjects.
Supplementary material
For supplementary material accompanying this paper visit https://doi.org/10.1017/S1368980020004759


