Introduction
As an important gourd crop, watermelon (Citrullus lanatus L.) is an important fruit for people to quench the thirst in summer, and is known as the ‘king of fruits’(Li et al., Reference Li, Shang, Wang, Zhou, Li and Ma2018). Watermelon rind trait colour and pattern of the rind have been widely studied worldwide since the 16th century (Ramos et al., Reference Ramos, Fu, Michael and Meru2020). However, the study of watermelon rind traits in China is limited, making it difficult to meet the diverse needs of the fruit market and crop genetics. Therefore, it is important to further understand watermelon rind traits to improve fruit quality of watermelon.
The rind traits of watermelon fruit are the most relevant target for consumers (Dia et al., Reference Dia, Wehner, Perkins-Veazie, Hassell, Price, Boyhan, Olson, King, Davis, Tolla, Bernier and Juarez2016; Yan et al., Reference Yan, Xu, Zhang, Huang, Cao and Zhang2022). Novel rind traits can not only meet the needs of different consumers, but also promote the further understanding of the traits (Guo et al., Reference Guo, Zhang, Sun, Salse, Lucas, Zhang, Zheng, Mao, Ren, Wang, Min, Guo, Murat, Ham, Zhang, Gao, Huang, Xu, Zhong, Bombarely, Mueller, Zhao, He, Zhang, Zhang, Huang, Tan, Pang, Lin, Hu, Kuang, Ni, Wang, Liu, Kou, Hou, Zou, Jiang, Gong, Klee, Schoof, Huang, Hu, Dong, Liang, Wang, Wu, Xia, Zhao, Zheng, Xing, Liang, Huang, Lv, Wang, Yin, Yi, Li, Wu, Levi, Zhang, Giovannoni, Wang, Li, Fei and Xu2013; Tian et al., Reference Tian, Ge, Ai, Jiang, Liu, Chen, Liu, Yang, Zhang and Yuan2021). The previous results showed that watermelon skin colour was controlled by a single gene, dark green versus light green was dominant and the gene was located on chromosome 8. The gene controlling watermelon seed coat colour was a gene encoding polyphenol oxidase protein on chromosome 3, and black seed coat was dominant compared with light yellow seed coat. The gene that controls internode length is a gene encoding the gibberellin 3 beta-hydroxylase protein located on chromosome 9. The green striped rind of watermelon variety ‘Su XuanBai’ and dark green banded rind of watermelon variety ‘SHLX21’ are excellent watermelon varieties, which meet the needs of different consumers. However, further improvement of watermelon rind traits is required (Guo et al., Reference Guo, Zhao, Sun, Wang, Wu, Lin, Ren, Gao, Deng, Zhang, Lu, Zhang, Shang, Gong, Wen, He, Tian, Li, Liu, Wang, Zhu, Jarret, Levi, Zhang, Huang, Fei, Liu and Xu2019; Santos-Garcia et al., Reference Santos-Garcia, Mestre-Rincon, Zchori-Fein and Morin2020).
Improved understanding of the molecular mechanisms involved in rind traits provides the basis for watermelon improvement (Chang et al., Reference Chang, Guo, Yan, Zhang, Yuan, Wei, Zhang, Ma, Yang, Zhang and Li2021; Kim et al., Reference Kim, Nguyen, Ahn, Kim and Sim2021). The genome regions and genes regulating watermelon rind traits have been mapped and candidate genes were cloned to analyse the molecular regulation mechanism (Dia et al., Reference Dia, Wehner, Perkins-Veazie, Hassell, Price, Boyhan, Olson, King, Davis, Tolla, Bernier and Juarez2016; Li et al., Reference Li, Guo, Lan, Xu, Chang, Ahammed, Ma, Wei and Zhang2021). At the same time, molecular markers closely linked to rind traits have been developed to provide the scientific basis for the combination of molecular marker-assisted breeding (Guo et al., Reference Guo, Zhang, Sun, Salse, Lucas, Zhang, Zheng, Mao, Ren, Wang, Min, Guo, Murat, Ham, Zhang, Gao, Huang, Xu, Zhong, Bombarely, Mueller, Zhao, He, Zhang, Zhang, Huang, Tan, Pang, Lin, Hu, Kuang, Ni, Wang, Liu, Kou, Hou, Zou, Jiang, Gong, Klee, Schoof, Huang, Hu, Dong, Liang, Wang, Wu, Xia, Zhao, Zheng, Xing, Liang, Huang, Lv, Wang, Yin, Yi, Li, Wu, Levi, Zhang, Giovannoni, Wang, Li, Fei and Xu2013; Li et al., Reference Li, Shang, Wang, Zhou, Li and Ma2018).
As ‘Su XuanBai’ and ‘SHLX21’ are very popular watermelon varieties for consumers and merchants (Guo et al., Reference Guo, Zhao, Sun, Wang, Wu, Lin, Ren, Gao, Deng, Zhang, Lu, Zhang, Shang, Gong, Wen, He, Tian, Li, Liu, Wang, Zhu, Jarret, Levi, Zhang, Huang, Fei, Liu and Xu2019; Mandal et al., Reference Mandal, Suren and Kousik2020), breeding from these varieties can improve the diversity of watermelon phenotype and meet the needs of different consumers. At present, however, there are few studies on the genes controlling watermelon rind traits in ‘Su XuanBai’ and ‘SHLX21’ which is the focus of our study.
With the completion of watermelon genome sequencing, some important traits of watermelon QTLs have been mapped (Park et al., Reference Park, Kim, Kang and Yang2016; Umer et al., Reference Umer, Bin Safdar, Gebremeskel, Zhao, Yuan, Zhu, Kaseb, Anees, Lu, He, Gong and Liu2020). Ren and co-workers constructed the complete watermelon genetic map (Qin et al., Reference Qin, Jiang, Lu, Zhao, Wu, Li, Wang, Xu, Sun and Liu2020; Wang et al., Reference Wang, Zhang, Xu, Yang, Dou, Liu, Zhu, Zhu, Hu, Ma, Yang and Sun2022) and mapped the QTLs of 12 important economic traits of watermelon (Sun et al., Reference Sun, Zhang, Fan, He and Guo2020; Wang et al., Reference Wang, Bo, Gu, Pan, Li, Chen, Wen, Ren, Ren, Chen, Grumet and Weng2020). However, the current genetic maps only locate the QTLs with very few candidate genes and improved resolution of the genetic map to identify further trait genes is required.
In this study, ‘Su XuanBai’ and ‘SHLX21’ were used as parents to prepare an F 2 hybrid population for detailed analysis. We also mapped candidate genes controlling the watermelon traits using bulk segregant analysis (BSA) sequencing (Xie et al., Reference Xie, Xu, Wang, Liu, Zhou, Luo, Huang, He, Li, Peng, Yang, Yuan, Yu, Wang, Lucas, Huang, Jiang and Zhang2019), and polymorphism analysis in the population. BSA involves sequencing DNA from pools of contrasting traits and, combined with second-generation sequencing technology, can be used to achieve the initial mapping of target genes more economically and efficiently (Sun et al., Reference Sun, Zhang, Fan, He and Guo2020; Liu et al., Reference Liu, Philp, Wang, Hu, Wei, Li, Ryder, Toh, Zhou, Denton, Wu and Yang2022). Furthermore, genomic regions linked to the traits were developed and validated in populations. The study therefore advances the study of the genetics of traits segregating in the ‘Su XuanBai’ and ‘SHLX21’ population and also develops the corresponding molecular markers that further improve the watermelon.
Materials and methods
Plant materials and plant culture
The star watermelon varieties ‘Su XuanBai’ and ‘SHLX21’ were selected as plant materials in this study, and two of them were high generation inbred lines selected by the breeding group of Horticulture Research Institute of Ningxia Academy of Agriculture and Forestry Sciences. ‘Su XuanBai’ is a round fruit with a base-colour of light green, covered with the green striped rind and ‘SHLX21’ is also round fruit, but fruit base-colour is dark green, covered with dark green banded rind. ‘SuXuanBai’ and ‘SHLX21’ were used as female parent P 1 and male parent P 2, respectively. F 1 population was obtained through artificial pollination hybridization, F 1 population was self-crossbred to obtain the F 2 population and F 2 population crossbred with P 1 and P 2 parents to obtain the BC1P1 and BC1P2 populations, respectively. The experimental plants were planted in the experimental garden of Ningxia Academy of Agriculture and Forestry Sciences in May 2021. Seedlings were raised and transplanted, and the cultivation mode of deep furrow and wide ridge was adopted. The row spacing was 3.5 m and plant spacing was 0.4 m. All the plants had plastic film covering, twin-vine pruning and female flowers pollinated. The male and female flowers were capped at the day before flowering, and artificial pollination was carried out around 9:00 am the next day. Field fertilization, irrigation and other management measures were consistent with common field planting. Before watermelon appeared, the daytime temperature should be controlled at 28–32°C, and the night temperature should be 18–20°C. After the emergence of seedlings, the daytime temperature dropped to 20–28°C to prevent the tall seedlings. After the first leaf appeared, the daytime temperature was adjusted to 15–18°C to promote the seedling, watering and fertilization and the water content of the matrix was controlled at about 60%.
Statistical identification of watermelon rind traits
The scientific and reliable method to identify the maturity of watermelon in the field is the ripening stage labelling. The different rind traits of watermelon were identified by visual inspection for 20 days after the fruit maturation. The plant numbers of parent and progeny populations P 1, P 2, F 1, F 2, BC1P1 and BC1P2 were 30, 30, 30, 322, 301 and 180, respectively. Then, statistical and significance analyses were carried out on rind traits of watermelon.
DNA extraction and pool construction
Genomic DNA from young rinds was extracted using a cetyltrimethylam-monium bromide-based protocol (Li et al., Reference Li, An, Xia, Bai and Wu2017; Guo et al., Reference Guo, Zhao, Sun, Wang, Wu, Lin, Ren, Gao, Deng, Zhang, Lu, Zhang, Shang, Gong, Wen, He, Tian, Li, Liu, Wang, Zhu, Jarret, Levi, Zhang, Huang, Fei, Liu and Xu2019b). The concentration and quality of the total genomic DNA were determined using a NanoDrop2000 Spectrophotometer (Thermo Fisher Scientific, USA). The different rind traits of plants were selected from an F 2 population and an equal amount of DNA from each plant in each group was mixed to form resistant pool (R-pool) and susceptible pool (S-pool) at a final concentration of 40 ng/μl.
Sequencing library construction and high-throughput sequencing
DNA libraries (350 bp) for Illumina/BGI sequencing were constructed for each accession according to the manufacturer's specifications (Guo et al., Reference Guo, Zhang, Sun, Salse, Lucas, Zhang, Zheng, Mao, Ren, Wang, Min, Guo, Murat, Ham, Zhang, Gao, Huang, Xu, Zhong, Bombarely, Mueller, Zhao, He, Zhang, Zhang, Huang, Tan, Pang, Lin, Hu, Kuang, Ni, Wang, Liu, Kou, Hou, Zou, Jiang, Gong, Klee, Schoof, Huang, Hu, Dong, Liang, Wang, Wu, Xia, Zhao, Zheng, Xing, Liang, Huang, Lv, Wang, Yin, Yi, Li, Wu, Levi, Zhang, Giovannoni, Wang, Li, Fei and Xu2013; Guo et al., Reference Guo, Zhao, Sun, Wang, Wu, Lin, Ren, Gao, Deng, Zhang, Lu, Zhang, Shang, Gong, Wen, He, Tian, Li, Liu, Wang, Zhu, Jarret, Levi, Zhang, Huang, Fei, Liu and Xu2019). After DNA library construction, sequencing was performed on an Illumina HiSeqXTen/NovaSeq/BGI platform by a commercial service (Biomarker Technologies, Beijing, China), with 150-bp read lengths. Raw reads were filtered based on the following criteria: pair-end reads with >10% ‘N’ bases; Reads, on which more than 50% of the bases have a quality score less than 20 (Phred-like score); Sequencing adapter. Finally, high-quality sequences were obtained for subsequent analyses.
SNP and InDel calling
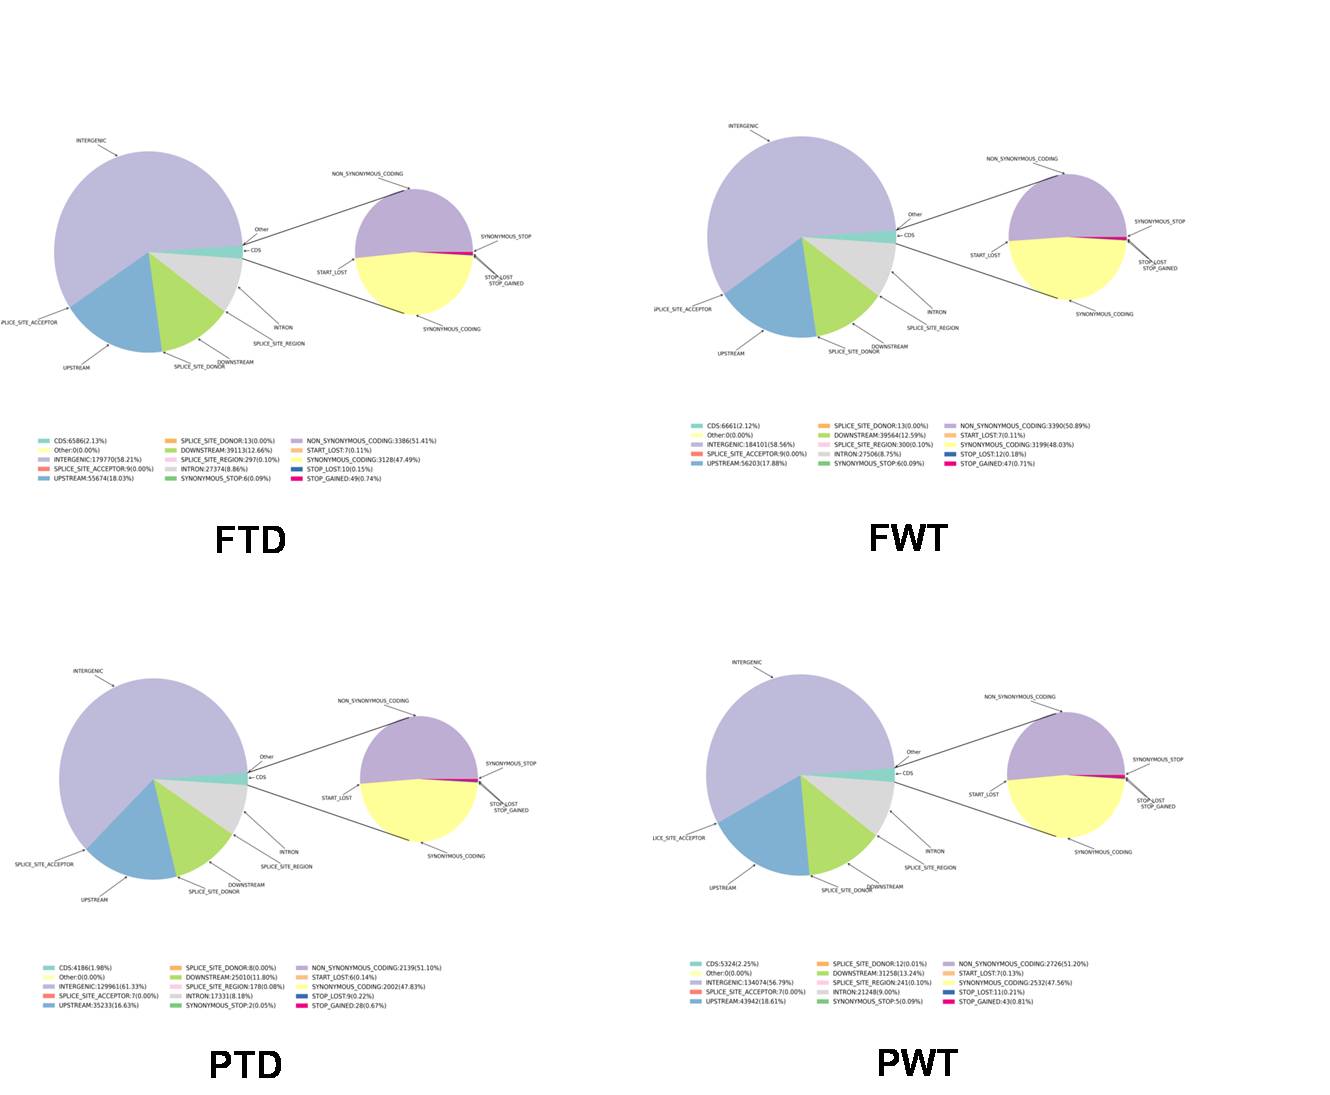
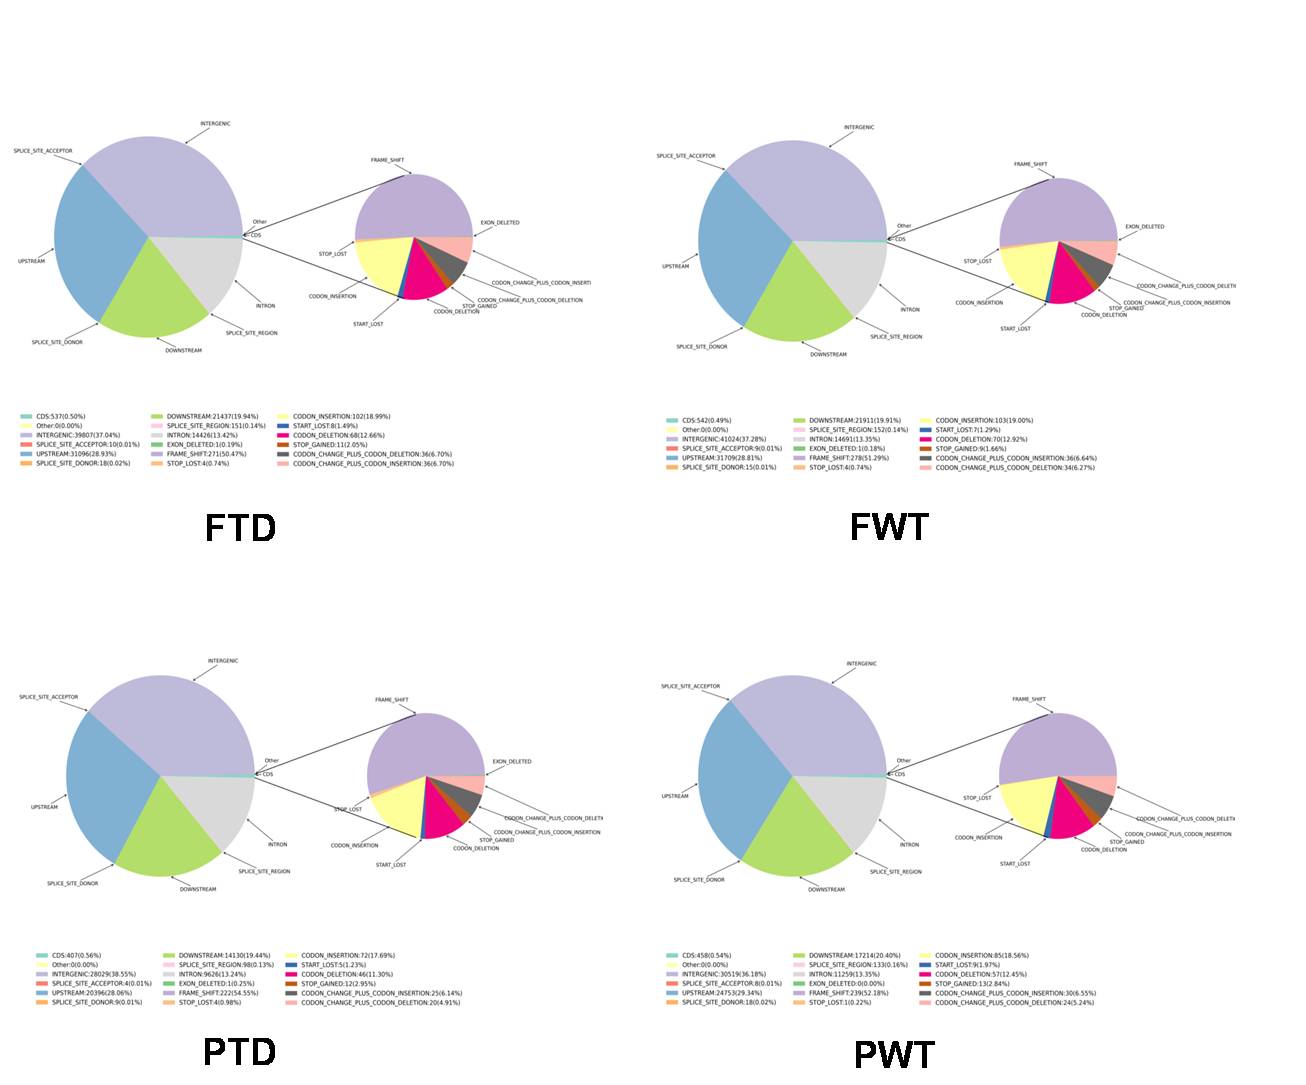
All clean reads for each accession were mapped to reference genome using the MEM algorithm of Burrows-Wheeler Aligner (BWA 0.7.10-r789) (Cui et al., Reference Cui, Ding, Zhu, Wu, Qiu and Gao2021; Volino-Souza et al., Reference Volino-Souza, de Oliveira, Conte-Junior and Alvares2023).The average mapping rates were xx%, and the average coverage rates were xx-fold for the reference genome. The mapping results were sorted, and duplicate reads were marked using SAMTOOLS (v1.3.1) and PICARD (http://broadinstitute.github.io/picard/;v1.94). Local realignment around InDel regions was performed by InDel-Realigner in GATK (v3.8). Single nucleotide polymorphisms (SNPs) and InDels within the xx accessions were called using the HaplotypeCaller module in GATK and were filtered with the following parameters: QD<2.0||MQ < 40.0||FS > 60.0||QUAL < 30.0||MQrankSum < −12.5||ReadPosRankSum < –8.0-clusterSize 2-clusterWindowSize 5. The SNPs identified by GATK were further filtered: only SNPs with a minor allele frequency greater than xx% and less than xx% missing data were considered as high-quality SNPs. Finally, xx high-quality SNPs were obtained. SNP annotation was performed on the basis of the reference genome using SNP-Eff software, and SNPs were categorized into intergenic regions, upstream or downstream regions, and exons or introns. SNPs in coding exons were further classified as synonymous SNPs or non-synonymous SNPs. InDels in exons were grouped according to whether they led to a frameshift.
Association analysis
The Euclidean distance (ED) is a method of searching markers with significant differences between the pools according to the sequencing data and evaluating the associated regions between markers and traits (Dong et al., Reference Dong, Wang, Jin, Xing, Fang, Zhang, Zou, Wang and Xu2020). The depth of each base in different pools and the ED value of each SNP locus were calculated. To eliminate the background noise, the ED value was powered, and the ED to the fifth power was used as the associated value.
Calculating SNP-index is an association analysis method to find the significant differences of genotype frequency between the pools, indicated by Δ(SNP-index) (Guo et al., Reference Guo, Zhang, Sun, Salse, Lucas, Zhang, Zheng, Mao, Ren, Wang, Min, Guo, Murat, Ham, Zhang, Gao, Huang, Xu, Zhong, Bombarely, Mueller, Zhao, He, Zhang, Zhang, Huang, Tan, Pang, Lin, Hu, Kuang, Ni, Wang, Liu, Kou, Hou, Zou, Jiang, Gong, Klee, Schoof, Huang, Hu, Dong, Liang, Wang, Wu, Xia, Zhao, Zheng, Xing, Liang, Huang, Lv, Wang, Yin, Yi, Li, Wu, Levi, Zhang, Giovannoni, Wang, Li, Fei and Xu2013; Li et al., Reference Li, Guo, Lan, Xu, Chang, Ahammed, Ma, Wei and Zhang2021). In this study, P and M stand for male (susceptible) and female (resistant) parents, while aa and ab mean R-pool and S-pool, respectively. TheΔ(SNP-index) was calculated as follows: SNP-index(aa) = Maa/(Paa + Maa), SNP-index(ab) = Mab/(Pab + Mab), Δ(SNP-index) = SNP-index(aa)-SNP-index(ab), in which Maa was the depth of aa population derived from Maa and Paa was the depth of aa population derived from P; Mab indicates the depth of ab population derived from Mab and Pab indicates the depth of ab population derived from P. As we used F 2 population, the upper limit Δ(SNP-index) value of the trait-associated tags is expected to be 0.5. To determine and obtain the association-threshold, we carried out a sliding window analysis with the planta database. The regions over the threshold were considered as trait-related candidate regions. The candidate regions were annotated by Kyoto Encyclopedia of Genes and Genomes (KEGG), Clusters of Orthologous Groups (COG), Gene Ontology (GO) and other databases, and candidate genes were mined by mutation locus analysis to obtain candidate genes that may control the formation of watermelon bands and mesh strips.
Real-time quantitative PCR (RT-qPCR) analysis
Total plant sample RNA was extracted from the young rinds using TRNzol Universal kit (TIANGEN BIOTECH, China). The cDNA template was synthesized by reverse transcription reaction using TUREscript 1st Stand cDNA Synthesis Kit (Aidlab Biotechnologies, Beijing, China) by PCR analytikjena-Easycycler (Analytik Jena, Germany), and RT-qPCR experiment was performed by analytikjena-qTOWER2.2 quantitative PCR instrument (Analytik Jena, Germany). The primers were obtained from the Sangon Biotech. Co., Ltd. (online Supplementary Table S1, Shanghai, China). The reaction procedure was used as follows: pre-denaturation at 95°C for 3 min, denaturation at 95°C for 10 s, annealing at 60°C for 30 s, extension at 72°C for 20 s and 40 cycles. The relative expression of target genes was calculated with 2−ΔΔCt. 18S was used as the internal reference for RT-qPCR.
Statistical analysis
The classical scientific software GraphPad Prism5.0 was used for data statistical analysis. The data were expressed as mean ± standard deviation. The t-test was used for comparison between the two groups and one-way ANOVA analysis of variance was used among the multiple groups. P < 0.05 was considered statistically significant. The analysed data were plotted using GraphPad Prism 5.0 software.
Results
Genetic identification of watermelon rind traits
In this study, F 2 hybrid population, BC1P1 population and BC1P2 population were prepared using ‘SHLX21’ (P 2) and ‘Su XuanBai’ (P 1). According to the statistical phenotype, it was found that the population was in line with the gene separation ratio of 3:1 (the ratio of the green striped rind/the dark green banded rind), BC1P2 population was in line with the separation ratio of 1:1 (the green striped rind/the dark green banded rind), and all the watermelon rind traits of BC1P1 population were the green striped rind, as shown in Fig. 1. The results showed that the watermelon rind traits were controlled by single or multiple genes, and the green striped rind traits were dominant to the stripe traits.

Figure 1. Watermelon peel phenotype of Su XuanBai and SHLX21.
Comparative sequencing analysis with reference genomes
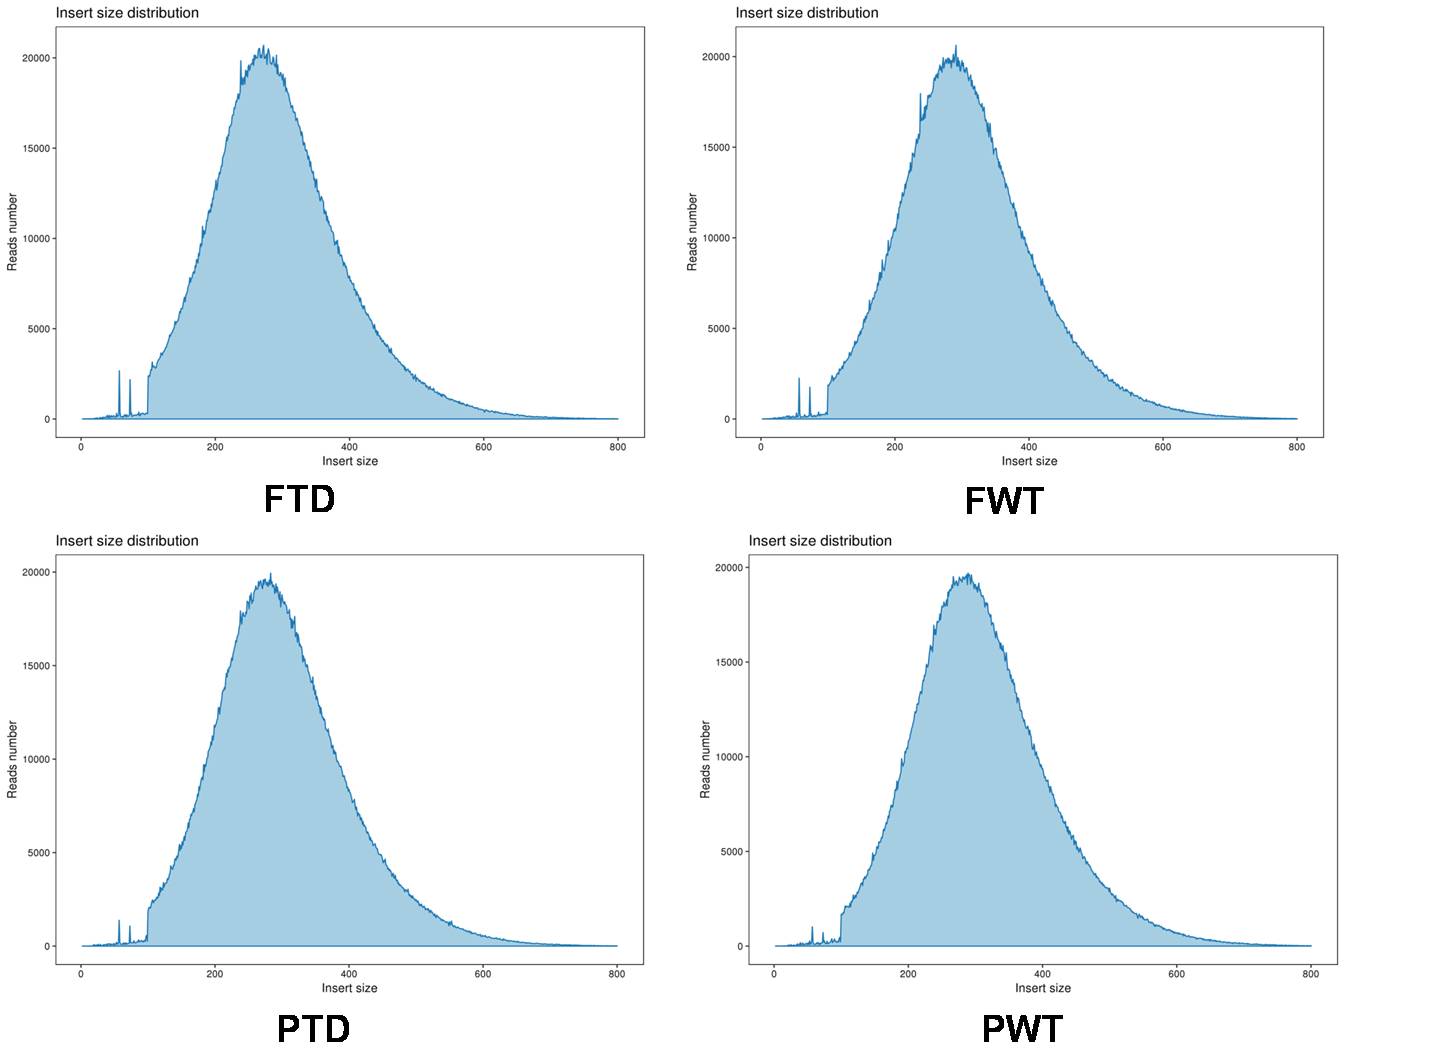
In order to further explore the genetics of watermelon rind traits, sequencing reads obtained by re-sequencing were repositioned on the reference genomes. We found that the average comparison efficiency of the four samples (sample code FTD stands for planting and development period 1, sample code FWT stands for planting and development period 2, sample code PTD stands for planting and development period 3 and sample code PWT stands for planting and development period 4) were 88.83, 89.18, 87.63 and 89.30, respectively, indicating that the sequencing results of the four samples were reliable and accurate. In addition, we analysed the size distribution of inserted fragment of each sample, and the results showed that the length distribution of inserted fragment of each sample was in line with normal distribution, indicating that there was no abnormality in the construction of sequencing data libraries of each sample (online Supplementary Fig. S1).
Genome coverage could reflect the integrity of gene variation on the reference genome (Li et al., Reference Li, Shang, Wang, Zhou, Li and Ma2018; Mandal et al., Reference Mandal, Suren and Kousik2020). Coverage was mainly affected by sequencing depth and the distance between the samples and the reference genome (Park et al., Reference Park, Kim, Kang and Yang2016; Wang et al., Reference Wang, Wang, Zhang, Ren, Li, Tian, Yu, Zuo, Gong, Zhang, Guo and Xu2021a). At the same time, the depth of genome coverage will affect the accuracy of mutation detection (Qin et al., Reference Qin, Jiang, Lu, Zhao, Wu, Li, Wang, Xu, Sun and Liu2020). Therefore, we made the statistics on the depth and coverage of the genomes, and found that the average coverage depth of the genomes was about 25.50X, and the coverage of the genomes was about 99.72%. More importantly, the coverage of the genomes was relatively uniform, indicating the gene variation detection was highly accurate. In addition, the uneven depth of the map might be caused by repetitive sequences and PCR bias (Fig. 2).

Figure 2. Depth distribution of chromosome coverage of FTD, FWT, PTD and PWT.
SNP detection and InDel detection in the watermelon rind traits
For diploid or polyploid species, a single SNP on homologous chromosomes is called a homozygous SNP (Ramos et al., Reference Ramos, Fu, Michael and Meru2020). If an SNP on a homologous chromosome contains a different type of base, it is called a heterozygous SNP (Santos-Garcia et al., Reference Santos-Garcia, Mestre-Rincon, Zchori-Fein and Morin2020; Umer et al., Reference Umer, Bin Safdar, Gebremeskel, Zhao, Yuan, Zhu, Kaseb, Anees, Lu, He, Gong and Liu2020). The more homozygous SNPs, the greater the difference between the samples and the reference genomes. However, the more heterozygous SNPs, the higher the heterozygous degree of the samples (Wang et al., Reference Wang, Bo, Gu, Pan, Li, Chen, Wen, Ren, Ren, Chen, Grumet and Weng2020; Xiao et al., Reference Xiao, Chen, Sun, Yang and He2022). Similarly, small InDel variation is generally less than SNP variation, which also reflects the difference between samples and reference genomes. Moreover, coding region InDel will cause frameshift mutation, resulting in changes in gene function.
In this study, SNP detection results showed that a total of 208,240 SNPs were obtained between parents, including 2191 non-synonymous mutations. A total of 52,065 SNPs were obtained from mixed pools, and 601 SNPs caused non-synonymous mutations. At the same time, small InDel detection results showed that a total of 75,345 small InDel were also obtained between parents. At the same time, a total of 28,857 small InDel were obtained between mixed pools (Fig. 3(A)—(D)). Furthermore, we found that gene mutations of samples were monotonous, and the diversity of watermelon rind traits might be caused by gene linkage regulation on a chromosome through SNP and small InDel detection (online Supplementary Figs S2 and S3).

Figure 3. SNP and small InDel detection of FTD, FWT, PTD and PWT. (A) Genome-wide SNP mutations; (B) Venn diagram of SNP statistics among samples; (C) InDel length distribution of whole genome and coding region; (D) Small InDel statistical Venn diagram among samples.
Correlation analysis and candidate genome regions prediction in the watermelon rind traits
SNP-index is an important indicator in recent years to carry out gene markers based on genotype frequency differences between mixed pools. It mainly seeks for significant genotype frequency differences between mixed pools and uses Δ (SNP-index) to perform the statistics. The stronger the correlation between SNPs and traits, the closer Δ(SNP-index) is to 1. In this study, SNPNUM was used to fit the ΔSNP-index, and then regions of watermelon rind traits were selected, according to association thresholds. The results showed that the theoretical separation ratio of the groups and the calculated association threshold were 0.667. In theory, the target sites and adjacent linkage sites should approach this threshold, so there should be a high peak near the regions of significant association. However, no QTLs exceeded the theoretical threshold, indicating that the positioning results in this study were not very significant. Moreover, the threshold was lowered to search for potential loci. The 99% of ΔSNP-index was used to obtain a total of 56 loci with a total length of 0.95 Mb, containing 145 genes, and 72 non-synonymous mutation sites. Meanwhile, the candidate gene regions were located on chromosome 6. The intersection of the SNP and ED was used to obtain the 12 candidate QTLs with a total length of 0.05 Mb (Fig. 4(A) and (B)). At the same time, we found that the intersection of the small InDel and ED resulted in seven candidate QTLs related to watermelon rind traits with a total length of 1.00 Mb (Fig. 4(C) and (D)). To sum up, the intersection of above correlation regions was obtained with a total of eight candidate QTLs related to watermelon rind traits, with a total length of 0.02 Mb. The correlation regions contained six genes, including three non-synonymous mutation genes and zero coding mutation genes.

Figure 4. SNP, small InDel detection and ED association analysis. (A) The distribution of ED correlation values on chromosomes in SNP detection; (B) Distribution of SNP-index correlation values on chromosomes; (C) The distribution of ED correlation values on chromosomes in small InDel detection; (D) Distribution of small InDel–index correlation values on chromosomes.
Furthermore, GO and KEGG analysis of SNP detection and small InDel detection showed that the correlation regions mainly focus on the intracellular membrane-bounded organelle, intrinsic component of membrane and membrane-bounded organelle (Fig. 5(A) and (B)), indicating that the candidate QTLs and genes we screened could be closely related to watermelon rind traits and the results were in line with our expectations.

Figure 5. Visualization of variation results and BSA association analysis. (A) Visualized distribution of results on chromosomes between samples in SNP detection; (B) Visualized distribution of results on chromosomes between samples in small InDel detection.
Functional prediction of potential candidate genes
Based on the correlation analysis and candidate genome regions prediction in the watermelon rind traits, six putative genes were annotated (Cla97C06G126670, Cla97C06G127120, Cla97C06G127130, Cla97C06G127140, Cla97C06G127150 and Cla97C06G127470) in the 0.02 Mb interval. RT-qPCR of these putative genes with watermelon rind traits indicated that Cla97C06G126670, Cla97C06G127140 and Cla97C06G127150 were significantly differentially expressed between ‘SuXuanBai’ and ‘SHLX21’ samples (Fig. 6). Although there was no significant difference in the expression of Cla97C06G127120, Cla97C06G127130 and Cla97C06G127470 between ‘SuXuanBai’ and ‘SHLX21’ samples (Fig. 6), the three genes were located near the QTLs, which might play an important role in the diversity of watermelon rind traits, and the molecular mechanism of potential candidate genes should be further explored in depth.

Figure 6. RT-qPCR results of corresponding genes in candidate regions. Data represent mean ± SD. NS, non-significant difference, *P < 0.05, **P < 0.01 versus the SHLX21 samples.
Discussion
In this study, we demonstrated that watermelon rind traits of ‘Su XuanBai’ and ‘SHLX21’ were controlled by a single gene or closely linked genes, and green striped rind was dominant to dark green banded rind. In this study, firstly, we identified a total of eight quantitative trait loci (QTLs) related to watermelon rind traits on chromosome 6. Secondly, a total of 208,240 SNPs and 75,345 small Indels (insertions/deletions) were detected in the two parents by high-coverage re-sequencing, respectively. Based on the genetic variation of the two parents and combined with GO and KEGG analysis using the planta database, the QTL region was reduced to 0.02 Mb. Finally, we identified the six potential regulatory factors (Cla97C06G126670, Cla97C06G127120, Cla97C06G127130, Cla97C06G127140, Cla97C06G127150 and Cla97C06G127470) for watermelon rind traits using RT-qPCR. In conclusion, our results revealed the fine localization of candidate genes for watermelon rind traits and the successful discovery of candidate genes for regulating watermelon rind traits for the first time in the world, which is of importance for watermelon rind traits and breeding-improved watermelon varieties. Furthermore, our results could be applied to molecular marker-assisted breeding for improved rind traits in watermelon in the world. The chromosome 6 of watermelon genome may have a gene mutation of watermelon rind traits in the evolutionary process, which may have a polyvalent effect, controlling not only dark green banded rind, but also leaf vein and petiole dark green. However, in this study, the growth and development of plants with leaves and petioles were not studied, so it was inferred that these QTLs might play a very important role in controlling photosynthesis of watermelon and this is what we need to focus on in the future.
Before our research results, there are no candidate genes for controlling the excellent watermelon rind traits in chromosome regions. Although two watermelon reference genomes have been assembled at present, there are still many gaps in the chromosome regions (Zhou et al., Reference Zhou, Xiong, Li, Guo, Xie, Zhao, Gu, Zhao, Ding, Song and Liu2020). In this study, we explained the genetic mechanisms of watermelon rind traits of ‘Su XuanBai’ and ‘SHLX21’ for the first time in the world, providing an ideal starting point for the excellent watermelon varieties domestication and selecting. Our results could be applied to molecular marker-assisted breeding for improved rind traits in watermelon in the future.
Supplementary material
The supplementary material for this article can be found at https://doi.org/10.1017/S1479262123000813
Acknowledgments
This work was financially supported by the Ningxia Natural Science Foundation Project (NO. 2020AAC03320) and Scientific and Technological Innovation Demonstration Project for high-quality agricultural development and ecological protection (NGSB-2021-7-02).