


1 Introduction
Since it was proposed in 1979[Reference Tajima and Dawson1], laser wakefield acceleration (LWFA) has attracted a lot of attention of many groups around the world. Attributed to its ultra-high acceleration gradients  $({\sim}1~\text{GV}~\text{cm}^{-1})$, the LWFA scheme might be considered as a basis for future compact electron–positron colliders[Reference Esarey, Schroeder and Leemans2–Reference Leemans and Esarey5] and ultra-compact x-ray free-electron lasers[Reference Huang, Ding and Schroeder6, Reference Maier, Meseck, Reiche, Schroeder, Seggebrock and Grüner7]. The LWFA research has achieved a significant breakthrough in 2004[Reference Geddes, Toth, Tilborg, Esarey, Schroeder, Bruhwiler, Nieter, Cary and Leemans8–Reference Faure, Glinec, Pukhov, Kiselev, Gordienko, Lefebvre, Rousseau, Burgy and Malka10] when self-injected quasimonoenergetic electron beams were firstly obtained in experiments under the highly nonlinear ‘bubble’ regime[Reference Pukhov and Meyer-Ter-Vehn11, Reference Lu, Tzoufras, Joshi, Tsung, Mori, Vieira, Fonseca and Silva12]. In this regime, electrons of an underdense plasma produced by pure hydrogen or helium gas jets, are expelled radially by the ponderomotive force of a focused ultra-intense laser pulse, leading to form a nearly spherical ionic cavity (bubble) whose size corresponds to the plasma wavelength ${\it\lambda}_{p}$. The bubble propagates together with the laser pulse at a velocity close to the speed of light $c$, and experiences evolution due to the evolution of the laser pulse during its propagation in the plasma. During the variation of bubble size an electron density spike builds up at its back and eventually breaks, causing electron injection[Reference Kalmykov, Yi, Khudik and Shvets13–Reference Hafz, Lee, Jeong and Lee15] inside the bubble. The self-injected electrons witness the longitudinal accelerating field inside the bubble and are accelerated with low energy spread. After 2004, dramatic progress has been made in the LWFA research[Reference Esarey, Schroeder and Leemans2, Reference Leemans, Nagler, Gonsalves, Tóth, Nakamura, Geddes, Esarey, Schroeder and Hooker16–Reference Wang, Zgadzaj, Fazel, Li, Yi, Zhang, Henderson, Chang, Korzekwa, Tsai, Pai, Quevedo, Dyer, Gaul, Martinez, Bernstein, Borger, Spinks, Donovan, Khudik, Shvets, Ditmire and Downer18], including the latest experimental results by Leemans et al. [Reference Leemans, Gonsalves, Mao, Nakamura, Benedetti, Schroeder, Tóth, Daniels, Mittelberger, Bulanov, Vay, Geddes and Esarey19] on the generation of self-injected monoenergetic electrons with energy up to 4.2 GeV, from 9-cm-long capillary discharge waveguide powered by laser pulses with peak power up to 300 TW. However, experimental studies[Reference Froula, Clayston, Döppner, Marsh, Barty, Divol, Fonseca, Glenzer, Joshi, Lu, Martins, Michel, Mori, Palastro, Pollock, Pak, Ralph, Ross, Siders, Silva and Wang20] have shown that the self-injection process is highly nonlinear and uncontrollable as it requires large laser normalized vector potential $a_{0}$, to trigger the injection in single low- $Z$ gas plasma, where $a_{0}=\sqrt{(P\text{(TW)}\times 10^{3})/21.5}\times {\it\lambda}_{0}\;({\rm\mu}\text{m})/w_{0}\;({\rm\mu}\text{m})$, $P$ is the laser power, ${\it\lambda}_{0}$ and $w_{0}$ are the laser’s wavelength and focal spot size.
Recently, a novel electron injection scheme based on ionization[Reference McGuffey, Thomas, Schumaker, Matsuoka, Chvykov, Dollar, Kalintchenko, Yanovsky, Maksimchuk and Krushelnick21–Reference Clayton, Ralph, Albert, Fonseca, Glenzer, Joshi, Lu, Marsh, Martins, Mori, Pak, Tsung, Pollock, Ross, Silva and Froula24] was proposed in order to reduce the laser intensity threshold for electron trapping. This scheme utilizes the high ionization potential of the inner-shell electrons relative to outer-shell electrons of a high- $Z$ doped gas (such as nitrogen) mixed with the usual low- $Z$ host gas (helium or hydrogen) in order to control the initial injection phases of the ionized inner-shell electrons. This regime has been demonstrated in a few experiments[Reference Pak, Marsh, Martins, Lu, Mori and Joshi23, Reference Clayton, Ralph, Albert, Fonseca, Glenzer, Joshi, Lu, Marsh, Martins, Mori, Pak, Tsung, Pollock, Ross, Silva and Froula24]; however, electron beams produced by it usually had very large energy spreads reaching 60%–100%, limiting the applications of those beams. In order to overcome the continuous injection of electrons, a two-stage accelerating configuration was recently proposed[Reference Liu, Xia, Wang, Lu, Wang, Deng, Li, Zhang, Liang, Leng, Lu, Wang, Wang, Nakajima, Li and Xu25, Reference Pollock, Clayton, Ralph, Albert, Davidson, Divol, Filip, Glenzer, Herpoldt, Lu, Marsh, Meinecke, Mori, Pak, Rensink, Ross, Shaw, Tynan, Joshi and Froula26] as the way to achieve small energy-spread (high-quality) electron beams by ionization injection. In such scheme, the injection and acceleration stages were separated and manipulated in two different gas cells or gas jets. However, a single-stage ionization-injection scheme which can overcome the problem of continuous injection (from the doped gas thus generating high-quality electron beams) must be favored for its simple implementation in experiments and applications. The feasibility of a single-stage, self-truncated ionization-injection LWFA of high-quality beams was recently demonstrated[Reference Zeng, Chen, Sheng, Mori and Zhang27, Reference Li, Hafz, Mirzaie, Sokollik, Zeng, Chen, Sheng and Zhang28]. In this scheme, using certain initially unmatched laser spot size (the matched condition[Reference Lu, Tzoufras, Joshi, Tsung, Mori, Vieira, Fonseca and Silva12] is defined as $k_{p}w_{0}\approx 2\sqrt{a_{0}}$, where $k_{p}$ is the plasma wavenumber) and low concentrations of the host gas the ionization-injection condition can be broken due to the self-evolution of the laser pulse and so the wake wave potential, thus shortening the injection length to a few hundred ${\rm\mu}\text{m}$ of the very-front region of the mixed gas target. This limits the energy spread of the final accelerating electron beam to a percent level. It is worth to mention here that the use of a matched laser spot size for the ionization injection will generate electron beams with continuous spectrum; this has been observed in several experiments[Reference McGuffey, Thomas, Schumaker, Matsuoka, Chvykov, Dollar, Kalintchenko, Yanovsky, Maksimchuk and Krushelnick21, Reference Pak, Marsh, Martins, Lu, Mori and Joshi23, Reference Clayton, Ralph, Albert, Fonseca, Glenzer, Joshi, Lu, Marsh, Martins, Mori, Pak, Tsung, Pollock, Ross, Silva and Froula24, Reference Kamperidis, Dimitriou, Mangles, Dangor and Najmudin29].
In order to achieve the self-truncated ionization-injection process, two conditions are required to be satisfied at the same time[Reference Pollock, Clayton, Ralph, Albert, Davidson, Divol, Filip, Glenzer, Herpoldt, Lu, Marsh, Meinecke, Mori, Pak, Rensink, Ross, Shaw, Tynan, Joshi and Froula26]. The first one is to use unmatched laser and plasma parameters. In our experiments, we use relatively large laser spot size of  $w_{0}=28~{\rm\mu}\text{m}$, moderate laser power and moderate helium electron density, so we can reach unmatched parameters of $k_{p}w_{0}\sim 11{-}13$, which is much larger than $2\sqrt{a_{0}}\sim 1.9{-}2.5$. The second condition is to use very low doped (nitrogen) gas concentrations, typically less than 1%. Both conditions are satisfied in our experiments. In this paper, we present detailed experimental results and optimization of the self-truncated ionization-injection scheme which leads us to conclude on the robustness of such interesting scheme for the generation of small energy-spread electron beams.
2 Experiment
The experiment was conducted using a Ti:sapphire 200 TW laser facility at the Key Laboratory for Laser Plasmas of Shanghai Jiao Tong University in China. Here, we briefly describe the upgrade of the basic experimental configuration introduced in previous papers[Reference Li, Hafz, Mirzaie, Ge, Sokollik, Chen, Sheng and Zhang30–Reference Tao, Hafz, Li, Mirzaie, Elsied, Ge, Liu, Sokollik, Chen, Sheng and Zhang32].
2.1 Laser system
Our laser system provides near-IR pulses with the duration of 30 fs, central wavelength of 800 nm, and peak power up to 200 TW. However, in the present experiment, laser pulses with power of 30 TW was used and focused by  $f/20$ off-axis parabolic mirror onto the front edge of a gas jet. The Gaussian $1/e^{2}$ intensity radius of the laser focus spot was $28~{\rm\mu}\text{m}$, giving a Rayleigh length $Z_{r}$ of 3.1 mm, and the Strehl ratio of the focus spot was 0.4–0.5. The peak focused laser intensity and the corresponding normalized vector potential, $a_{0}$, were approximately $1.8\times 10^{18}{-}5.0\times 10^{18}~\text{W}~\text{cm}^{-2}$ and 0.9–1.5, respectively. Those laser parameters clearly do not satisfy the bubble regime of the LWFA which is usually conducted at $a_{0}>3$. In the current self-truncated ionization-injection scheme we realize (see below) that laser parameters we are using are typical for ionization injection but not for self-injection experiments[Reference Chen, Esarey, Schroeder, Geddes and and Leemans22].
2.2 Gas target
The gas target was produced by a 4-mm supersonic slit gas jet which blows a prepared gas mixture of helium and nitrogen. The concentration of the nitrogen gas was in the range of 0.1%–1% relative to the helium concentration. To have an accurate gas mixing ratio, commercially available bottles of industrial standards (mixing error of 0.01%) were used and the gas tubes connecting the bottle to the gas jet were evacuated to the level of  ${\sim}10^{-5}$ mbar before allowing the mixed gases to flow in.

Figure 1. Raw images of electron beam energy spectra for 15 shots divided into 5 groups, each group is for a fixed gas mixture concentration. (a) 3 typical spectra for beams generated from laser-driven pure He gas jet, (b) results for 0.1%  $\text{N}_{2}$ mixed in 99.9% of He, (c) results for 0.3% $\text{N}_{2}$ mixed in 99.7% of He, (d) 0.5% $\text{N}_{2}$ mixed in 99.5% of He, and (e) 1% $\text{N}_{2}$ mixed in 99% of He. For (a–e), the unmatched laser–plasma parameter $k_{p}w_{0}$ is 11.2, 11.8, 13.6, 11.8, and 10.8, respectively. The laser power for all the shots is 30 TW level, and the helium electron density is shown for each group.
The electron density of the laser-produced pure helium plasma was probed by Nomarski interferometer of 100 fs probe beam in a previous experiment[Reference Ma, Chen, Hafz, Li, Huang, Yan, Dunn, Sheng and Zhang33]. The plasma density measured by interferometry was found to be in agreement with the values obtained using fluid-dynamic calculations provided by the manufacturer[Reference Hosokai, Kinoshita, Watanabe, Yoshii, Ueda, Zhidkov, Uesaka, Nakajima, Kan and Kotaki34]. It also agreed well with the forward Raman scattering (FRS) density diagnostics performed earlier for an identical gas jet[Reference Hafz, Choi, Sung, Kim, Hong, Jeong and Yu35]. The gas jet nozzle was positioned below the laser spot with a vertical height of 2 mm and the gas valve was triggered exactly at 4.5 ms before the arrival of the laser pulse. By varying the stagnation pressure of the gas jet from 2 to 4 atm, we could achieve a helium plasma density  $(n_{e})$ of $3.3\times 10^{18}{-}6.7\times 10^{18}~\text{cm}^{-3}$.
2.3 Diagnosis of electron beams
Two DRZ screens ( $\text{Gd}_{2}\text{O}_{2}\text{S}$:Tb x-ray fluorescent screen) are used to detect the electron beams. The first one with an area of $5~\text{cm}\times 5~\text{cm}$ was imaged into a 16-bit CCD camera. It was placed in front of a 6-cm-long permanent dipole magnet to diagnose online the spatial profile and pointing angle of the electron beams. The second DRZ screen with a size of 30 cm (length) $\times$ 10 cm (width), was imaged onto an ICCD camera; it is placed after the magnet to diagnose online energy spectrum of the electron beams deflected by the effective magnetic field of ${\sim}B_{\text{eff}}=0.9~\text{T}$. The distances from the gas jet to the first DRZ screen, to the magnet, and to the second DRZ screen were 72, 81, and 161 cm, respectively. A MATLAB electron trajectory code was written to calculate the electron energy shot to shot, taking into consideration the beam’s pointing angle before magnet based on the method presented in Ref. [Reference Cha, Choi, Kim, Kim, Nam, Jeong and Lee36]. To measure the electron beam energy spread, a computer code was used to deconvolve the energy spectrum from the beam size for each shot. With the 81-cm distance between the magnet entrance and the second DRZ screen, the electron energy resolutions in this experiment are as follows: 1% at 142 MeV, 2.1% at 304 MeV, and 2.8% at 570 MeV. A calibrated integrating current transformer (ICT) coupled with a beam charge monitor (BCM) system (Bergoz) was used to measure the accelerated electron beam charge online.
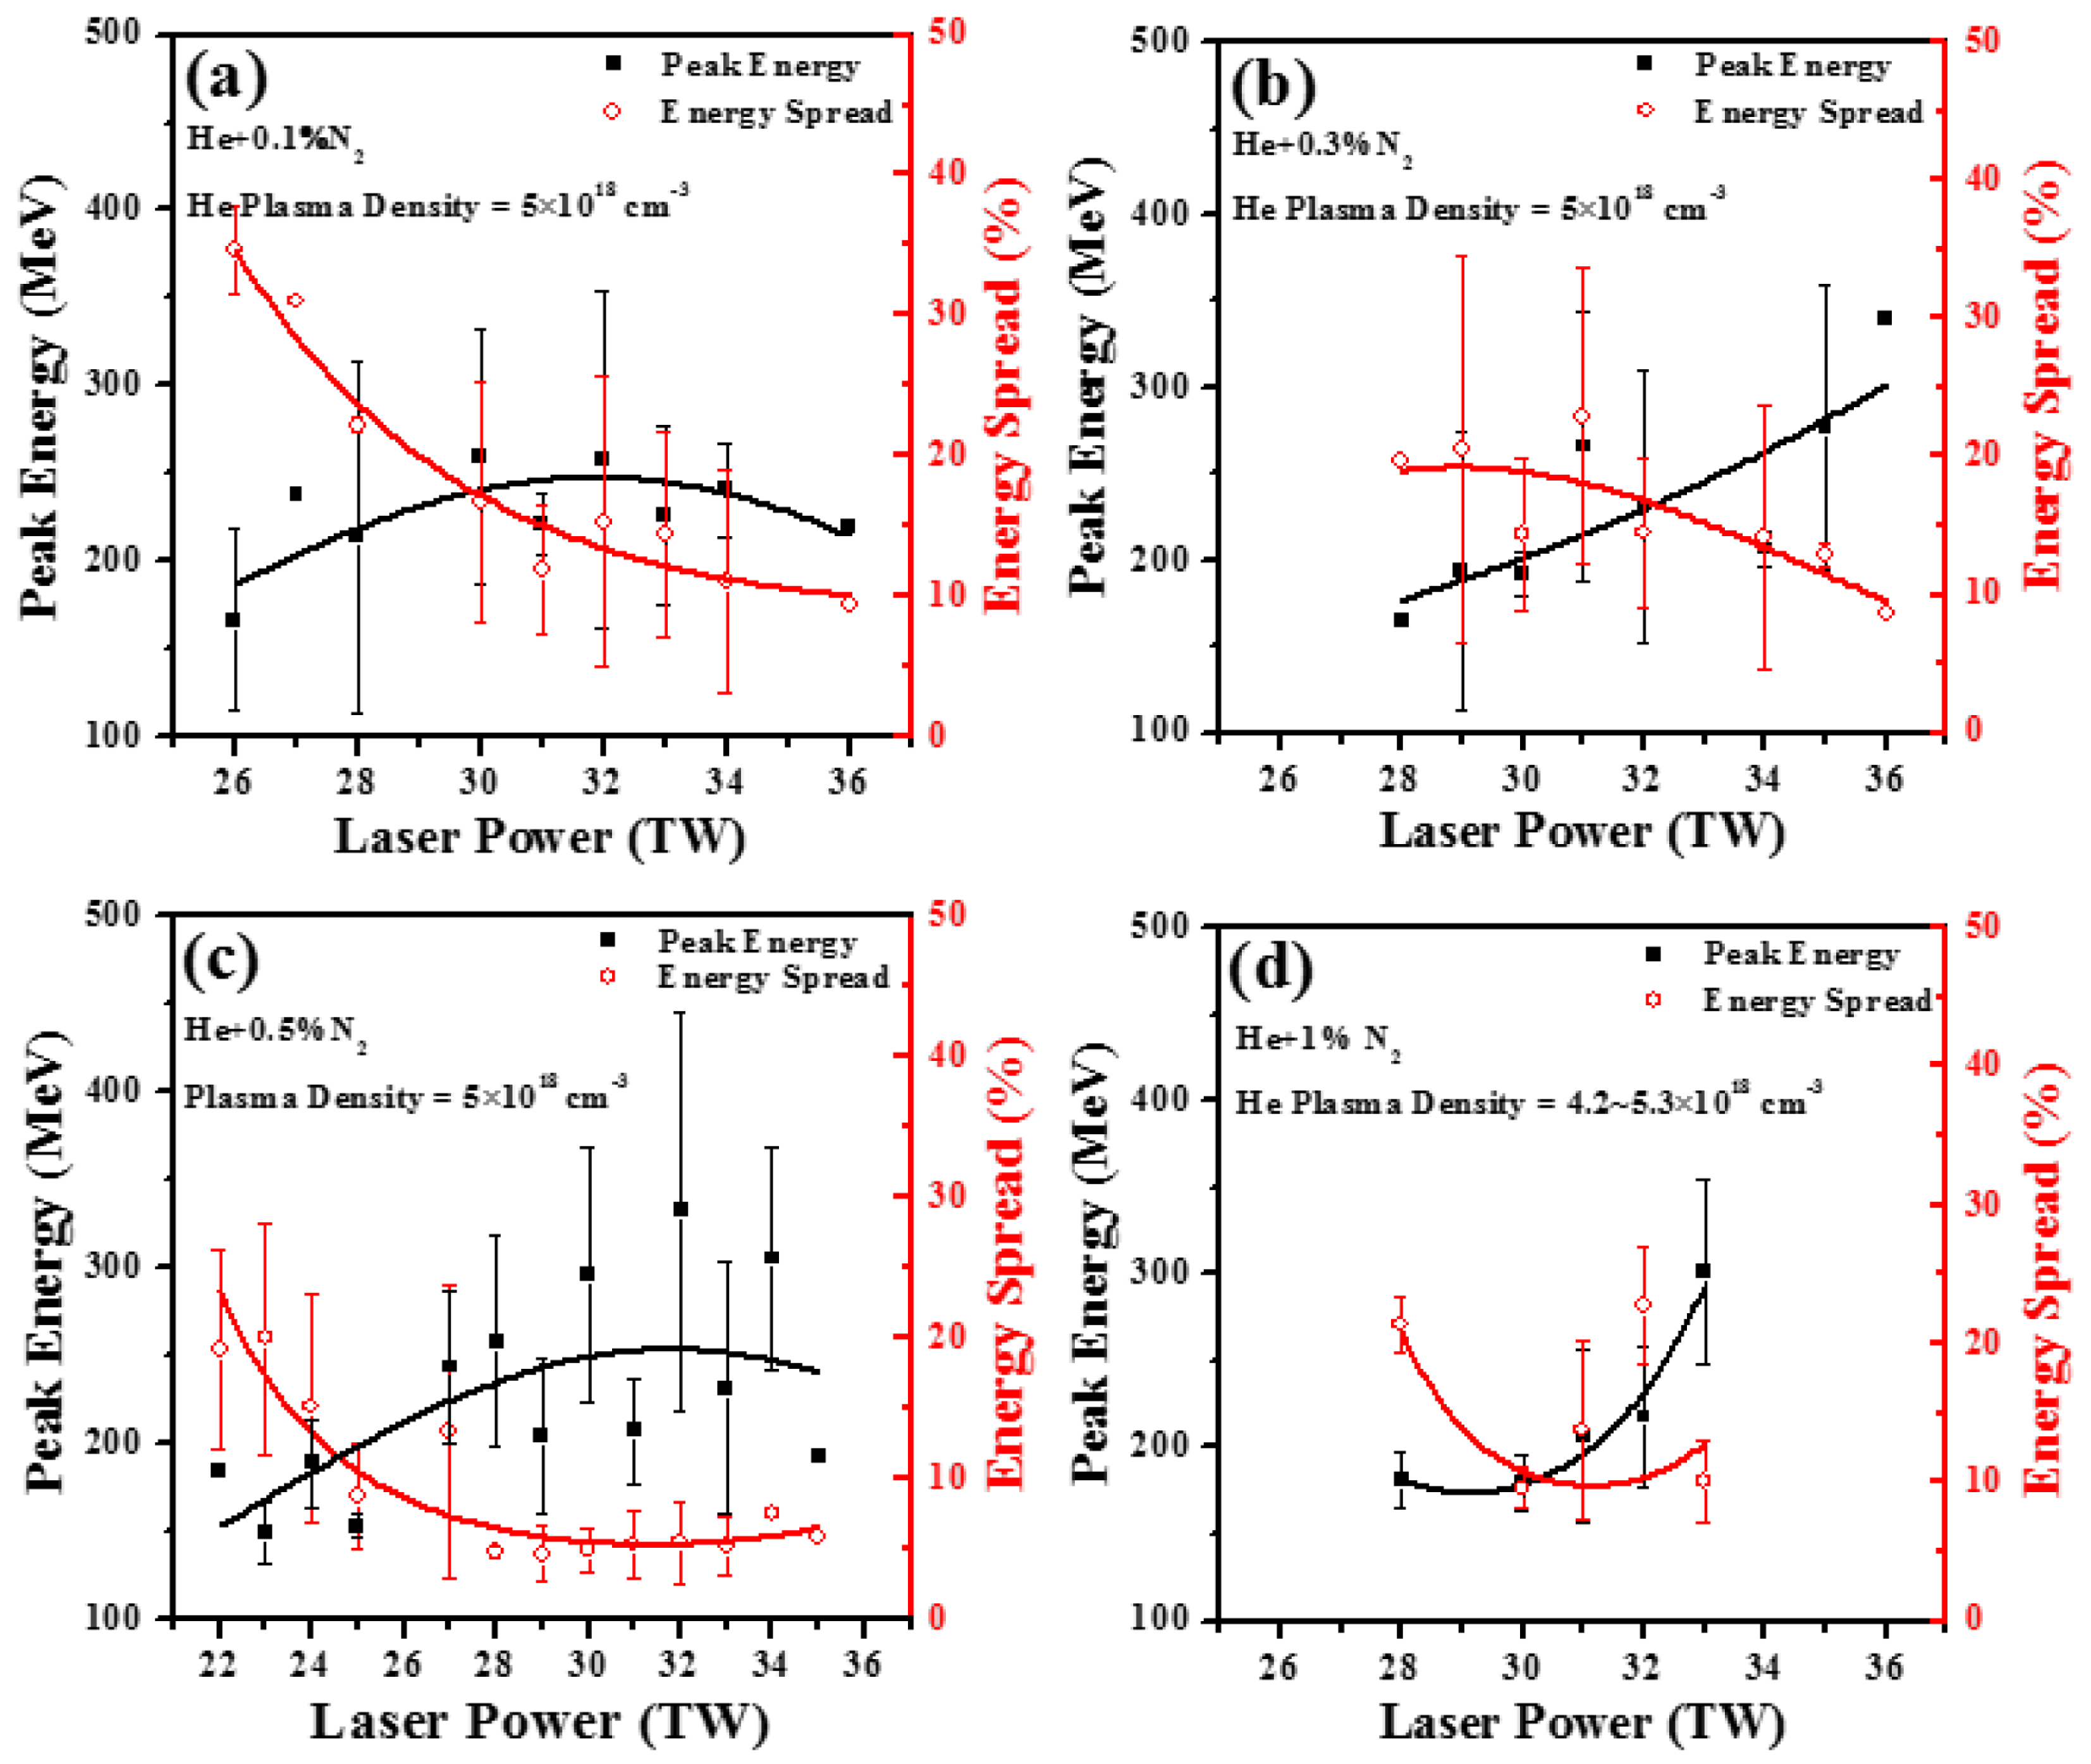
Figure 2. Monoenergetic peak energy and FWHM energy spread of electron beams as a function of laser power for four different concentrations of nitrogen–helium gas mixture targets: (a) 0.1%  $\text{N}_{2}$ mixed in 99.9% of He, (b) 0.3% $\text{N}_{2}$ mixed in 99.7% of He, (c) 0.5% $\text{N}_{2}$ mixed in 99.5% of He, and (d) 1% $\text{N}_{2}$ mixed in 99% of He. The helium plasma density is $5.0\times 10^{18}~\text{cm}^{-3}$ in all plots, expect for the case of (d) where the density range is slightly different. The unmatched laser–plasma parameters for all points in this graphs are in the range of $k_{p}w_{0}\sim 10.8{-}12.1$ and $2(a_{0})^{1/2}\sim 1.9{-}2.2$.
3 Results and discussions
3.1 Experimental results
Figure 1 shows 5 sets (3 images for each set) of typical raw images for electron beam energy spectra generated from laser-driven wakefield acceleration in gas jets of various concentrations of nitrogen (doped) gas in helium (host) gas from 0% (pure helium) to 1% for the unmatched parameters of  $k_{p}w_{0}=$ (a) 11.2, (b) 11.8, (c) 13.6, (d) 11.8, and (e) 10.8, respectively. The electron density $n_{e}$ and the peak power of the laser pulses $P$ for each shot are shown on each figure set.
Figure 1(a) shows  ${\sim}130~\text{MeV}$ (peak energy, not the maximum), board energy-spread ( ${\sim}40\%{-}70\%$) electron beams generated from the pure helium gas jet. For the left and middle shots in this figure, the same laser power (23 TW) was used, generating electron beams with a similar peak energy and relatively low energy spread ( ${\sim}40\%$); for the right shot, the peak energy only gets a little increase but the energy spread drops to ${\sim}70\%$, even at a higher laser power. It is known that it is hard to significantly improve the electron beam energy or energy spread by the self-injection (it works well for matched parameters) in pure helium gas jet for the unmatched parameters we are using. Only by pushing into the matched bubble regime (at matched spot size and higher laser intensities) one may get a higher electron beam quality; however, we are interested in comparing the results of the self-injection with those of the ionization injection for the same unmatched conditions.
Figure 1(b) shows the electron energy spectra obtained from the gas mixture 0.1% nitrogen  $+$ 99.9% helium. We can see that slightly better quality electron beams are obtained; the peak energies are enhanced to above ${\sim}200~\text{MeV}$, and the average energy spread is reduced to ${\sim}14\%$. We can see that more electrons are concentrated in the high-energy part of spectra, which are most likely generated from the ionized nitrogen gas. However, we still see a tail which might come from the self-injected helium electrons which are still dominant in concentration.
By further enhancing the concentration of the nitrogen gas to 0.3% into 99.7% He gas, Figure 1(c), the electron beam spectrum quality has been highly enhanced. Now, the mean electron peak energy has increased to 250 MeV, and the mean energy spread slightly decreased to 13%. At the same time, the tails of energy spectra have become weaker and shorter.
As the nitrogen gas concentration increased to 0.5% (mixed with 99.5% He), electron bunch with the highest energy of 454 MeV with an energy spread as low as 3.4% were observed, as shown in the right panel of Figure 1(d), where almost all electrons are expected to be coming (due to ionization injection) from the nitrogen’s inner shell. Although there is a low-energy tail, it is very weak compared with high-energy part. The other two electron beams in this figure (left and middle panels of Figure 1(d)) are very clean spectra without low-energy electron tails. Their peak energies are 300 and 370 MeV, and the energy spreads are 5% (left) and 5.9% (middle), respectively.
By further increasing the nitrogen concentration to 1% (the helium concentration is 99%), the situation started to reverse, Figure 1(e), where the electron beam energy dropped to 243 MeV (mean) and the energy spread increased again (15%). This case is closer to the case of our previously reported LWFA results in pure nitrogen gas jets which generates long-tail electron beams[Reference Tao, Hafz, Li, Mirzaie, Elsied, Ge, Liu, Sokollik, Chen, Sheng and Zhang32, Reference Mo, Ali, Fourmaux, Lassonde, Kieffer and Fedosejevs37]. Therefore, we conclude that, given an unmatched laser–plasma parameter, an optimization of the doped gas concentration seems to be very important to achieve an optimum electron beam quality with very small energy spread.
Figure 2 summarizes the experimental results of more shots in support of the results presented in Figure 1; it shows plots for the monoenergetic electron peak energy and energy spread (FWHM) versus the laser power at almost the same plasma density of  $5.0\times 10^{18}~\text{cm}^{-3}$ for the four cases of different concentrations of the doped nitrogen gas. For the case of 1% nitrogen mixed with 99% helium, shown in Figure 2(d), we choose the results obtained at a density range of $4.2\times 10^{18}{-}5.3\times 10^{18}~\text{cm}^{-3}$, because of the limited number of useful shots. Firstly, there is a clear trend shown in each plot that as the laser power increases the peak energies of the electron beam increases while the energy spreads decreases. Then, after comparing the four plots, we can find another trend: by gradually increasing the concentration of the nitrogen gas to a certain value (0.5% for the above parameters), the beam’s monoenergetic energy is significantly enhanced and the reduction of its energy spread are achieved as well; after that, by adding more nitrogen to helium, the quality of electron beams has been degraded.

Figure 3. 3D-PIC simulation results using OSIRIS code. Panels (a–c) are results from ionization injection, while (d–f) are from self-injection in pure helium, detailed parameters are shown in the text. (a) and (d) Evolution of the maximum laser electric field and pseudopotential difference; (b) and (e) injected electron charge along the propagation; (c) and (f) electron energy spectra.
In Figure 2(a) with the nitrogen ratio of 0.1%, all the average peak energies are below 300 MeV; the lowest average energy spread is above or near 10%. By increasing the concentration of  $\text{N}_{2}$ to 0.3% (Figure 2(b)), the highest average peak energy is enhanced to ${\sim}300~\text{MeV}$, and the lowest average energy spread is reduced to less than 10%. Then the highest average peak energy of ${\sim}350~\text{MeV}$ and the lowest average energy spread of ${\sim}5\%$ are observed in Figure 2(c) with the nitrogen concentration of 0.5%. Hereafter, as shown in Figure 2(d), the reverse tendency takes place: the highest average peak energy decreases to ${\sim}300~\text{MeV}$ and the lowest average energy spread increases to ${\geqslant}10\%$.
3.2 3D-PIC simulations
To get more insight on the electron beam acceleration process based on the current version of ionization injection, we carried out 3D-PIC simulations using the code OSIRIS[Reference Fonseca, Silva, Tsung, Decyk, Lu, Ren, Mori, Deng, Lee, Katsouleas and Adam38] for the laser–plasma conditions close to those used in experiment. In the simulation, an 800 nm, 30 fs, 27 TW laser pulse with initial normalized vector potential  $a_{0}=1.14$ ( $2\sqrt{a_{0}}\sim 2.1$) is focused at the beginning of the plateau part of the gas mixture with focus radius of $w_{0}=25~{\rm\mu}\text{m}$. To reduce the simulation time, we only included background plasma (instead of helium) and nitrogen gas. The electron density is $4.4\times 10^{18}~\text{cm}^{-3}$ and the nitrogen density is $3.4\times 10^{16}~\text{cm}^{-3}$. The mixture is uniform except for $200~{\rm\mu}\text{m}$ up-ramp profile in front of the plateau plasma. The number of simulation particles per cell is 4 and total simulation box size is $40~{\rm\mu}\text{m}\times 200~{\rm\mu}\text{m}\times 200~{\rm\mu}\text{m}$ with grids number of $1280\times 200\times 200$. Simulation time step is 0.104 fs. For these parameters, the laser is highly unmatched ( $k_{p}w_{0}=10\gg 2\sqrt{a_{0}}\sim 2.1$) with the plasma and it evolved dramatically.
Figure 3(a) shows evolution of the maximum laser electric field (red curve) and wake pseudopotential difference (black curve) along the laser pulse propagation direction. As we can see, within the front distance of  ${\sim}800~{\rm\mu}\text{m}$ the laser intensity gradually increased (due to the self-focusing effect) to the ionization threshold ( $E>1.9$) for the inner-shell electrons of nitrogen ( $\text{N}^{6+}$, $\text{N}^{7+}$) which are usually used for ionization injection, where $E$ is the maximum laser’s electric field normalized to the factor $m_{e}c{\it\omega}_{L}/e$. After that, although the intensity evolves, still it keeps larger than the ionization threshold for a long distance. However, ionization injection could only occur in a very limited region determined by both ionization and wake pseudopotential difference, which is also shown in Figure 3(a). Only when ${\it\Delta}{\it\psi}>{\it\Delta}{\it\psi}_{\text{th}}\sim 1$ (blue dashed line), the ionized K-shell electrons can get enough energy from the wakefield to catch up the wake bucket (be trapped by the bucket) before they move to the back of the bucket; otherwise it would just be slipped over by the wake (here, ${\it\Delta}{\it\psi}={\it\Delta}{\it\psi}_{\text{(zioni)}}{-}{\it\Delta}{\it\psi}_{\text{(zendbucket)}}$ is the potential difference between the electron ionization position and the end of the first wake wave). The threshold for ionization injection is given by ${\it\Delta}{\it\psi}_{\text{th}}=1-{\it\gamma}_{0}^{-1}\sqrt{(1+p^{2}/m_{e}^{2}c^{2})}$. Our case is more universal since the laser intensity evolution not only affects the ionization but also the wake potential itself. From Figure 3(a), we can see that the ionization injection happens in two regions: a major injection at the front interaction region $800~{\rm\mu}\text{m}<z<1000~{\rm\mu}\text{m}$ and a negligible injection at later position around $z\sim 2600~{\rm\mu}\text{m}$. The corresponding injected charge evolution is shown in Figure 3(b). About 110 pC of charge is injected into the wakefield in the first injection time and some of them are lost during the following acceleration process. The second (minor) injection gives about 30 pC charge with relatively low energies. In Figure 3(c), we show the final electron beam energy spectrum (at the exit of the plasma medium) by counting only the electrons with energy higher than 50 MeV which are injected during the first injection region. The spectrum width of 5% and the central energy, 310 MeV are both in reasonable agreement with the experimental results.
Finally, and in order to notice the difference between the self-truncated ionization injection and the usual self-injection in pure helium plasma, we present a 3D-PIC simulation result shown in Figures 3(d)–3(f) for a pure helium case. In the above ionization-injection simulation, the injection takes place only for the inner-shell nitrogen electrons, while the helium electrons and the outer-shell nitrogen electrons are the oscillating electrons forming the plasma wave; these electrons themselves were untrapped. In the simulation of pure helium we keep the electron density similar to the above case, but we increase the laser power in order to get the self-injection of electrons. In this simulation, the peak power of laser pulse was 47 TW (corresponding to  $a_{0}=1.49$), the electron density is $5.0\times 10^{18}~\text{cm}^{-3}$ and the same laser spot size of $28~{\rm\mu}\text{m}$ then $k_{p}w_{0}=11.9\gg 2\sqrt{a_{0}}\sim 2.4$; highly unmatched parameters. In Figure 3(d), we can see that the initial laser intensity is high enough to trigger the injection process from the very beginning. Then the laser intensity evolves from $E_{\text{max}}\sim 1.5$ to $E_{\text{max}}\sim 6$ and oscillates about $E_{\text{max}}\sim 4$, while the wake pseudopotential difference remains always equal or slightly higher than unity which is the threshold for injection. The electron injection is continuous in this case as shown in Figure 3(e). The final energy spectrum is shown in Figure 3(f), in which multiple quasimonoenergetic bunches are generated. This is a typical energy spectrum from the self-injection bubble regime scenario of LWFA where multiple bunches are injected due to the evolving bubble (resulting from the laser spot evolution). When the first bunch is injected it gains a maximum energy then it starts dephasing, at that time it combines with a second injected bunch that is accelerating. This leads to increasing the density of electrons in certain energy band leading to the first quasimonoenergetic peak ( ${\sim}300~\text{MeV}$). The second quasimonoenergetic peak appears as the second injected bunch outruns the first bunch and gains higher energy 600 MeV. This phenomenon is clearly very nonlinear ( $E_{\text{max}}\sim 6$) and is typical in the bubble regime (see Refs. [Reference Kalmykov, Yi, Khudik and Shvets13–Reference Hafz, Lee, Jeong and Lee15]) and is different from the robust self-truncated ionization injection demonstrated in this paper.
More simulation runs (not shown in Figure 3) for different laser spot sizes have suggested that there could be a range of optimum spot sizes and laser powers (within the unmatched parameters) for the generation of electron beams with higher quality. Experimental work to verify this possibility may be done in future work. Our present 3D simulations show the main features and characteristics of the self-truncated injection phenomenon.
4 Conclusion
In this study, we experimentally demonstrated high-quality electron beams generated in a single-stage LWFA configuration by using self-truncated ionization injection. Under unmatched laser–plasma conditions, the generation of electron beams with peak energy near 500 MeV and few percent energy spread is realized by using optimized mixed gas target (low concentration of nitrogen doped in helium). In contrary to other injection schemes, the STII scheme is straightforward to implement. The robustness of the scheme is manifested in many experimental results presented in Figures 1 and 2. In the near-future work, this concept may be realized for multi-GeV LWFA electron acceleration using higher laser intestines.
Acknowledgements
The authors thank the OSIRIS Consortium at UCLA and IST for providing access to OSIRIS 2.0 framework. This work was supported by the National ‘973’ Program of China under Grant No. 2013CBA01504. Simulations were supported by Shanghai Supercomputer Center and the center for high performance computing at Shanghai Jiao Tong University.


 Open access