As usual at the beginning of the year, we publish our traditional editorial note. We present basic statistics and recent news concerning the evolution of the Journal in the past year 2017. The RHE-JILAEH received 61 original research papers in the year 2017. Figure 1 presents the evolution since 2010.
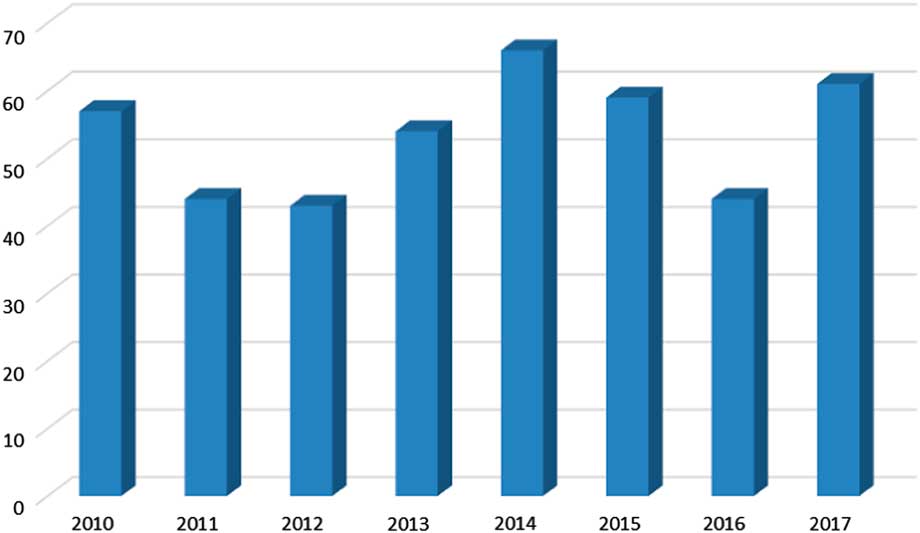
FIGURE 1 NUMBER OF ORIGINAL ARTICLES SUBMITTED TO RHE-JILAEH, 2010-2017
The percentage of original manuscripts received last year dealing with Latin American history has increased significantly (over 49 percent) while there is a decrease in articles dealing with Spanish and Portuguese economic history. The number of original research papers on Global economic history remains stable.
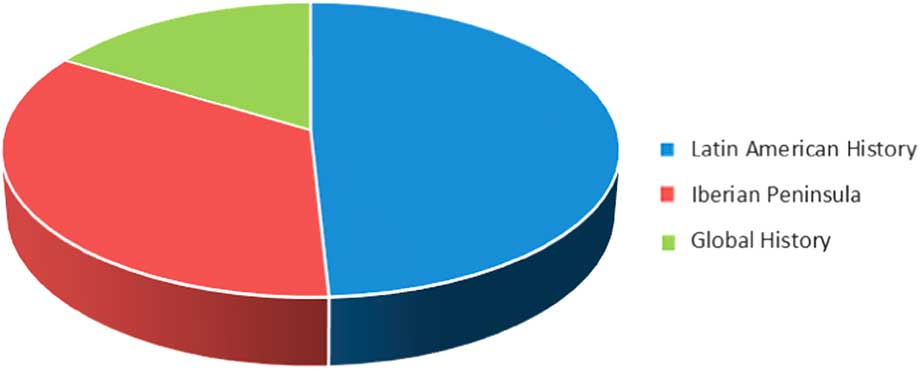
FIGURE 2 REGIONAL DISTRIBUTION OF TOPICS. TOTAL SUBMISSIONS IN 2017 (%)
Our rejection rate of manuscripts not suitable for RHE-JILAEH, either by its orientation or by other problems, remains high but lower than last year. Evaluation and processing times for articles have remained at very reasonable values since 61% of manuscripts have been evaluated in less than three months.
TABLE 1 GEOGRAPHICAL DISTRIBUTION AND TOPICS OF ARTICLES IN 2017
TABLE 2 STATISTICS FOR EVALUATIONS PERIODS AND SITUATION OF ORIGINAL RESEARCH PAPERS DURING 2017
The greatest wealth of the Journal, jointly with the Editorial Board, is the collaboration of the reviewers of the received manuscripts. The list of reviewers reflects the international dimension of the RHE-JILAEH as well as the generosity and professionalism of the scientific community. We gratefully acknowledge their contribution during 2017.
NOTA DE LOS EDITORES
La tradicional nota de los editores presenta los datos y novedades más recientes de la evolución de la Revista en el año anterior.
El número de originales de investigación recibidos por RHE-JILAEH en el año 2017 ha sido de 61. El gráfico 1 presenta la evolución desde el año 2010.
GRÁFICO 1 NÚMERO DE ARTÍCULOS ORIGINALES ENVIADOS A RHE-JILAEH, 2010-2017
GRÁFICO 2 DISTRIBUCIÓN REGIONAL DE TEMAS. TOTAL RECIBIDOS EN 2017 (%)
El porcentaje de manuscritos recibidos sobre temas de historia de América Latina se mantiene elevado (49 por ciento) mientras los artículos con temas de historia de la Península Ibérica presentan una tendencia ligeramente a la baja. El número de manuscritos recibidos sobre temas de historia global se mantiene estable.
La tasa de rechazo editorial de manuscritos no apropiados para RHE-JILAEH, bien por su temática bien por problemas de otra índole, presenta unos valores elevados, aunque inferiores al año anterior. Los tiempos de evaluación y tramitación de artículos han permanecido en valores muy razonables con el 61% de los artículos evaluados en menos de tres meses.
La mayor riqueza de la Revista, además de su Consejo Editorial, es la colaboración de los evaluadores de los manuscritos recibidos. El plantel de evaluadores refleja la dimensión internacional de la RHE-JILAEH así como la generosidad y profesionalidad de la comunidad científica. Agradecemos a todos ellos su colaboración durante el año 2017.
CUADRO 1 DISTRIBUCIÓN Y TEMAS DE LOS ARTÍCULOS EN 2017
CUADRO 2 ESTADÍSTICAS DE LOS TIEMPOS DEL PROCESO DE EVALUACIÓN DURANTE EL AÑO 2017
ACKNOWLEDGEMENT TO REFEREES IN 2017 RECONOCIMIENTO A EVALUADORES EN 2017