


As a widely grown crop, maize provides sufficient carbohydrates for humans and animals and is a primary source of energy(Reference Chen, Ye and Yang1). Starch is the main component of maize, and it can be separated into two types of glucose polymers due to the difference in glucoside linkage: amylose is a linear chain of glucose units joined by −1,4-glucoside linkages, while amylopectin is a highly branched amylose linked by −1,6 bonds(Reference Zobel2). Maize digestibility is mainly determined by starch digestibility, which depends on the amylose:amylopectin ratio and molecular weight(Reference Englyst and Hudson3). Depending on the digestion rate of starch, it can be divided into rapid digestion starch, slow digestion starch and resistant starch(Reference Englyst, Kingman and Cummings4). The metabolic response and growth performance of pigs also differ when fed diets with different starch digestibilities(Reference Gao, Yu and Yu5). Due to the slow digestion rate of amylose, the plasma glycaemic level rises slowly after the animal ingests, it could maintain the animal’s postprandial blood glucose homoeostasis(Reference Behall and Hallfrisch6,Reference Rawles and Lochmann7) . The level of plasma glycaemic can regulate protein metabolism and amino acid (AA) transport(Reference Roos, Lagerlöf and Wennergren8). On the other hand, AA are the primary energy source of the small intestines. In addition to participating in protein synthesis, the metabolism of AA in the epithelial cells of the small intestines also provides about 70 % of the energy requirements of the small intestines. Additionally, free AA are usually absorbed through some Na+-dependent/Na +-independent AA transport systems located on the apical membrane of intestinal epithelial cells. Simultaneously, AA transport systems can be divided into neutral AA transporters (preferring leucine and other large hydrophobic neutral AA (system L), preferring alanine and other small and polar neutral AA (system A), and preferring alanine, serine and cysteine (system ASC)), anionic AA transporters (X-AG system), cationic AA transporters (y+ system) and some individual AA transport vectors (L and T system)(Reference Broer9). However, the relationship between dietary starch structure and AA transport in the gastrointestinal tract of animals has seldom been observed.
Furthermore, previous studies have revealed that the source and type of dietary starch often affect the plasma insulin levels, which in turn affect protein turnover and metabolism in animals(Reference Drew, Schafer and Zijlstra10–Reference Yang, Chen and Yu12). Due to the faster digestion rate of amylopectin, the plasma insulin also increases rapidly, which is more conducive to the deposition of fat, while the digestion rate of amylose is slower, and the plasma insulin rises slowly and lasts longer, which is more conducive to the lean deposition(Reference Doti, Suárez-Belloch and Latorre13). More protein synthesis is needed in the lean deposition process than the fat. Compared with high amylose diets, animals fed high amylose diets have lower protein digestibility(Reference Li, Huang and Wu14,Reference Li, Dai and Yin15) . It is verified that amylopectin probably reduces the absorption of AA due to its fast digestion(Reference Giusi-Perier, Fiszlewicz and Rérat16,Reference Yu, Li and Rong17) . To our knowledge, information about the influence of dietary starch structure on the absorption and metabolism of AA in the gastrointestinal tract of animals is limited.
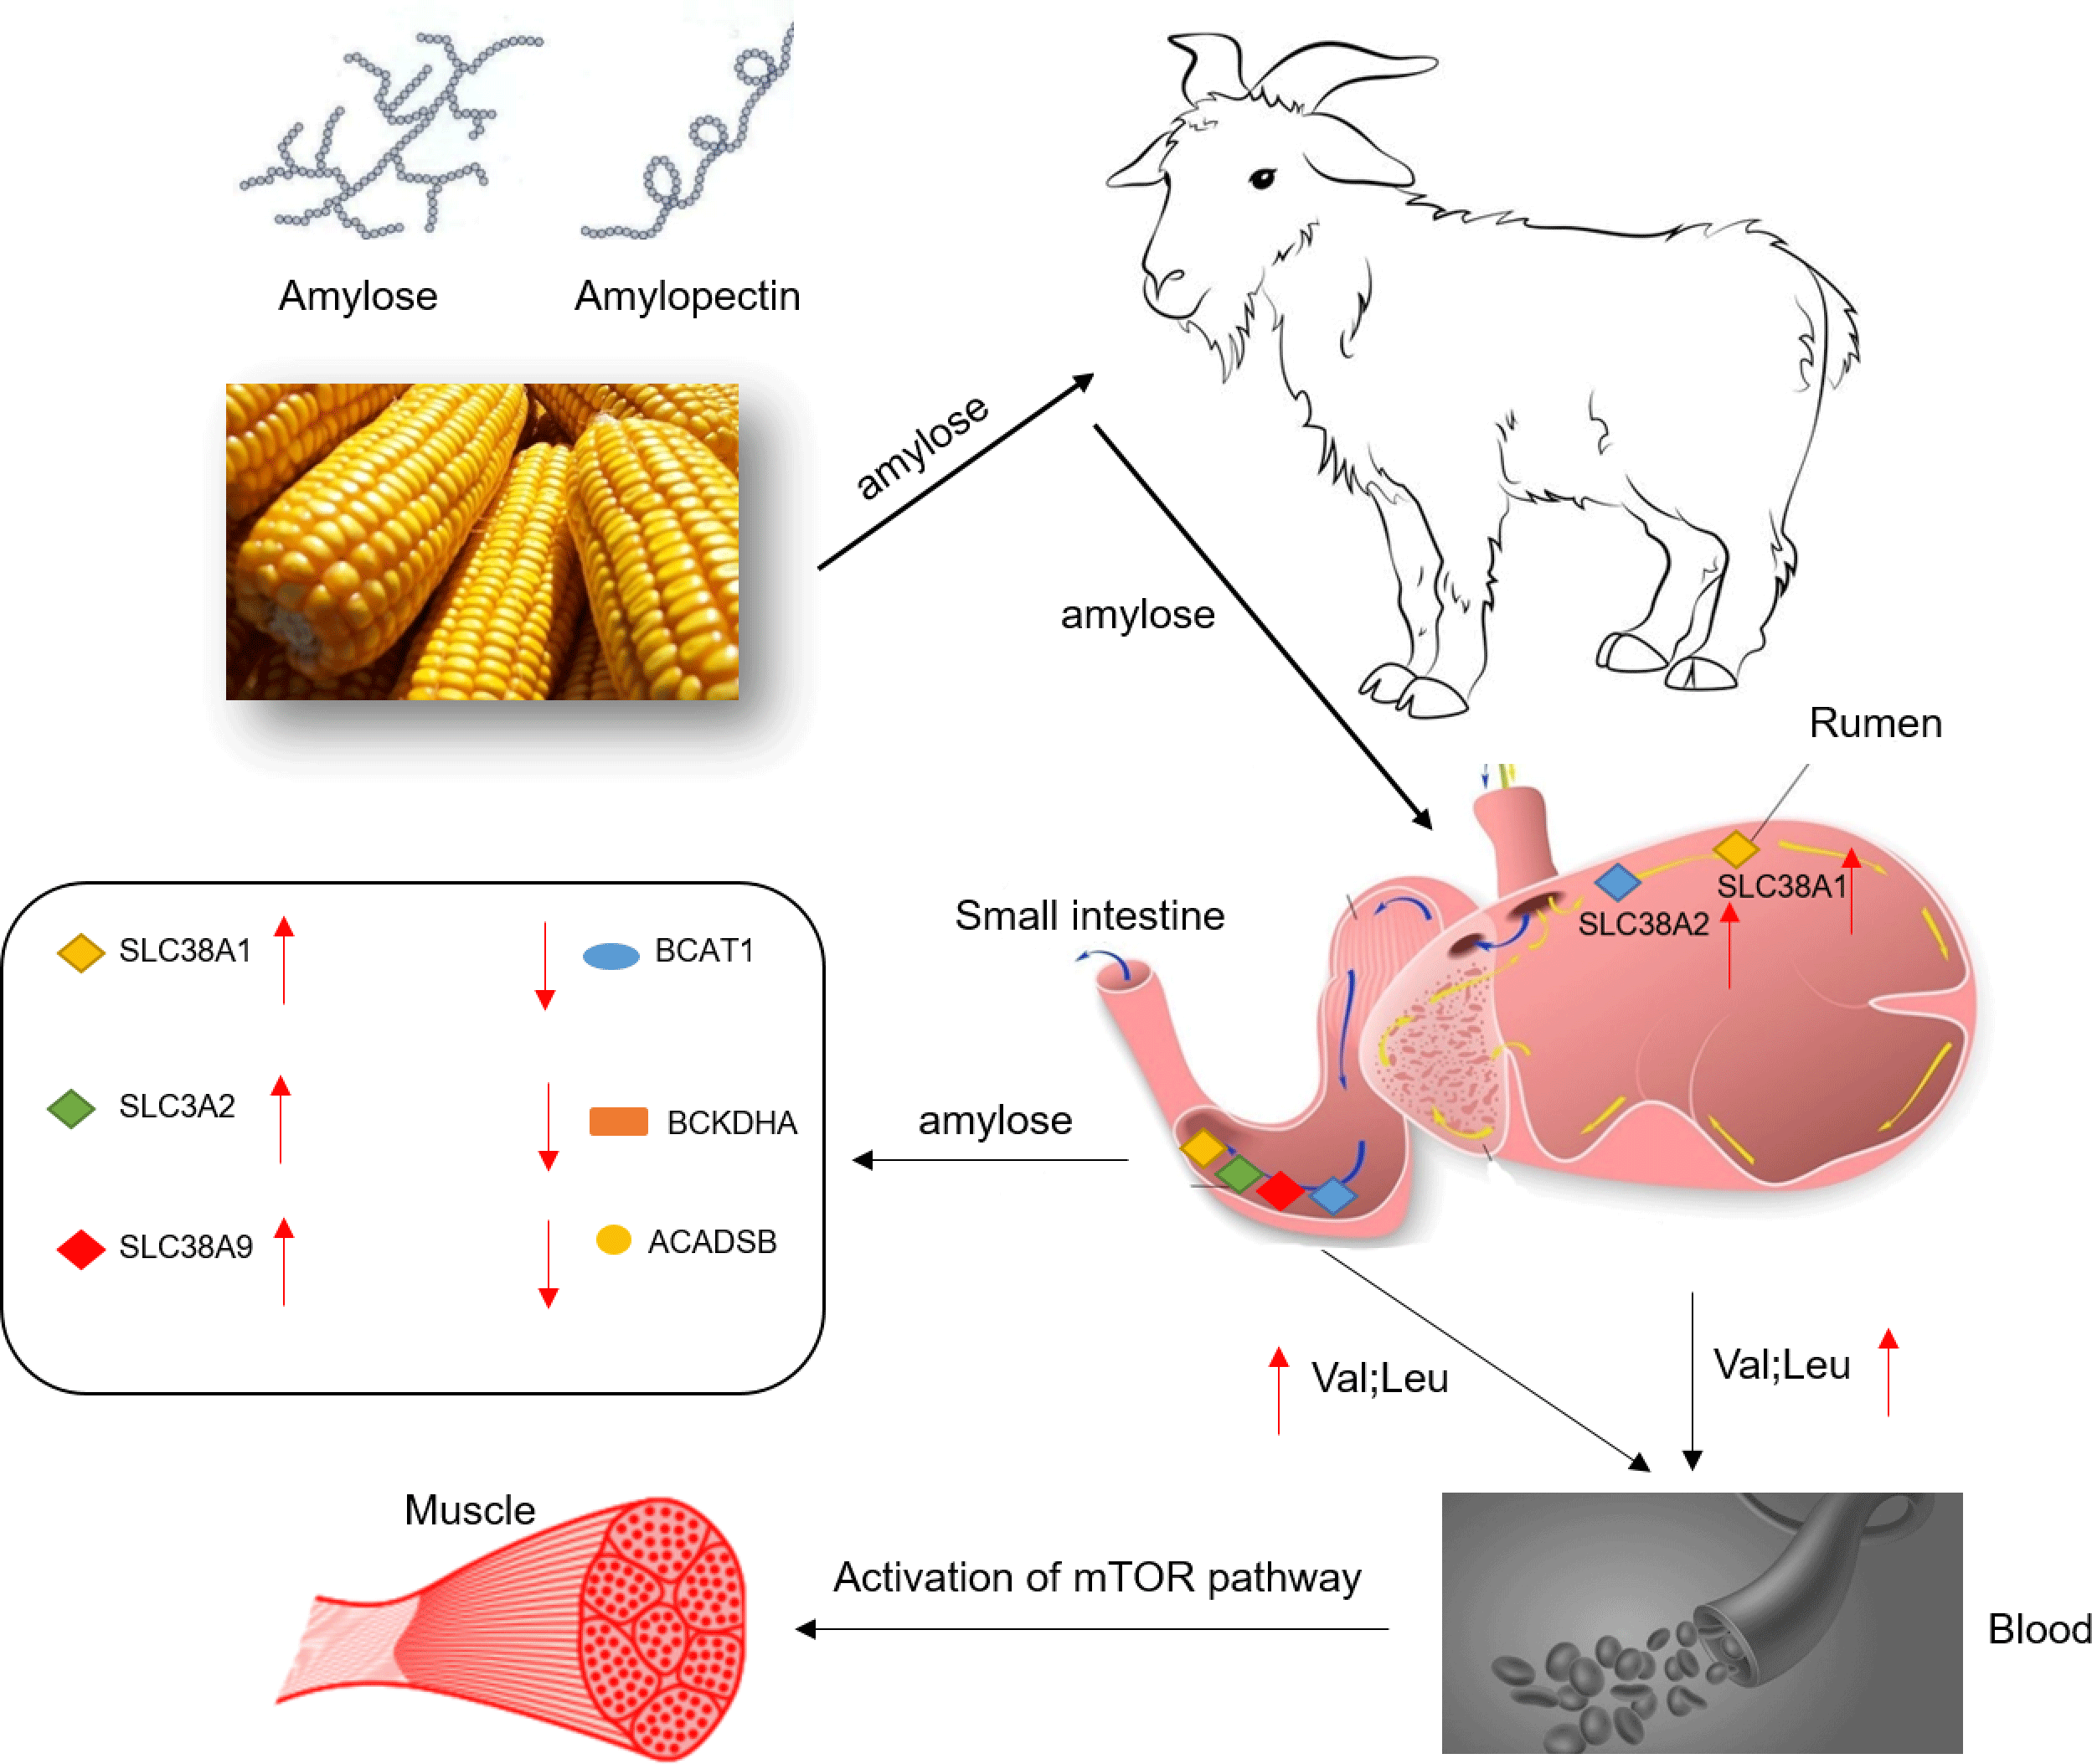
Herein, we hypothesised that feeding diets with different amylose:amylopectin ratios would affect the expression of the AA transporters, thus regulate the absorption of AA in the gastrointestinal tract. In this study, goats were thereby used as experimental animals to explore the effects of diets with different amylose:amylopectin ratios on intestinal AA transporters’ expression, the activities of enzymes involved in AA metabolism, and mammalian target of rapamycin (mTOR) signalling pathway involved AA accumulation in muscles, intending to reveal how starch types affect animal protein and AA metabolism.
Materials and methods
The study received the approval of the Institutional Animal Care Committee, and all procedures involving animals were conducted in accordance with the guidelines on animal care of the Institute of Subtropical Agriculture, the Chinese Academy of Sciences.
Experimental design, animals and diets
The animal trial was conducted at a commercial Xiangdong black goat farm in Hunan province, P. R. China. Twenty-seven Xiangdong black female goats (average body weight of 9·00 ± 1·12 kg) were selected, blocked by weight and allocated into three groups (n 9). Then, the grouped goats were randomly assigned to one of three diets: T1 (normal maize 100 %, high amylose maize 0 %); T2 (normal maize 50 %, high amylose maize 50 %) and T3 (normal maize 0 %, high amylose maize 100 %). The diets were elaborated according to the requirements of the NRC (2007). The ingredients and chemical composition of the concentrate and alfalfa are presented in Table 1. The animal trial lasted 49 d, with 14 d of adaptation period and 35 d of the experimental period. During the experimental period, goats were fed twice daily at 08.00 and 16.00 hours with concentrate and alfalfa offered separately. During the animal trial, all goats had ad libitum access to water, concentrate and alfalfa.
Table 1. Ingredients and chemical composition of concentrate diets (DM basis, %)
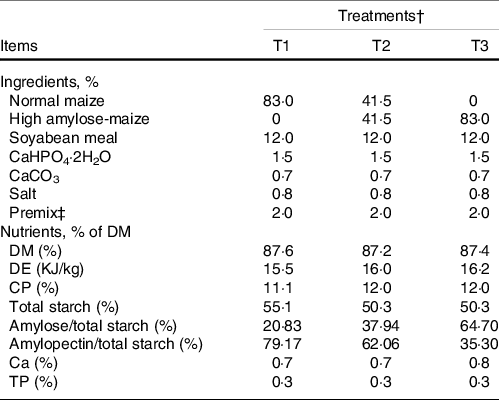
DE, digestive energy; CP, crude protein; TP, total phosphorus.
Nutritional composition of alfalfa: DM 95·9 %, CP 14·5 %, NDF 37·2 %, ADF 28·1 %.
† T1 (normal maize 100 %, high amylose maize 0 %); T2 (normal maize 50 %, high amylose maize 50 %); T3 (normal maize 0 %, high amylose maize 100 %).
‡ The premix provided the following per kg of the diet: MnSO4•H2O 15·33 g, FeSO4•7H2O 30 g, CuSO4•5H2O 25·33 g, ZnSO4•H2O 15·33 g, iodine 0·667 g, Se 0·67 g, Co 0·67 g, Vitamin A 32 500 IU, Vitamin D3 10 000 IU, Vitamin E 80 IU, Vitamin K3 10 mg, Vitamin B1 10 mg, Vitamin B2 25 mg, Vitamin B6 8 mg, Vitamin B12 0·075 mg, biotin 0·600 mg, folic acid 5 mg, nicotinamide 100 mg, pantothenic acid 50 mg.
Sample collection
The blood sample of each goat was collected into a 10-ml vacuum tube (Zhejiang Gongdong Medical Technology Co. Ltd; code No. GD0100LH) containing Na-heparin via the jugular vein before morning feeding on d 30. Plasma samples were prepared via centrifuged at 3000 g for 20 min at 4°C, subsampled and frozen at −20°C until analysed. The longissimus dorsi and mucosa epithelium samples of the rumen (medium ventral) and ileum (middle) were separated immediately after slaughter and rinsed with cold PBS (0·85 % NaCl, 1·4 mm KH2PO4, 8 mm Na2HPO4, pH 7·4). The samples (3 g) were collected from the longissimus dorsi, rumen and ileum, snap-frozen in liquid N2 and stored at −80°C until analysis. Meanwhile, tissue samples of the medium ventral of rumen (2 × 2 cm2) and the middle part of ileum (5 cm) were collected from the sample location as epithelial samples, washed with PBS, fixed in 10 % formalin (v/v) for 24 h, embedded in paraffin wax and stored at 4°C until use
Amino acid profile and enzyme activity related to amino acid metabolism
The free AA profiles of intestinal epithelial, plasma and longissimus dorsi samples were determined according to the method described by Li et al. (Reference Li, Duan and Li18). The activities of enzymes involved in AA metabolism, including branched-chain amino acid transferase (BCAT), branched-chain α-keto acid dehydrogenase complex (BCKDH), acetyl-CoA dehydrogenase (ACADS) and short/branched-chain ACAD (ACADSB), were determined using commercial ELISA kits (goat#ml567708, goat#ml601711, goat#ml211443, goat#ml221113, Mlbio, Shanghai, China, and CW0014, CWBIO, Beijing, China) following the recommended procedures.
Amino acid transporter and receptor expression
The relative mRNA levels of AA transporters were determined using quantitative real-time PCR. Briefly, total RNA was extracted from collected epithelial samples using RNAiso Plus (TaKaRa; Code No. 9108/9109) following the manufacturer’s instructions. The genomic DNA was eliminated by digestion with DNase I (Thermo Scientific), and then the purity and concentration of total RNA were measured by NanoDrop 2000 (Thermo Scientific). Afterwards, 1 μg total RNA was reverse-transcribed to cDNA in a 20 μl system using the Evo M-MLV RT Kit (AG11706) following the manufacturer’s instructions. The synthesised cDNA was saved at −20°C until used for quantitative real-time PCR analysis. Real-time quantitative PCR was performed using the SYBR Premix Ex Taq II (Takara) on an ABI-7900HT qPCR system (Applied Biosystems), with β-actin selected as housekeeping genes(Reference Huang, Jiao and Tan19). All primers were synthesised commercially (Sangon Biotech), and the primer sequences for the target genes are shown in Supplementary Table S1. The relative expression levels of mRNA were estimated according to the 2−ΔΔCT method(Reference Livak and Schmittgen20).
Immunofluorescent analysis of amino acid transporters
Embedded rumen and ileum tissue samples were cut into 4 µm sections with a cryostat microtome (Leica CM1850, Leica Microsystems). Slides were dewaxed and blocked with 2 % BSA at room temperature for 1 h. Subsequently, the slides were incubated with primary antibodies at 4°C overnight. Following incubation, sections were washed five times for 3 min each time in PBS and incubated with the secondary antibody for 1 h at room temperature. Subsequently, slides were washed for 5 × 3 min in PBS and stained with 4',6-diamidino-2-phenylindole solution for 8 min. The slides were furtherly stained with the configured Sudan black dye solution (70 ml 70 % ethanol + 30 ml pure water + 0·3 g Sudan black) for 5 min and rinsed under running distilled water for 20 min. Immunostained slides were examined with a Zeiss LSM880 confocal microscope (Carl-Zeiss-Straße22, 73447Oberkochen) with argon and He-Ne laser sources. On average, eight images were taken per section. Image processing and analysis were conducted on ImageProline Plus 5.1 (Media Cybernetics), and exposure time and gain between all images on each slide were kept constant. Primary and corresponding secondary antibodies and working dilutions are shown in Supplementary Table S2.
Western blot analysis
Western blot analysis was carried out to analyse the relative protein abundances of mTOR, 4EBP1 (4E-binding protein 1), S6K1 (ribosomal protein S6 kinases 1) and their phosphorylated forms p-mTOR, p-4EBPI and p-S6K1 in the longissimus dorsi muscle of goats according to previous studies(Reference Duan, Li and Li21). Briefly, total proteins were extracted from the longissimus dorsi muscle samples using RIPA lysate (Applygen Technologies), with 1 % protease inhibitor cocktail (Roche Diagnostics GmbH), followed by 30 min of cleavage on ice. Supernatants were taken after centrifuging at 12 000 g for 15 min at 4°C, and then the protein concentrations were measured utilising a BCA Protein Assay kit (Hin Biotech). The exact amounts of protein needed for each sample were calculated and mixed with 5× loading buffer, incubated at 95°C for 5 min and stored at –20°C until further analysis. Fifty milligrams of each sample’s total protein was loaded and separated by electrophoresis in 10 % SDS-PAGE gel. The protein spots were then transferred to the PVDF film, which was then incubated with 5 % skimmed milk in a TBS buffer containing 0·2 % Tween-20 for 1 h to suppress the nonspecific binding of Ig. Then, the pre-blocked membrane was incubated with primary antibodies in 1 × TBST at 4°C overnight, washed in 1 × TBST three times (15 min each), incubated with horseradish peroxidase-labelled secondary antibody in 1 × TBST for 1 h at room temperature and washed in 1 × TBST (3 × 10 min). The antibody of GAPDH was used as an internal control to normalise the data. The resultant signals were quantified by Image Processing Software (Image-Proline Plus 6.0). Details of the antibodies used are shown in Supplementary Table S3.
Statistical analysis
All statistical analyses and visualisation were conducted using SAS version 9.4 (SAS Institute, Inc.) and GraphPad Prism 8.0 (GraphPad Software), respectively. All data analyses were performed by one-way ANOVA with the SAS statistical software (SAS Inc.). Polynomial contrasts were used to determine the linear and quadratic effects of dietary amylose levels. A P-value < 0·05 was considered to indicate a statistically significant difference, and a tendency was considered at 0·05 ≤ P < 0·10.
Results
Gastrointestinal mucosa, plasma and longissimus dorsi amino acid profiles
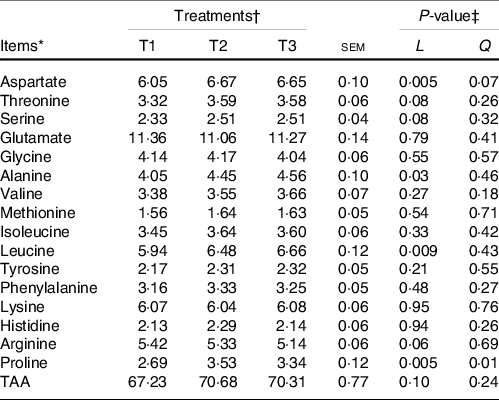
The majority of the free AA (except glycine and alanine) and total AA in ruminal mucosa quadratically (P < 0·05) or tended (0·5 < P < 0·10) to be quadratically changed with the increment of dietary amylose:amylopectin ratios (online Supplementary Table S4), with AA and total AA concentration increased from T1 to T2 and decreased from T2 to T3. All AA in the ileal mucosa decreased linearly (P < 0·05) as amylose:amylopectin increased in diets (Table 2), with greater concentration in T1 than in T3. Furthermore, the concentration of plasma alanine (P = 0·001), valine (P = 0·03), leucine (P = 0·04) and total AA (P = 0·03) linearly increased when the amylose:amylopectin ratio increased, with greater concentration observed in T3 than that in T1 (Table 3), whereas the remaining AA did not differ among diets. The concentration of aspartate (P = 0·005), alanine (P = 0·03), leucine (P = 0·009) and proline (P = 0·005) in the longissimus dorsi increased linearly when the amylose:amylopectin ratio increased.
Table 2. Effects of different amylose:amylopectin ratios on amino acid profiles in ileum mucosal of goats
(Mean values and standard errors of the mean)
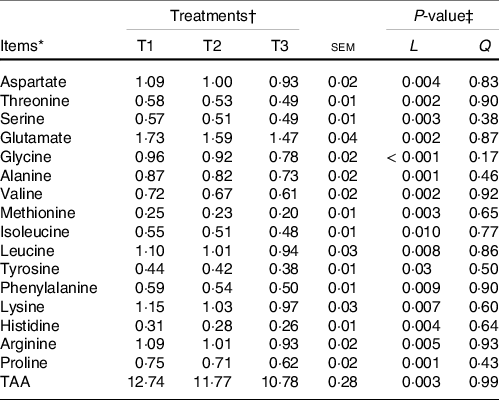
TAA, total amino acids.
* (DM basis, %).
† Treatments were: T1 (normal maize 100 %, high amylose maize 0 %); T2 (normal maize 50 %, high amylose maize 50 %); T3 (normal maize 0 %, high amylose maize 100 %).
‡ L and Q represent linear and quadratic response to increasing amylose:amylopectin ratio.
Table 3. Effects of different amylose:amylopectin ratios on plasma amino acid profiles in goats
(Mean values and standard errors of the mean)
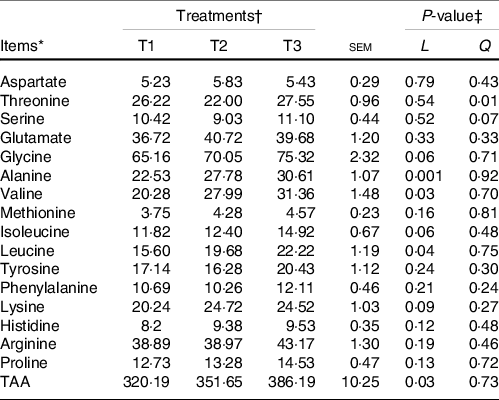
TAA, total amino acids.
* (DM basis, %).
† Treatments were: T1 (normal maize 100 %, high amylose maize 0 %); T2 (normal maize 50 %, high amylose maize 50 %); T3 (normal maize 0 %, high amylose maize 100 %).
‡ L and Q represent a linear and quadratic response to increasing amylose to amylopectin ratio.
Table 4. Effects of different amylose:amylopectin ratios on longissimus dorsi amino acid profiles in goats
(Mean values and standard errors of the mean)
TAA, total amino acids.
* (DM basis, %).
† Treatments were: T1 (normal maize 100 %, high amylose maize 0 %); T2 (normal maize 50 %, high amylose maize 50 %); T3 (normal maize 0 %, high amylose maize 100 %).
‡ L and Q represent a linear and quadratic response to increasing amylose to amylopectin ratio.
Relative mRNA levels of amino acid transporters and receptors
The relative mRNA levels of various AA transporters and receptors in the ruminal and ileal mucosal of goats with a response to different dietary amylose:amylopectin ratios are shown in Table 5. The mRNA levels of Ca-sensing receptor, metabotropic glutamate receptor 7, solute carrier family 7 member 1, solute carrier family 7 member 5 (except a quadratic response in the ileum) and solute carrier family 7 member 10 were not affected (P > 0·05) by dietary amylose:amylopectin ratios, whereas the mRNA levels of the remaining AA transporters were affected by dietary amylose:amylopectin ratios in at least one gastrointestinal section, among which the expression of solute carrier family 38 member 1 (SLC38A1), solute carrier family 38 member 2 (SLC38A2) and solute carrier family 38 member 9 (SLC38A9) was most sensitive to the dietary amylose:amylopectin ratio. Quadratic (P < 0·05) responses of the mRNA level of solute carrier family 1 member 3 in the rumen and solute carrier family 1 member 4 in the rumen and ileum were observed; the mRNA level of solute carrier family 3 member 2 (SLC3A2) in the ileum increased linearly with dietary amylose:amylopectin ratio, with greater expression in T2 and T3 than in T1. The mRNA level of SLC38A1 in the rumen quadratically changed (P = 0·02) with increasing dietary amylose:amylopectin ratio, with greater expression in T2 than in T1, while its level in the ileum increased linearly (P = 0·01) with dietary amylose:amylopectin ratio increased, with greater expression in T2 and T3 than in T1. The mRNA level of SLC38A2 in the rumen increased linearly (P = 0·03) with increasing dietary amylose:amylopectin ratio, with greater expression noted in T3 than in T1. Similarly, the mRNA level of SLC38A9 in the ileum increased linearly (P = 0·02) as the dietary amylose:amylopectin ratio increased, with greater expression in T2 and T3 than in T1.
Table 5. Effects of different amylose:amylopectin ratios on mRNA expression of amino acid transporters in ruminal and ileal mucosal of goat
(Mean values and standard errors of the mean)
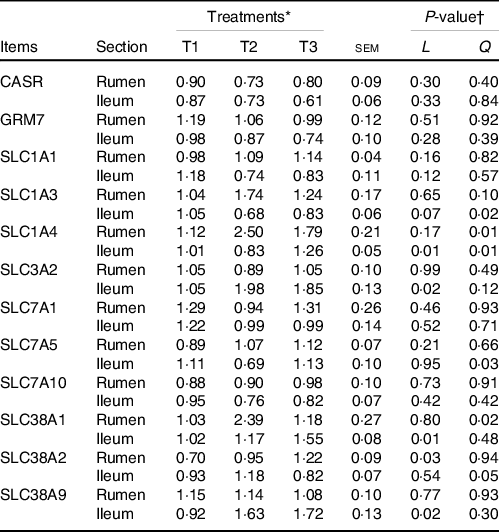
GRM7, glutamate receptor, metabotropic 7; CASR, Ca-sensing receptor; SLC1A1, solute carrier family 1 member 1; SLC1A3, solute carrier family 1 member 3; SLC1A4, solute carrier family 1 member 4; SLC7A5, solute carrier family 7 member 5; SLC7A10, solute carrier family 7 member 10; SLC38A1, solute carrier family 38 member 1; SLC38A2, solute carrier family 38 member 2; SLC7A1, solute carrier family 7 member 1; SLC3A2, solute carrier family 3 member 2; SLC38A9, solute carrier family 38 member 9.
* Treatments were: T1 (normal maize 100 %, high amylose maize 0 %); T2 (normal maize 50 %, high amylose maize 50 %); T3 (normal maize 0 %, high amylose maize 100 %).
† L and Q represent linear and quadratic response to increasing amylose:amylopectin ratio.
Immunofluorescent analysis of solute carrier family 38 member 1, solute carrier family 38 member 2, solute carrier family 38 member 9 and solute carrier family 3 member 2
Given the relative mRNA levels of SLC38A1, SLC38A2 and SLC38A9 were significantly different among diets in the rumen and ileum, their protein abundance and localisation were furtherly analysed using immunofluorescence (Fig. 1 and Fig. 2). Immunolocalisation showed that SC38A1 and SLC38A2 were abundantly expressed in the lamina propria, basal layer, and papillae of the rumen, whereas less abundantly expressed in the ileum. The protein abundance of SLC38A1 in the ileum of T3 and T2 was higher (P < 0·05) than that of T1 (Fig. 2(c) and (d)), while the protein abundance of SLC38A2 in the ileum was not affected by dietary amylose:amylopectin ratio among treatments. The SLC38A9 and SLC3A2 were both expressed in the rumen mucosa, and their protein abundance was elevated remarkably (P < 0·05) in T2 and T3 compared with that of T1 (Fig. 3(a), (b), (e), (f)). Similarly, the protein abundance of SLC38A9 (P < 0·05) and SLC3A2 (P < 0·05) was enhanced significantly in the ileal mucosa in T2 and T3 compared with T1 due to increased dietary amylose:amylopectin ratios (Fig. 3(c), (d), (g), (h)).
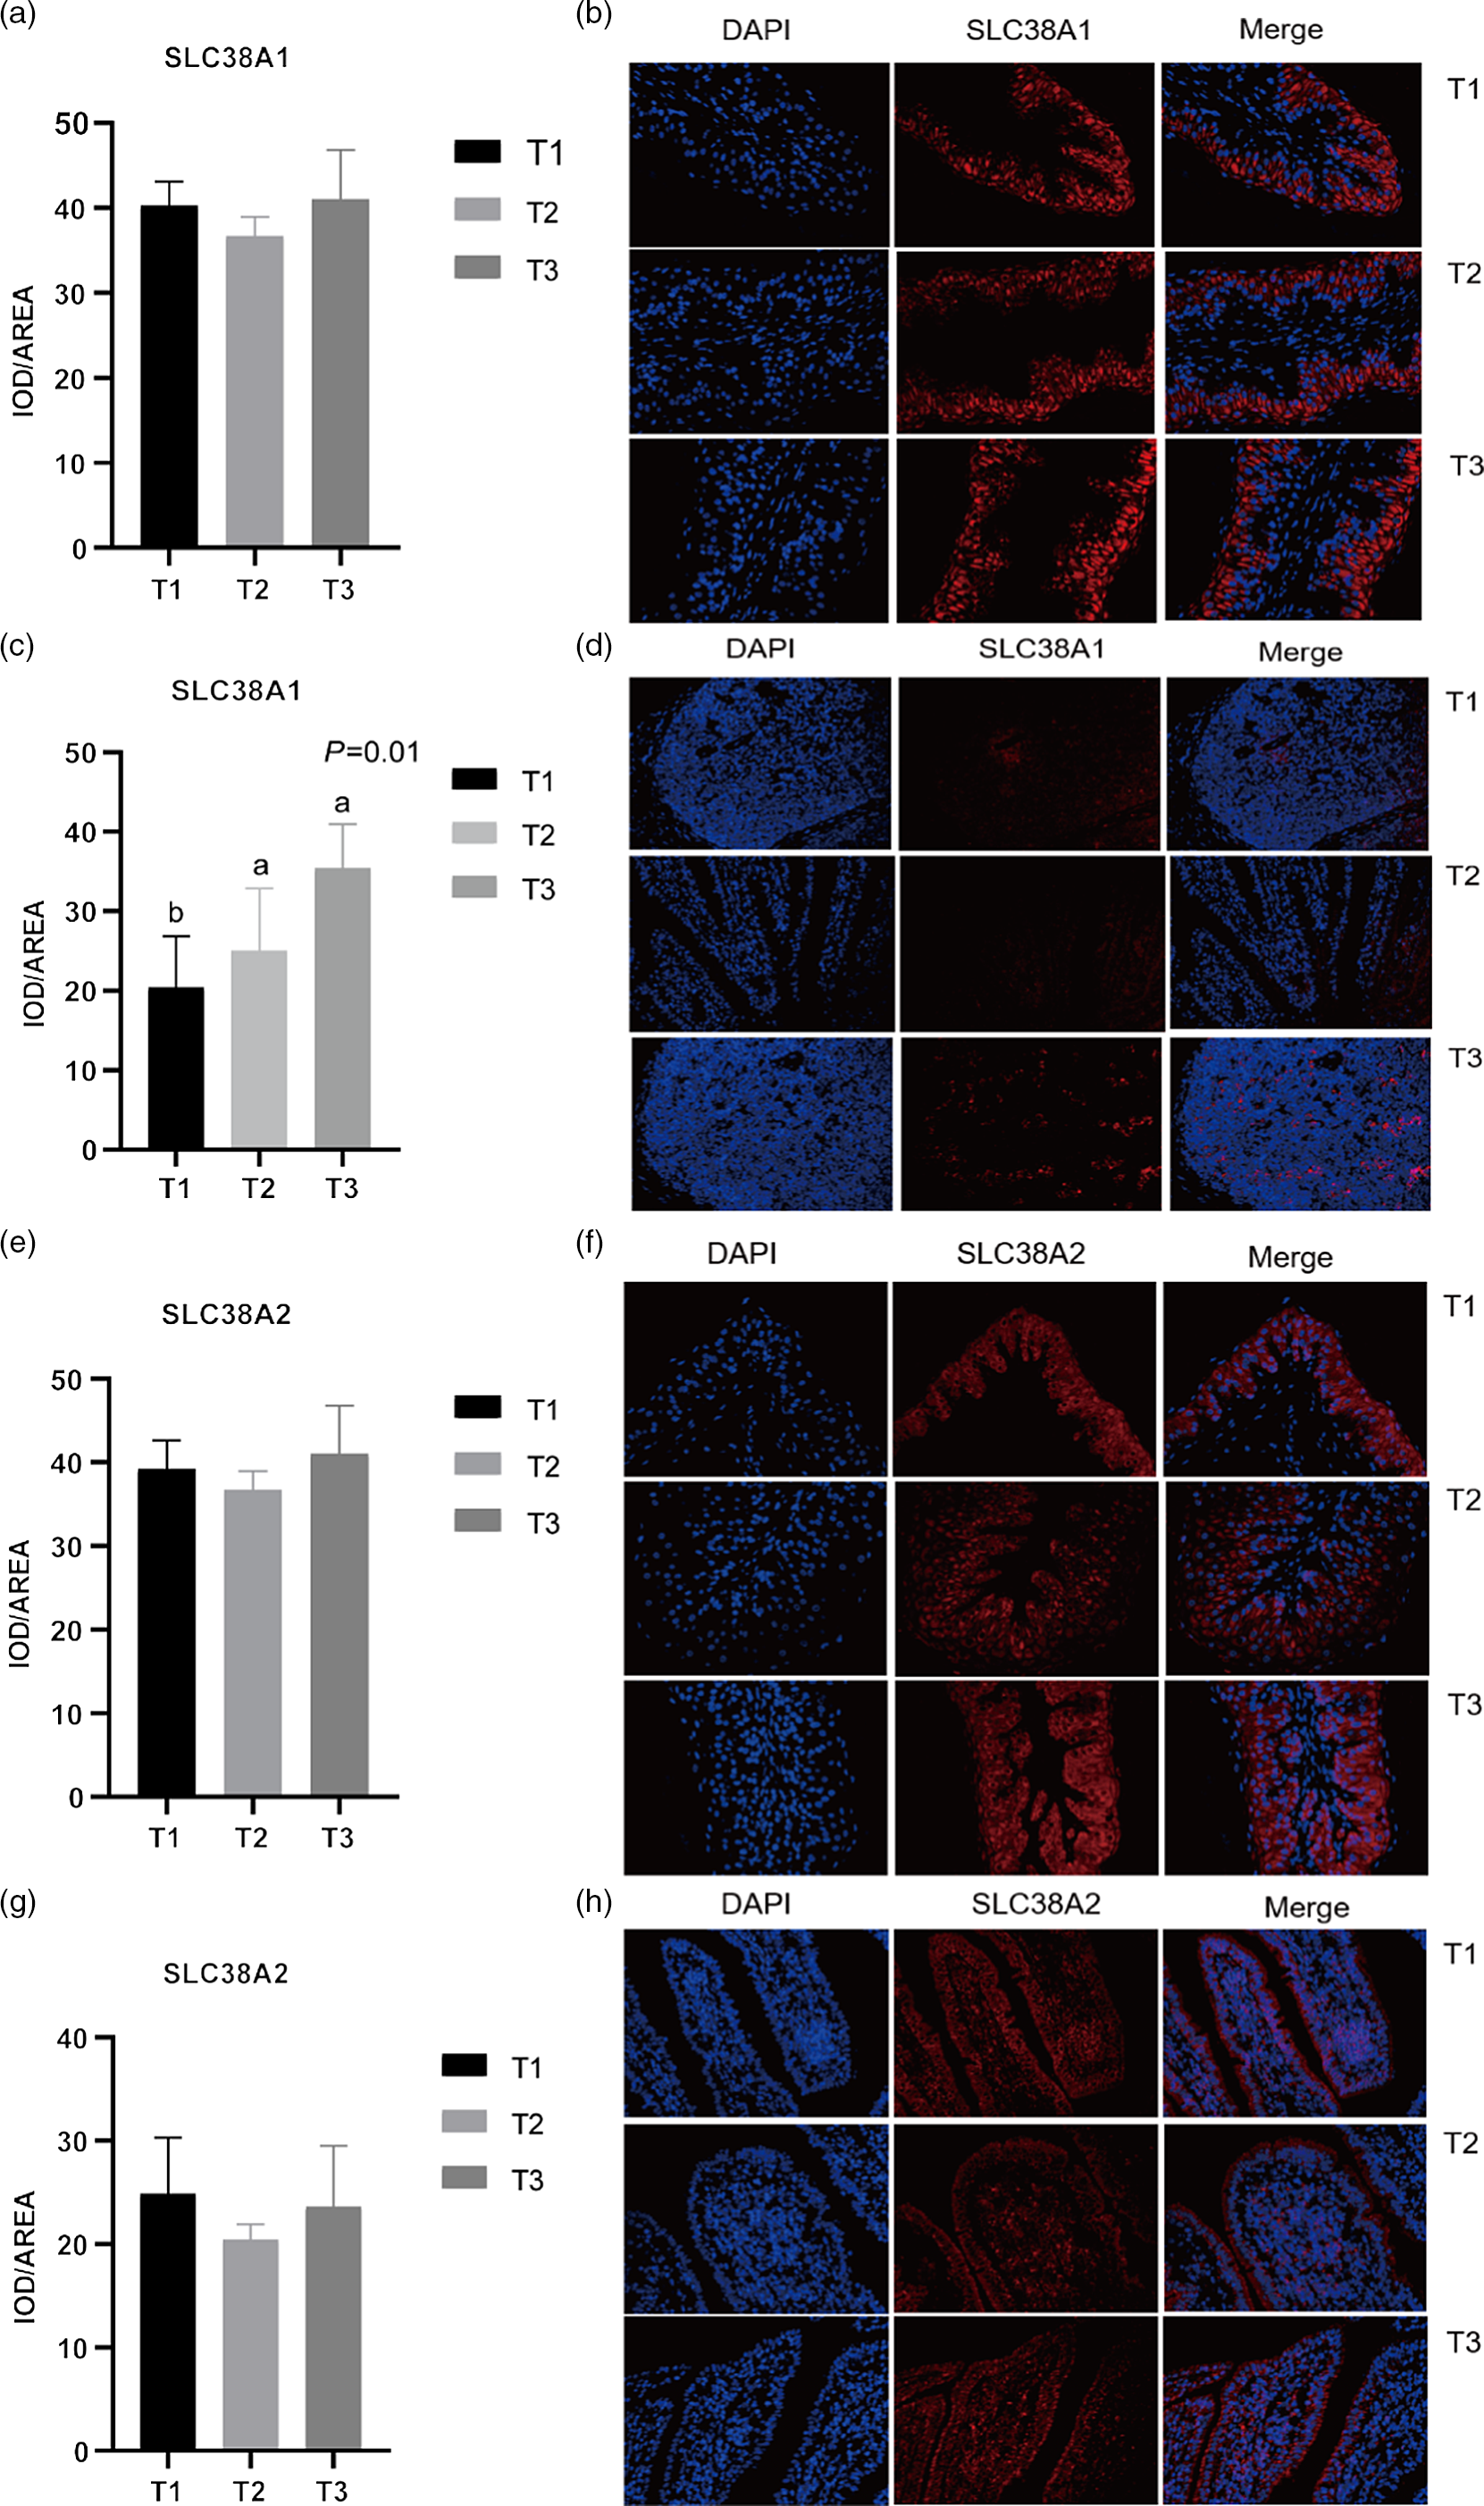
Fig. 1. Mean optical density and representative staining of solute carrier family 38 member 1 (SLC38A1) in the rumen (a), (b) and ileum (c), (d); mean optical density and representative staining of solute carrier family 38 member 2 (SLC38A2) in the rumen (e), (f) and ileum (g), (h). All photos were taken at 400×, with nuclei stained in blue and target protein stained in red. Treatments were: T1 (normal maize 100%, high amylose maize 0%); T2 (normal maize 50 %, high amylose maize 50 %); T3 (normal maize 0 %, high amylose maize 100 %); Statistical significance was accepted at P < 0·05.
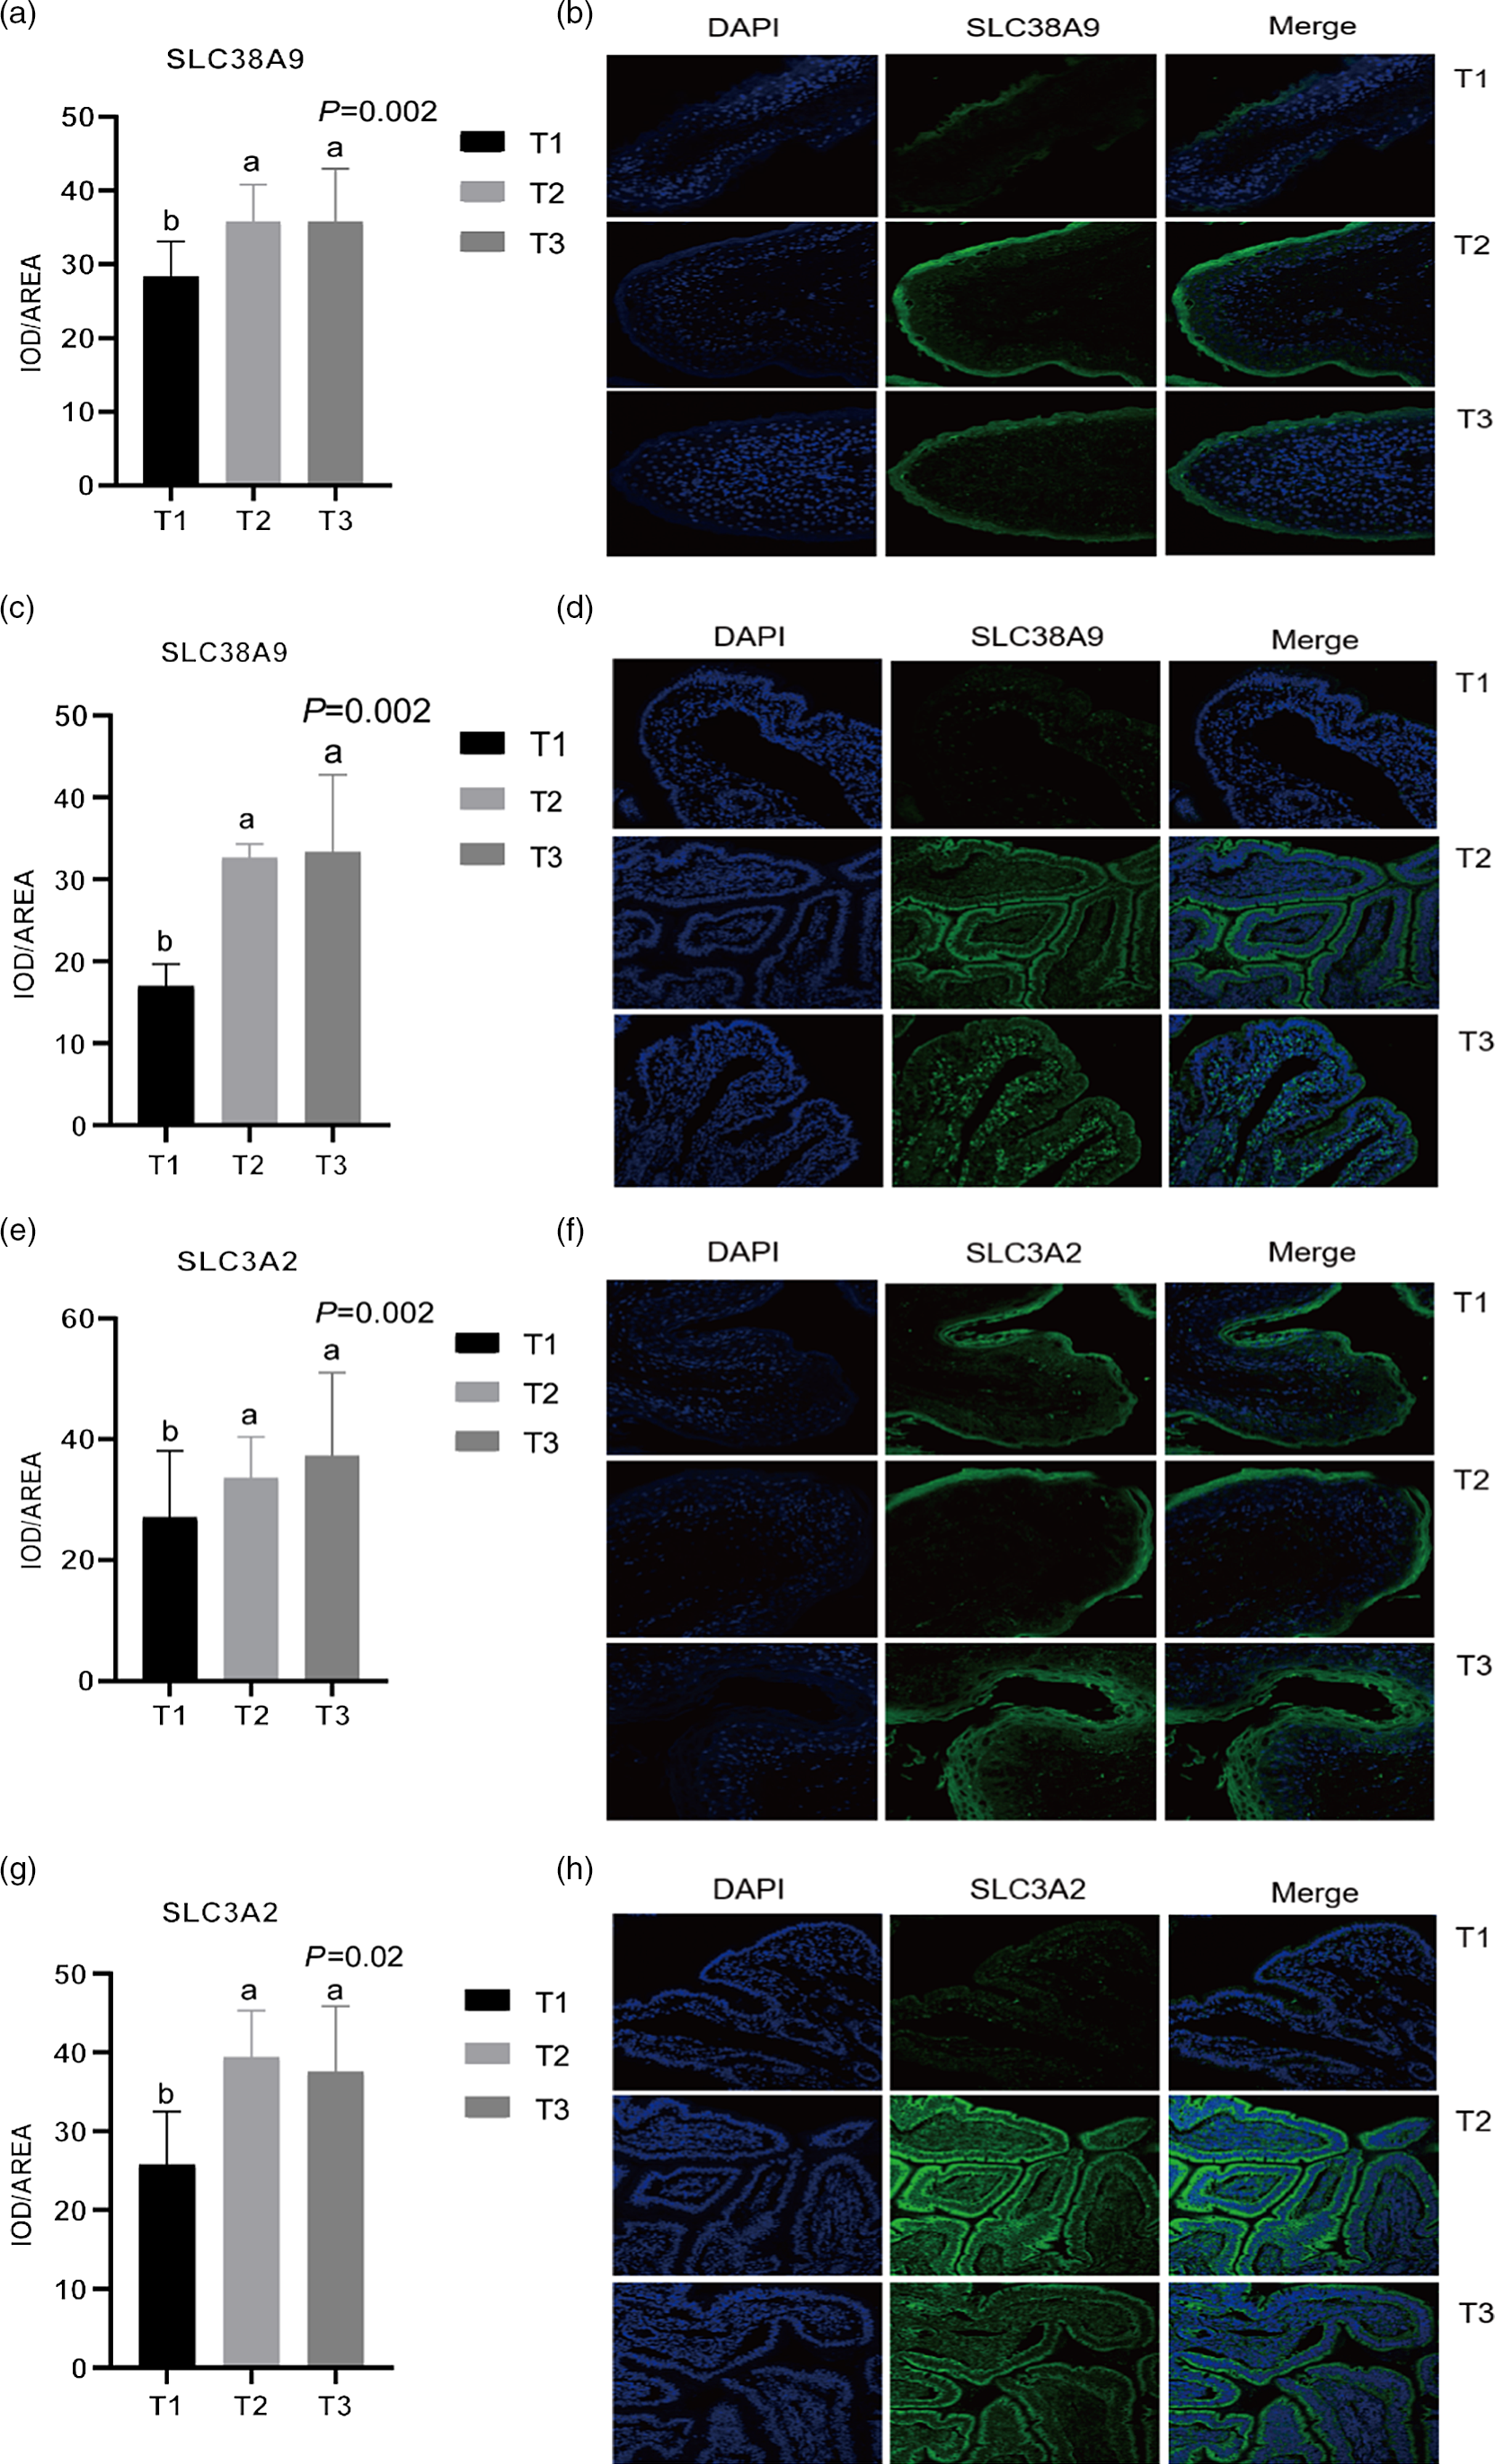
Fig. 2. Mean optical density and representative staining of solute carrier family 38 member 9 (SLC38A9) in the rumen (a), (b) and ileum (c), (d); mean optical density and representative staining of solute carrier family 3 member 2 (SLC3A2) in the rumen (e), (f) and ileum (g), (h). T1 (normal maize 100 %, high amylose maize 0 %); T2 (normal maize 50 %, high amylose maize 50 %); T3 (normal maize 0 %, high amylose maize 100 %). Statistical significance was accepted at P < 0·05.
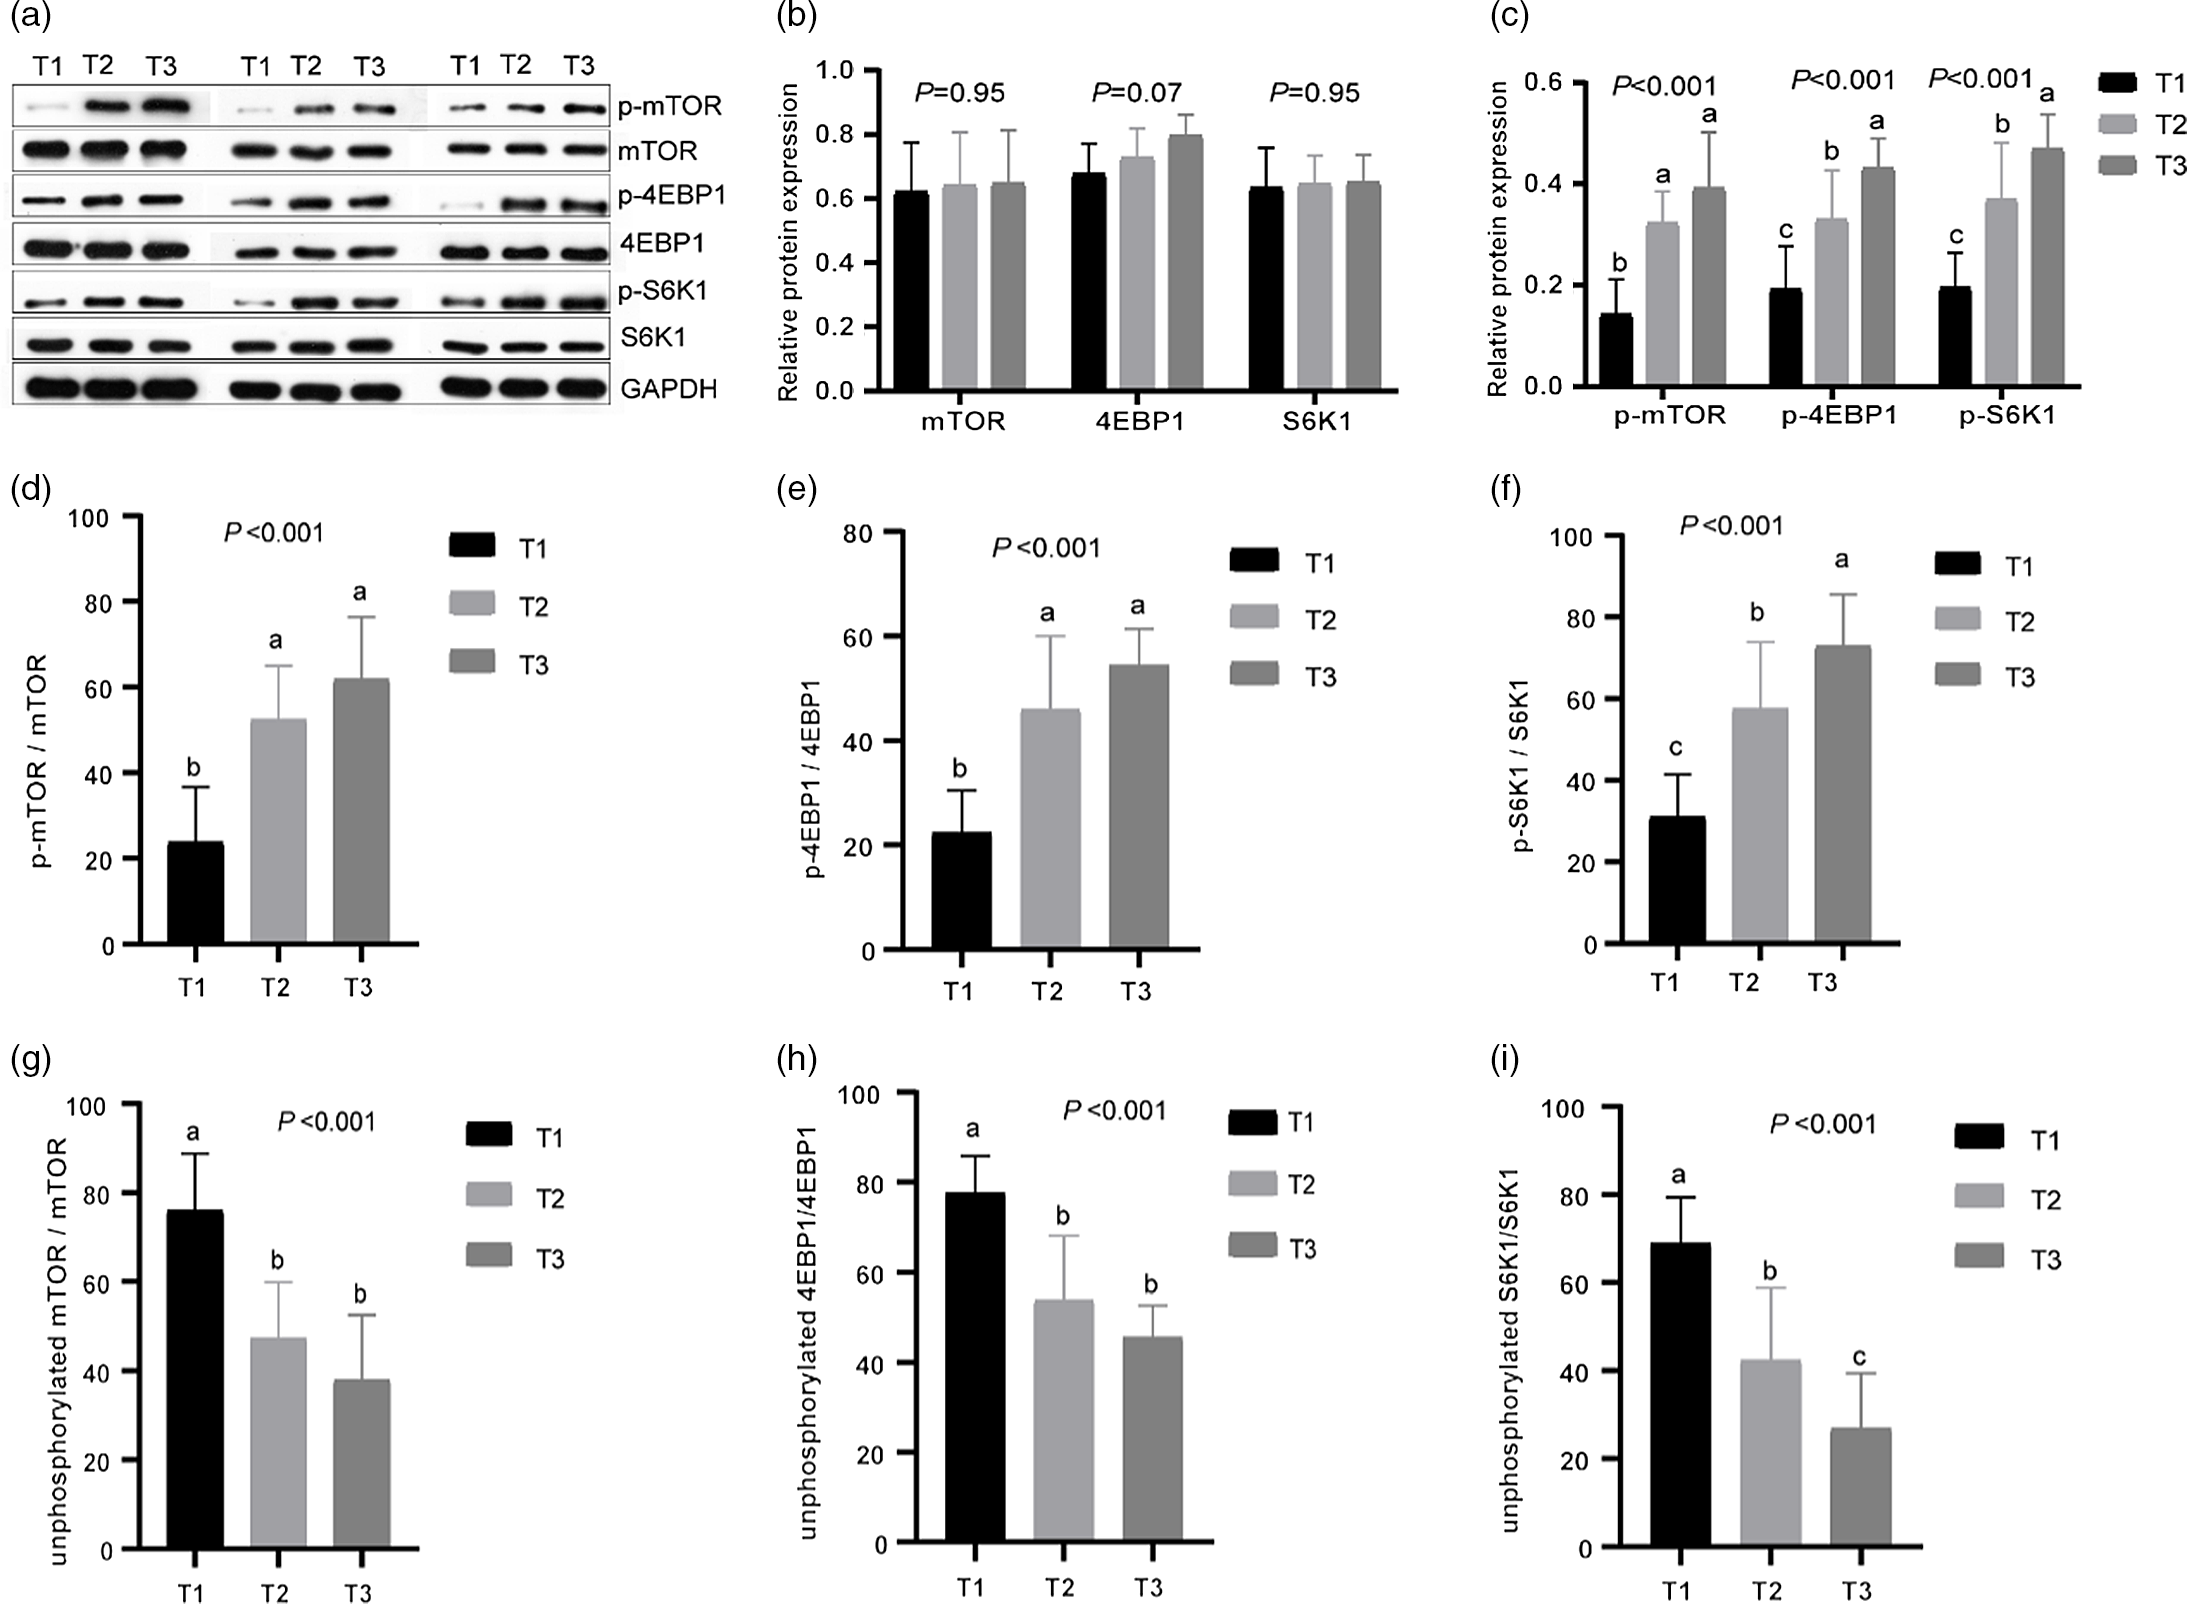
Fig. 3. Effects of different dietary amylose:amylopectin ratios on protein expression of phosphorylated and unphosphorylated mammalian target of rapamycin (mTOR), 4E-binding protein 1 (4EBPI), ribosomal protein S6 kinases 1 (S6K1) in the longissimus muscle of goat. (a) Representative lanes of Western blot analysis; (b) relative protein expression of mTOR, 4EBP1 and S6K1; (c) relative protein expression of phosphorylated mammalian target of rapamycin (p-mTOR), phosphorylated 4E-binding protein 1 (p-4EBP1) and phosphorylated ribosomal protein S6 kinases 1 (p-S6K1); (d), (f) phosphorylation ratio of mTOR, 4EBP1 and S6K1. (g), (i) Unphosphorylation ratio of mTOR, 4EBP1 and S6K1. T1 (normal maize 100%, high amylose maize 0 %); T2 (normal maize 50 %, high amylose maize 50 %); T3 (normal maize 0 %, high amylose maize 100 %). a,b,cMean column with different superscripts differ (P < 0·05).
Relative mRNA levels of branched-chain amino acid metabolism enzymes and their activities
The mRNA levels of the branched-chain AA (BCAA) metabolising enzymes, including ACADSB, BCAT1, BCAT2, BCKDHA, BCKDHB and ACADS, in the ruminal mucosa were not altered (P > 0·05) by dietary amylose:amylopectin ratios (Table 6). However, the mRNA levels of ACADSB (linear, P = 0·04), BCAT1 (quadratic, P = 0·02) and BCKDHB (linear, P = 0·01) in the ileum decreased significantly with the increment of dietary amylose:amylopectin ratios, with greater (P < 0·05) expression in T1 than in T2 and T3
Table 6. Effects of different amylose:amylopectin ratios on relative mRNA expression of branched-chain amino acid metabolising enzymes in the ruminal and ileal mucosal of goat
(Mean values and standard errors of the mean)
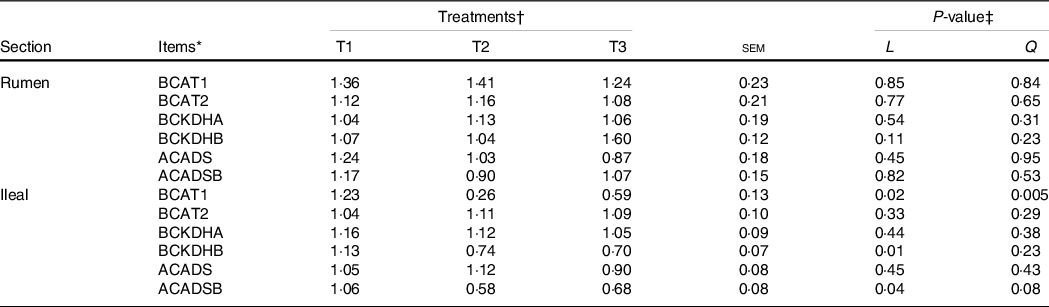
* BCKDHA, branched-chain α-keto acid dehydrogenase E1, α polypeptide; BCKDHB, branched-chain keto acid dehydrogenase E1 subunit beta; ACADS, acyl-CoA dehydrogenase short-chain; ACADSB, acyl-CoA dehydrogenase short/branched-chain; BCAT1, branched-chain AA transaminase 1; BCAT2, branched-chain amino acid transaminase 2.
† Treatments were: T1 (normal maize 100 %, high amylose maize 0 %); T2 (normal maize 50 %, high amylose maize 50 %); T3 (normal maize 0 %, high amylose maize 100 %).
‡ L and Q represent linear and quadratic response to increasing amylose:amylopectin ratio.
Table 7. Effects of different amylose:amylopectin ratios on activities of branched-chain amino acid metabolising enzymes (U/mg of protein) in the rumen and ileum of goat
(Mean values and standard errors of the mean)
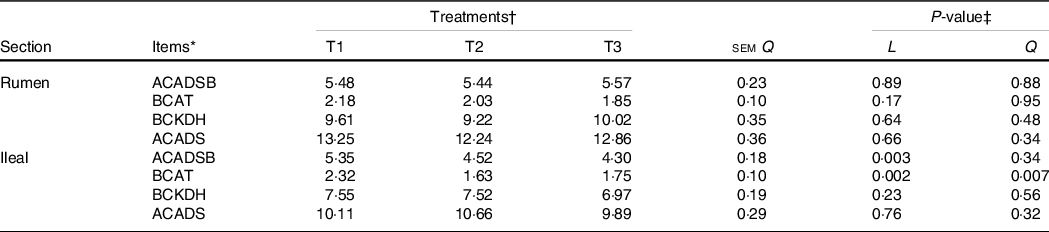
* BCKDH, branched-chain keto acid dehydrogenase complex; ACADS, acyl-CoA dehydrogenase short-chain; ACADSB, acyl-CoA dehydrogenase short/branched-chain; BCAT1, branched-chain AA transaminase 1; One unit of enzyme activity was defined as ……. mg of protein.
† Treatments were: T1 (normal maize 100 %, high amylose maize 0 %); T2 (normal maize 50 %, high amylose maize 50 %); T3 (normal maize 0 %, high amylose maize 100 %).
‡ L and Q represent the linear and quadratic response to increasing amylose:amylopectin ratio.
The activity of BCAA metabolising enzymes in the rumen and ileum was measured, and there were no differences (P>0·05) in enzyme activity in the rumen mucosa among treatments (Table 7). The activities of ACADSB and BCAT in the ileal mucosa decreased linearly (P < 0·05) as dietary amylose:amylopectin increased.
Table 8. Effects of different dietary amylose:amylopectin ratios on the expression of genes related to muscle protein synthesis of goat
(Mean values and standard errors of the mean)

* mTOR, mammalian target of rapamycin; 4EBPI, 4E-binding protein 1; S6K1, ribosomal protein S6 kinases 1.
† Treatments were: T1 (normal maize 100 %, high amylose maize 0 %); T2 (normal maize 50 %, high amylose maize 50 %); T3 (normal maize 0 %, high amylose maize 100 %).
‡ L and Q represent linear and quadratic response to increasing amylose:amylopectin ratio.
The mRNA levels and protein abundances of mammalian target of rapamycin, 4E-binding protein 1 and ribosomal protein S6 kinases 1
Expression of mTOR, 4EBP1 and S6K1 in longissimus dorsi muscle was measured at mRNA and protein level (Table 8 and Fig. 3). The mRNA levels of mTOR, 4EBP1 and S6K1 increased linearly (P < 0·05) with increasing dietary amylose contents, with greater values observed in T2 and T3 than in T1 (Table 2). The protein abundances of mTOR, 4EBP1 and S6K1 did not differ (P > 0·05) among treatments; however, the relative protein abundances of p-mTOR, p-4EBP1 and p-S6K1 increased linearly (P < 0·01) with increasing dietary amylose contents, with greater p-mTOR in T2 and T3 than in T1, and greater p-4EBP1 and S6K1 in T3 than in T2 and T1 (Fig. 3). Therefore, the phosphorylated:non-phosphorylated ratio of mTOR, 4EBP1 and S6K1 was elevated significantly (P < 0·01) in T2 and T3 compared with T1.
Discussion
The rumen and small intestines are the main places for digestion and absorption of nutrients in ruminants. Previous studies have revealed that the type of starch in the diets can affect the body’s energy and protein metabolism(Reference Drew, Schafer and Zijlstra10,Reference Yang, Chen and Yu12,Reference Hundal and Taylor22) . In the current study, we found that increasing the ratio of amylose in the diet could reduce the deposition of AA in the ileal mucosa of goats, but increase the content of leucine, valine, tryptophan and total AA in the plasma, which suggests that more AA would be transported from the mucosa to the blood to maintain higher protein synthesis and rapid growth of muscles. Not surprisingly, we noticed that a high percentage of amylose diets could promote the deposition of aspartate, alanine, leucine and proline in the longissimus dorsi muscle of goats. Similarly, a previous study has demonstrated that when goats are given high amylose diets, the plasma BCAA (leucine, isoleucine and valine) content tends to rise(Reference Wang, Wang and Tan23). The concept has been established that it is feasible to increase the levels (including BCAA) of serum metabolites to regulate animal production in animal husbandry(Reference He, Chen and Yu24–Reference Wiltafsky, Pfaffl and Roth26). High leucine in plasma is usually thought to promote protein synthesis in skeletal muscle(Reference Escobar, Frank and Suryawan27,Reference Escobar, Frank and Suryawan28) . Our parallel studies have shown that diets with a high amylose ratio can improve goat growth performance. The increase of BCAA in the blood could promote muscle protein synthesis, so the goats fed high amylose diet should have stronger protein synthesis capacity and deposit more protein in muscle.
The AA that entered the small intestinal mucosa can be either used by the intestinal mucosa (AA are oxidised to provide energy, protein synthesis, etc.) or be transported into the blood by AA transporters to be used by other tissues. In this study, goats consumed a high proportion of amylose diets activated the mRNA expression of SLC38A1 and SLC38A2 in the rumen and ileum. Our data showed a high amylose diet up-regulated the protein abundances of AA transporters in the ileal mucosa, such as SLC3A2 and SLC38A9. SLC38A2 and SLC3A2 are involved in the transport of BCAA, which can pass extracellular glutamine and Na+ through the cell membrane into the cytoplasm(Reference Nicklin, Bergman and Zhang29). Previous studies have clarified the importance of BCAA to promote protein synthesis by activating mTORC1(Reference Chen, Su and Kang30–Reference Escobar, Frank and Suryawan32). The increased protein abundances of SLC38A1, SLC38A2 and SLC3A2 in the rumen and ileum of goats fed a high amylose ratio diet allowed more BCAA to be transported into the blood to maintain better growth performance.
The AA in the diets are the fuel source of the small intestinal mucosa, and as a substrate for protein synthesis in the small intestines, AA are essential for the growth and integrity of the small intestine mucosa(Reference Wu, Knabe and Flynn33). The BCAA can be decomposed and utilised in the intestinal mucosa(Reference Wu34). Our results indicate that an increase in the ratio of amylose in the diet could inhibit the mRNA expression of BCAA metabolising enzymes (ACADSB, BCAT1 and BCKDHB) in goat ileal mucosa. The first step in the catabolism of BCAA is the transfer of α-amino groups to α-ketoglutarate through the BCAT1 and BCAT2 enzymes(Reference Tönjes, Barbus and Park35). Two crucial and irreversible reactions of BCAA catabolism require the participation of BCKDH complex and acyl-CoA dehydrogenase (ACAD)(Reference Alfardan, Mohsen and Copeland36–Reference Webb, Sadri and Soosten38). Furthermore, after feeding goats a high amylose diet, the metabolic enzyme activities of BCAA in the ileum mucosa also decreased, indicating that the high amylose diet could reduce the metabolism of amylopectin in the intestinal mucosa. This result supports our hypothesis: after goats consumed high amylose diets, the use of BCAA in the intestine would be reduced, increasing the content of BCAA entering the blood. The cause for this outcome might be that amylose had a slower digestion rate in the small intestines compared with amylopectin and could maintain a stable glycaemic index for a long time, so that the small intestine mucosa could preferentially use glucose for energy source, reducing part of the energy supply by oxidation of AA. Our results suggest that different starch types in the diet can affect the metabolism of AA in the intestinal mucosa of goats, especially for BCAA.
In mammals, activated mTOR plays a vital role in regulating protein synthesis through its downstream targets S6K1 and 4EBP1 in the body(Reference Gorissen and Phillips39,Reference Panzhinskiy, Culver and Ren40) . It has been reported that higher dietary amylose content reduces fat deposition and enhances protein deposition by altering the insulin/PI3K/Akt/mTOR signalling pathway in finishing pigs(Reference Xie, Li and Li41). In the present study, the mRNA levels and protein abundances of genes related to protein synthesis (mTOR(Reference Manjarín, Columbus and Suryawan42), 4EBP1 and S6K1) were determined in goat muscle, and the mRNA and protein expression and phosphorylation ratio of mTOR, 4EBP1 and S6K1 were enhanced in the muscles of goats fed diets with a higher amylose:amylopectin ratio v goats fed a diet of low amylose:amylopectin ratio. This would be because high content of AA in plasma activated mTOR and enhanced the expression of its downstream targets S6K1 and 4EBP1. Similarly, a previous study has demonstrated that providing pigs with a higher percentage of amylopectin diet significantly reduced protein synthesis(Reference Xie, Li and Li41,Reference Deng, Wu and Bin43) . Our results further explained the possible mechanism by which high amylose diets to promote protein synthesis from the perspective of AA transport and metabolism (especially BCAA). The mTOR pathway may be the main factor regulating goat muscle protein deposition under different starch type diets.
A major finding was that higher dietary amylose contents not only elevated the mRNA levels and protein abundances of BCAA transporters (SLC38A1, SLC38A2) in the ileum of goats but also reduced the mRNA levels and activity of BCAA metabolising enzymes (ACADSB, BCAT, BCKDH), thus leading to an increase in the content of BCAA in the plasma. Furthermore, the high content of BCAA in the blood promotes protein synthesis in the longissimus dorsi muscle, which was likely mediated by the mTOR signalling pathway. The current results would help us better understand how dietary starch structure affects animal muscles growth by affecting AA metabolism.
Acknowledgements
The authors would like to thank Can Peng and Meimei Geng from the Institute of Subtropical Agricultural Ecology, Chinese Academy of Sciences for their help during the experiment.
This work was supported by National Natural Science Foundation of China (31730092; U20A2057; 31772632); STS Project of the Chinese Academy of Sciences (KFJ –STS- ZDTP −075).
C.-S. Z.,Y. L. and Z.-L. T. designed the experiment. X.-K. L. and K. C. conducted the experiment. X.-K. L., J.-J. X., A. R. and L. C. collected and analysed data. X.-K. L., C.-S. Z., T. R. and J.-Z. J. wrote and revised the manuscript.
The authors declare that no conflict of interest exists.
Supplementary material
For supplementary material referred to in this article, please visit https://doi.org/10.1017/S0007114521002087


 Open access