


Recent evidence suggests that vitamin D deficiency has several deleterious effects: for example, an increased risk for CVD( Reference Wang, Song and Manson 1 ), CVD risk factors such as hypertension( Reference Kunutsor, Apekey and Steur 2 ) and type 2 diabetes( Reference Song, Wang and Pittas 3 ), impaired kidney function, and proteinuria( Reference Damasiewicz, Magliano and Daly 4 ). This fact has generated great interest because of the fact that vitamin D deficiency is considered an important public health problem worldwide( Reference Palacios and Gonzalez 5 ).
The major circulating form of vitamin D is 25-hyroxyvitamin D (25(OH)D), which is used to evaluate vitamin D status. The most important risk factor for vitamin D deficiency is inadequate exposure to sunlight, due not only to shorter exposure time, but also to the season, latitude, altitude, clothing and sunscreen use. Cutaneous synthesis of vitamin D may be lower in people with naturally dark skin tone and in the elderly. Obesity is associated with vitamin D deficiency, as greater amounts of subcutaneous fat sequester more of the vitamin D and decrease its release into the circulation( Reference Holick, Binkley and Bischoff-Ferrari 6 , 7 ).
Kidney transplantation is the treatment of choice for most patients with end-stage renal disease (ESRD)( Reference Magee and Pascual 8 ). Renal transplant recipients (RTR) have better survival rates than dialysis patients( Reference Tonelli, Wiebe and Knoll 9 ), but present a higher risk for premature mortality due to CVD compared with the general population( Reference Jardine, Gaston and Fellstrom 10 ). Long-term outcomes in RTR may also be impaired by progressive graft dysfunction and eventual allograft loss with return to dialysis( Reference Nankivell and Kuypers 11 ).
Studies conducted predominantly in high-latitude locations have shown that vitamin D deficiency is common among RTR( Reference Marcén, Jimenez and Fernández-Rodriguez 12 – Reference Obi, Hamano and Ichimaru 14 ). Possible reasons include avoidance of sunlight exposure to reduce the enhanced risk for skin cancer and the use of immunosuppressive drugs (especially corticosteroids) that accelerate vitamin D catabolism( Reference Sarno, Daniele and Tirabassi 15 ). Another issue that may contribute to hypovitaminosis D is excessive body adiposity. Post-transplant (post-tx) obesity is very common and occurs in up to 50 % of patients, with an average weight gain of 10–35 %, mostly within the first 12 months( Reference Chan, Bosch and Jones 16 ).
In the general population, obesity increases the risk for CVD morbidity and mortality( Reference Piepoli, Hoes and Agewall 17 ), ESRD( Reference Kramer, Gutiérrez and Judd 18 ) and proteinuria( Reference Praga and Morales 19 ). Furthermore, there is evidence that obesity is associated with CVD risk factors and graft failure in RTR( Reference Hoogeveen, Aalten and Rothman 20 , Reference Fernandes, Leal and Rioja 21 ).
Vitamin D deficiency is poorly reported in RTR living in low-latitude cities. To the best of our knowledge, the association of vitamin D deficiency with CVD risk factors, impaired kidney function and proteinuria, adjusted for body adiposity assessed by a ‘gold standard’ method, has not been described so far. The adjustment for body adiposity assessed by an accurate method may contribute to a better understanding of the association of these factors with vitamin D deficiency. Therefore, the aim of this study was to evaluate the following in RTR living in a low-latitude city: (1) vitamin D status; (2) the association of vitamin D with total and central body adiposity evaluated by different methods including the ‘gold standard’ dual-energy X-ray absorptiometry (DXA); and (3) the association of vitamin D with CVD risk factors, proteinuria and the estimated glomerular filtration rate (eGFR), taking into account the impact of body adiposity.
Methods
This cross-sectional study was conducted in RTR undergoing regular treatment at the renal transplant outpatient clinic at Pedro Ernesto University Hospital (Rio de Janeiro State University, Rio de Janeiro, Brazil). This study followed the guidelines laid down in the Declaration of Helsinki, and all procedures involving human subjects/patients were approved by the Committee on Ethics and Research of the Pedro Ernesto University Hospital (CAAE: 41895015.0.0000.5259). Participants were enrolled between April and November 2015 and written informed consent was obtained from all patients.
The participants included were men and women aged between 18 and 65 years who had received a kidney transplant at least 6 months before inclusion in the study. The exclusion criteria were as follows: (1) use of vitamin D supplements; (2) presence of AIDS, cancer, autoimmune diseases, acute illness, amputation and mental disorders; (3) pregnancy or lactation in women; (4) dialysis in RTR; and (5) BMI<18·5 kg/m2.
Participants who met the eligibility criteria and agreed to take part in the study were submitted to clinical, nutritional and laboratory evaluations. Anthropometric measurements, as well as blood collections, were performed from 07.00 to 09.00 hours after a 12-h fasting period. The study population lived in Rio de Janeiro, a coastal low-latitude city (22°54'10"S) in Brazil, a tropical climate country, with intense UV rays throughout the year, but with higher temperatures in the summer. In the present study blood samples were not collected during the summer (December to March), in order to prevent seasonal variation in serum vitamin D.
Data collected from patient charts included the weight gained during the 1st year post-tx, date of transplant, type of graft donor and the current use of drugs. During an interview before transplantation, participants were briefed about the renal replacement therapy and effects of sun exposure and lifestyle habits. Those who smoked at least one cigarette a day or those who stopped smoking 6 months before therapy were considered smokers; and those who were engaged in physical activities, including light activities, such as walking for at least 30 min three times a week, were considered physically active.
Blood pressure and heart rate were recorded using a calibrated and semiautomatic sphygmomanometer device: OMRON® model HEM-742INT (Omron Healthcare) after a resting period of 10 min. The first reading was discarded and the mean of three consecutive readings, taken in the non-dominant arm, with 3 min intervals between them was used in the study. An appropriate arm cuff was used, and the patient was instructed to stay seated, with legs uncrossed and feet on the floor, while leaning back in the chair with the arm at heart level, free from tight clothing, supported with the palm facing up and the elbow slightly flexed.
Anthropometric assessment
The anthropometric measurements were performed by two experienced renal dietitians. Height was measured using a stadiometer accurate to ±0·5 cm and weight was obtained with a digital scale, accurate to ±0·1 kg (Filizola S.A.) with participants wearing light clothing and no shoes and with an empty bladder. BMI was calculated using the standard equation (kg/m2)( 22 ).
Waist circumference (WC) was measured in the standing position midway between the lowest rib and the iliac crest, at mid-exhalation. Hip circumference (HC) was measured at the widest point over the hip/buttocks area with the tape parallel to the floor( 23 ). Waist:hip ratio (WHR) was obtained by dividing the WC (cm) by HC (cm). Waist:height ratio was obtained by dividing WC (cm) by height (cm). Anthropometric measurements were taken twice and mean values were used.
Dual-energy X-ray absorptiometry
The DXA procedure was performed by a trained technician using a Lunar DPX Bone Densitometer (GE Medical Systems) with the patient in the supine position. The DXA system performs rectilinear scans over the length of the body. The scan begins at the top of the patient’s head and moves downward towards the feet. The program allows scanning up to 205 lines. During the scan, the source shutter opens to emit an X-ray beam. The software calculates fat mass, lean tissue mass and bone mineral mass. Fat-free mass is calculated as the sum of lean tissue plus bone mineral mass. Body composition is evaluated in the total body and different sites, such as the trunk.
Laboratory parameters
Blood samples were analysed to measure creatinine, urea, uric acid, Hb, glucose, total cholesterol (TC), HDL-cholesterol, TAG, Ca, P, Na, K, total protein and albumin. Urine samples (three per participant) were used to evaluate proteinuria through protein:creatinine ratio (mg/g). These analyses were performed at the Pedro Ernesto University Hospital’s central laboratory. Glucose was determined by the enzymic method. Uric acid, TC, HDL-cholesterol and TAG concentrations were assessed by using the enzymatic colorimetric method. LDL-cholesterol was estimated by using the Friedewald formula( Reference Friedewald, Lévy and Fredckson 24 ). Serum Ca was determined by complexometry. Serum albumin was assessed by the colorimetric technique; Na and K were assessed by the selective electrode method; P was assessed by the phosphomolybdate method; and urea was assessed by the kinetic method. Protein (urine and serum) was determined by the colorimetric technique and creatinine (urine and serum) by the kinetic method. Creatinine was calibrated to IDMS (isotope dilution mass spectrometry): Cobas 6000 (Roche/Hitachi).
Insulin, 25(OH)D and parathyroid hormone (PTH) were determined at the Laboratory of Endocrine Physiology at the Pedro Ernesto University Hospital. Serum levels of 25(OH)D, PTH (intact molecule) and insulin were determined by the electrochemiluminescence immunoassay using a commercial kit (Roche Diagnostics). The vitamin D kit was standardised against liquid chromatography-MS, presenting a sensitivity of 4·01 ng/ml (CV 18·5 %); range of 3·00–70·00 ng/ml; and a within-run precision (repeatability) of <15 (sd ≤1) ng/ml, >15 ng/ml: ≤6·5 %.
Insulin resistance status was assessed using the homoeostasis model assessment of insulin resistance (HOMA-IR) index, which was calculated as fasting insulin (μU/ml)×fasting plasma glucose (mmol/l)/22·5( Reference Matthews, Hosker and Rudenski 25 ). Circulating levels of high-sensitivity C-reactive protein were determined by the turbidimetry method (BioSystems) at the Lipids Laboratory of the Rio de Janeiro State University.
eGFR was evaluated using the Chronic Kidney Disease Epidemiology Collaboration equation( 26 ).
CVD risk factors
The CVD risk factors evaluated in the present study included hypertension, diabetes, dyslipidaemia and the metabolic syndrome. Patients were considered hypertensive when their systolic and/or diastolic blood pressure levels were ≥140 and/or ≥90 mmHg, respectively, or if they were on antihypertensive therapy( Reference Malachias, Souza and Plavnik 27 ); and considered diabetic when their fasting glucose levels were ≥7·0mmol/l, or if they were taking insulin or an oral antidiabetic drug( 28 ). Dyslipidaemia was diagnosed when TC ≥5·2mmol/l, LDL-cholesterol ≥3·4mmol/l, TAG ≥1·7mmol/l, or HDL-cholesterol <1·29mmol/l (women) and <1·03mmol/l (men) or when patients used lipid-reducing drugs( Reference Jellinger, Smith and Mehta 29 ). The metabolic syndrome was defined on the basis of the presence of any three of the following five criteria: (1) WC ≥90 cm in men and ≥80 cm in women; (2) TAG ≥1·7mmol/l or the use of drugs to lower TAG; (3) HDL-cholesterol <1·29mmol/l (women) and <1·03mmol/l (men) or treatment with drugs that raise HDL-cholesterol; (4) systolic and/or diastolic blood pressure ≥130 and/or ≥85 mmHg, respectively, or use of antihypertensive drugs; and (5) fasting glucose ≥5·6mmol/l or use of drugs to lower blood glucose( Reference Alberti, Eckel and Grundy 30 ).
Statistical methods
The sample size of this study was determined based on the study conducted by Marcén et al. ( Reference Marcén, Jimenez and Fernández-Rodriguez 12 ), which observed 77·3 % of RTR with vitamin D insufficiency or deficiency. Considering that the total number of kidney transplant outpatients in the Pedro Ernesto University Hospital is 450, and considering a 95 % CI, the minimum sample size should be 170 patients.
Participants were stratified into three groups according to their serum levels of 25(OH)D. RTR with values <16 ng/dl were allocated to the vitamin D deficiency group, those presenting values of 16–30 ng/ml were included in the vitamin D insufficiency group, whereas RTR with serum 25(OH)D >30 ng/ml were allocated to the vitamin D sufficiency group( 31 ).
Categorical variables were expressed as percentages and compared using the χ 2 test. Mean values and standard deviations were used to summarise continuous variables with normal distribution, whereas median and interquartile intervals were used to summarise variables with a non-normal distribution. Normality was tested by the Shapiro–Wilk normality test and skewed data were log-transformed. The differences between two groups were analysed using Student’s t test and those between three groups were analysed using ANOVA with the Bonferroni post hoc test.
Multiple linear and logistic regressions were performed to assess the association of vitamin D with body adiposity, CVD risk factors, proteinuria and eGFR.
We used multiple logistic regression analysis to assess the likelihood of having cardiometabolic risk factors (the metabolic syndrome, dyslipidaemia, hypertension and diabetes mellitus) with 25(OH)D concentration as the main explanatory variable. Four logistic regression models were fitted for each of the cardiometabolic risk factors as the dependent variable. In model 1, 25(OH)D concentration was the sole explanatory variable in a univariate (unadjusted) analysis. Model 2 was adjusted for age, sex and eGFR. To address the possible modifying effect of body adiposity, model 3 was further adjusted for percentage of total body fat (BF) DXA and in model 4, percentage of trunk BF DXA was substituted for percentage of total BF DXA. The Hosmer–Lemeshow test was used to assess the goodness-of-fit of the logistic regression models (Table 4).
To evaluate the independent association of 25(OH)D concentration with proteinuria or with eGFR as dependent variables, three models were fitted, using the multiple linear regression analysis. Model 1 was adjusted for age and sex, model 2 was further adjusted for percentage of total BF DXA and model 3 substituted percentage of trunk BF DXA for percentage of total BF DXA (Table 5).
All statistical analyses were performed using SPSS 20.0 (SPSS). P<0·05 was considered statistically significant.
Results
A total of 337 RTR were interviewed, of whom 197 met the eligibility criteria and agreed to participate in the study, and 195 completed all evaluations and were included in statistical analyses (Fig. 1). The participants’ mean age was 47·6 (sd 11·2) years, with 58 % (n 114) being men, at 117·6 (sd 92·6) months post-tx, and having mean 25(OH)D serum levels of 31·4 (sd 13·1) ng/ml. The analysis of vitamin D status revealed that 10 % (n 19) of the participants had vitamin D deficiency, 43 % (n 85) presented insufficiency and 47 % (n 91) had adequate vitamin D levels.

Fig. 1 Flow diagram of study participants.
The main characteristics of the participants, according to vitamin D status, are shown in Table 1. Patients presenting vitamin D deficiency had a significantly higher percentage of women compared with subjects with insufficiency and sufficiency (Table 1). The percentage of women in the postmenopausal period was similar in the three categories of vitamin D status (data not shown). Azathioprine use was greater in participants presenting sufficient vitamin D status (Table 1). The three groups were comparable with respect to age, time of transplantation, type of graft donor, time on renal replacement therapy before transplantation, smoking habits, physical activity, skin colour, use of sunscreen and sun exposure habits (Table 1).
Table 1 Demographic and clinical characteristics of study participants, according to vitamin D status (Medians and interquartile intervals for non-normal distribution; absolute values and percentages)

RRT, renal replacement therapy; tx, transplant.
* P value refers to differences between three groups (ANOVA or χ 2 test).
† P<0·05 refers to comparison with the deficient group (ANOVA Bonferroni post-hoc test or χ 2 test).
‡ P<0·05 refers to comparison with the insufficient group (ANOVA Bonferroni post-hoc test or χ 2 test).
The nutritional parameters used to evaluate total and central BF were different among the three groups, with values being significantly higher in participants presenting vitamin D deficiency compared with those presenting insufficiency and sufficiency. The exceptions were WHR, which was not significantly different among the three groups, and WC, which was not different between the deficient and insufficient groups (Table 2). As all nutritional parameters were not significantly different in participants with sufficient and insufficient levels of vitamin D (Table 2), we compared nutritional variables between participants with vitamin D deficiency and the other patients (the vitamin D insufficient and sufficient groups). These analyses revealed that RTR with vitamin D deficiency, compared with those without deficiency, presented significantly higher values of all adiposity parameters, with WHR being the only exception. The magnitude of these differences are shown in Fig. 2 for a classical parameter of adiposity (BMI), an important parameter of adiposity in RTR (weight gain during the 1st year post-tx), a ‘gold standard’ measure of total adiposity (percentage of total BF by DXA) and for a ‘gold standard’ measure of central adiposity (percentage of trunk BF by DXA).
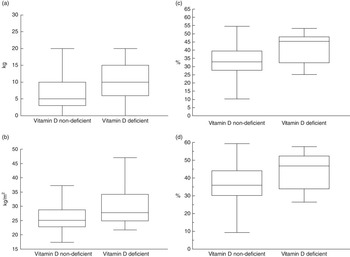
Fig. 2 Nutritional parameters of study participants, according to vitamin D deficiency. (a) Weight gain in the 1st year post-transplant (P=0.0004); (b) BMI (P=0.002); (c) percentage of total body fat (DXA) (P=0.0002); (d) percentage trunk fat (DXA) (P=0.001).
Table 2 Nutritional parameters of study participants, according to vitamin D status (Mean values and standard deviations for normal distribution; medians and interquartile intervals for non-normal distribution)

DXA, dual-energy X-ray absorptiometry; tx, transplant.
* P value refers to differences between three groups (ANOVA).
† P<0·05 refers to comparison with the deficient group (ANOVA Bonferroni post-hoc test).
In order to identify whether percentage of BF by DXA was significantly associated with vitamin D deficiency, after adjustment for confounders, a multivariate logistic regression analysis was performed, using a single model. Vitamin D deficiency (<16 ng/ml) was the dependent variable and the covariates for adjustment were age, sex and eGFR. Percentage of BF, independent of age, sex and eGFR, was associated with vitamin D deficiency (OR 1·09 (95 % CI 1·01, 1·19), P=0·03), whereas all the covariates were not.
The vitamin D-deficient group presented serum albumin levels that were significantly lower than those in the sufficient group (Table 3). PTH levels were significantly higher in the participants presenting vitamin D deficiency, after adjustment for confounding factors (Table 3).
Table 3 Laboratory variables and blood pressure levels according to vitamin D deficiency (Mean values and standard deviations for normal distribution; medians and interquartile intervals for non-normal distribution)

hs-CRP, high-sensitivity C-reactive protein; 25(OH)D, 25-hydroxyvitamin D; PTH, parathyroid hormone; HOMA-IR, homoeostasis model assessment of insulin resistance; BP, blood pressure.
* P value refers to deficient v. non-deficient (t test).
† P value adjusted for age, sex and estimated glomerular filtration rate.
‡ P value adjusted for age, sex, estimated glomerular filtration rate and percentage of body fat.
Comparative analysis of the laboratory variables related to glucose metabolism showed similar levels of glucose, insulin and HOMA-IR in the deficient and non-deficient groups, even after adjustment for confounders and after exclusion of participants using antidiabetic drugs and/or insulin. The lipid profile of participants with and without vitamin D deficiency was also similar even when the participants using hypolipidaemic drugs were excluded (Table 3). Blood pressure was similar in both groups. As in the deficient group only one participant was not using antihypertensive drugs, it was not possible to perform analyses excluding participants using these drugs.
Lower serum levels of vitamin D were associated with higher odds of the metabolic syndrome and dyslipidaemia after adjustment for age, sex and eGFR. However, after additional adjustment for percentage of BF (both total and trunk) these relations were not significant anymore. Hypertension and diabetes were not related to serum 25(OH)D (Table 4).
Table 4 Renal transplant recipients having cardiovascular risk factors according to 25-hydroxyvitamin D (25(OH)D) serum levels (Odds ratios and 95 % confidence intervals)

eGFR, estimated glomerular filtration rate; BF, body fat; DXA, dual-energy X-ray absorptiometry.
Lower serum levels of 25(OH)D were associated with increasing proteinuria and decreasing eGFR even after adjustments for age, sex and percentage of BF (total and in the trunk) (Table 5). There were no interactions of the adiposity variables in the association of 25(OH)D concentration with proteinuria (percentage of total BF, P=0·45; percentage of trunk BF, P=0·61), and with eGFR (percentage of total BF, P=0·08; percentage of trunk BF, P=0·26).
Table 5 Multiple regression analysis of the relation of 25-hydroxyvitamin D with proteinuria and estimated glomerular filtration rate
* Model 1 was adjusted for age and sex.
† Model 2 was adjusted for age, sex and percentage of total body fat by dual-energy X-ray absorptiometry.
‡ Model 3 was adjusted for age, sex and percentage of trunk body fat by dual-energy X-ray absorptiometry.
Discussion
This study represents the first attempt to define the status of vitamin D in RTR living in the city of Rio de Janeiro (Brazil), an area of tropical climate and low latitude (22°54'10"S), with high solar radiation during the four seasons of the year. Despite these favourable conditions, the prevalence of hypovitaminosis D (deficiency and insufficiency) was high (53 %). Some studies conducted in Brazil also found that more than half of the participants presented hypovitaminosis D. These studies included the general population( Reference Cabral, Borges and Maia 32 , Reference Arantes, Kulak and Fernandes 33 ) and chronic kidney disease (CKD) patients in predialysis( Reference Diniz, Romão and Elias 34 , Reference Barreto Silva, Cavalieri and Lemos 35 ). In Brazil, to date, only one study evaluated the prevalence of hypovitaminosis D in RTR( Reference Baxmann, Menon and Pestana 36 ), and was conducted in the city of São Paulo, which has a higher latitude (23°32'51"S) than Rio de Janeiro, and the prevalence of hypovitaminosis D was higher (65 %). As expected, the prevalence of vitamin D deficiency/insufficiency in the present study was lower than that observed in previous studies conducted with RTR in other countries with higher latitudes( Reference Marcén, Jimenez and Fernández-Rodriguez 12 – Reference Obi, Hamano and Ichimaru 14 , Reference Stavroulopoulos, Cassidya and Porter 37 – Reference Keyzer, Riphagen and Joosten 39 ).
Vitamin D deficiency was present in 17 % of women and in 4 % of men included in the present study (P=0·003). The percentage of women in the vitamin D-deficient group was higher than in the other groups. Some studies in the general population( Reference Verdoia, Schaffer and Barbieri 40 , Reference Haq, Svobodová and Imran 41 ) and in RTR( Reference Filipov, Zlatkova and Dimitrov 42 ) also observed a higher prevalence of hypovitaminosis D in women. However, the relationship between vitamin D deficiency and sex has not been established, as some studies showed similarities between sexes( Reference Souberbielle, Massart and Brailly-Tabard 43 , Reference Granlund, Ramnemark and Andersson 44 ), whereas others found lower levels of vitamin D in men( Reference Johnson, Hofs and Aasheim 45 , Reference Ramnemark, Norberg and Pettersson-Kymmer 46 ). In the present study, lower levels of 25(OH)D in women may be attributed to (1) higher percentage of BF (41·3 (sd 6·8) v. 29·3 (sd 7·2) %, P<0·0001); (2) greater use of sunscreen (41 v. 25 %, P<0·0001); and (3) lower frequency of sun exposure (≥3 times/week) (28 v. 60 %, P=0·001).
Several studies, both cross-sectional( Reference Ceglia, Nelson and Ware 47 , Reference Kim and Kim 48 ) and longitudinal( Reference Jamal-Allial, Griffith and Tucker 49 , Reference Lehtinen-Jacks, Leu Agelii and Hunsberger 50 ), in the general population showed an association between excessive BF and vitamin D deficiency. However, total body adiposity was evaluated on the basis of BMI in most of the studies, although it has a well-known limitation in properly evaluating BF. In a study conducted by our group in non-dialysed CKD patients, BMI was not a predictor of vitamin D deficiency, whereas the percentage of total BF evaluated by DXA was( Reference Barreto Silva, Cavalieri and Lemos 35 ). In the present study, BMI and percentage of BF were significantly higher in the deficient group even in multivariate analyses. The possible reasons for this divergence between studies include lower levels of BMI and percentage of BF observed in the present study, and, probably, a younger population and a higher eGFR.
Weight gain during the 1st year post-tx was significantly higher in the vitamin D-deficient group in the present study. Similar findings were observed by Baxmann et al.( Reference Baxmann, Menon and Pestana 36 ) in RTR. Several mechanisms have been proposed to explain the lower levels of 25(OH)D in obese individuals, and the main mechanism appears to be the sequestration of vitamin D by adipose tissue( Reference Wortsman, Matsuoka and Chen 51 ).
In the present study, almost all parameters used to estimate central body adiposity were significantly higher in the vitamin D-deficient group. However, the relationship between vitamin D status and central adiposity is not consistently found by others( Reference Kim and Kim 48 , Reference Han, Kim and Lee 52 , Reference Ferreira, Rocha and Klein 53 ). The possible reason is that the total amount of BF, and not the location of its deposition, is the most important determinant of vitamin D status. Our results are in accordance with this hypothesis as the only parameter that was not higher in the deficient group was WHR, which reflects the body adiposity distribution and not the body adiposity content.
Although participants with vitamin D deficiency presented lower serum levels of albumin, albumin values in both groups were at a higher normal range; thus, it is not likely to have any significance other than numeric.
Regarding the metabolic syndrome, only one study conducted in RTR evaluated its relationship with serum 25(OH)D( Reference Kulshrestha, Ojo and Luan 54 ). It studied only non-diabetic patients soon after kidney transplantation (11 weeks) and observed that those with metabolic syndrome presented lower levels of 25(OH)D (20·5 v. 24·8 ng/ml, P=0·049). In the present study, we found a significant association between lower serum 25(OH)D levels and higher odds of the metabolic syndrome, only before adjustment for BF, indicating that the relationship between vitamin D and the metabolic syndrome is not independent of BF.
In the general population, vitamin D deficiency was associated with dyslipidaemia( Reference Jorde, Figenschau and Hutchinson 55 , Reference Lupton, Faridi and Martin 56 ). In RTR serum levels of TC were not related to vitamin D status in the unique study evaluating this association( Reference Lee, Kong and Cho 57 ). The relation of vitamin D with dyslipidaemia, observed in the present study, was dependent on BF.
Although we did not find an association between vitamin D and hypertension in our RTR, which is in agreement with previous studies conducted in RTR( Reference Marcén, Jimenez and Fernández-Rodriguez 12 , Reference Lee, Kong and Cho 57 ), there is a consistent association of vitamin D deficiency with higher levels of blood pressure and/or prevalence of hypertension in the general population( Reference Kunutsor, Apekey and Steur 2 , Reference Griffin, Gadegbeku and Sowers 58 ). The potential hypotensive effects of vitamin D include suppression of the renin–angiotensin system (RAS), beneficial effects on endothelial and vascular smooth muscle cells and the prevention of secondary hyperparathyroidism( Reference Rostand 59 – Reference Yildirim, Yilmaz and Altindal 61 ). A vitamin D-independent mechanism by which sunlight acting on skin can exert beneficial effects on blood pressure has recently been described. It relies on the UVA-mediated mobilisation of cutaneous nitric oxide to the systemic circulation( Reference Weller 62 – Reference Liu, Fernandez and Hamilton 64 ).
In the general population, observational studies show that vitamin D deficiency is associated with insulin resistance and/or type 2 diabetes( Reference Song, Wang and Pittas 3 , Reference Sorkin, Vasaitis and Streeten 65 ). There is evidence that vitamin D can increase insulin secretion, protect against β-cell dysfunction and improve peripheral insulin resistance( Reference Pilz, Kienreich and Rutters 66 ). However, in the present study, vitamin D was neither associated with insulin resistance nor with diabetes prevalence. To date, in RTR, only one study evaluated the relation between serum 25(OH)D and diabetes prevalence and showed a negative association( Reference Filipov, Zlatkov and Dimitrov 67 ). In addition, only one study evaluated the relationship of vitamin D with HOMA-IR( Reference Lee, Kong and Cho 57 ) and no association was observed.
The lack of association between vitamin D status and CVD risk factors (the metabolic syndrome, dyslipidaemia, hypertension and diabetes) found in the present study may be partly justified by the use of immunosuppressive drugs. For example, corticosteroids and calcineurin inhibitors can favour blood pressure increase; whereas corticosteroids, cyclosporin, sirolimus and everolimus may cause lipid abnormalities; and all these drugs may increase the risk for diabetes( 68 ).
Cross-sectional( Reference Sheikh, Saeed and Jafri 69 ) and longitudinal( Reference Damasiewicz, Magliano and Daly 4 , Reference de Boer, Katz and Chonchol 70 ) studies in the general population showed an association between low serum levels of 25(OH)D and eGFR decline, or with CKD incidence, but others did not( Reference O’Seaghdha, Hwang and Holden 71 , Reference Guessous, McClellan and Kleinbaum 72 ). In RTR patients, longitudinal studies found that low serum concentrations of 25(OH)D were associated with an accentuated decline in eGFR( Reference Obi, Hamano and Ichimaru 14 , Reference Keyzer, Riphagen and Joosten 39 , Reference Sezer, Yavuz and Canoz 73 , Reference Bienaimé, Girard and Anglicheau 74 ). The cross-sectional analysis of the present study showed that lower levels of 25(OH)D were associated with lower eGFR independently of age, sex, and percentage of total and trunk BF. This potential beneficial effect of vitamin D on renal function may be mediated by a decrease in albuminuria and inflammation( Reference Isakova, Gutiérrez and Patel 75 ).
We found an inverse association between serum 25(OH)D and proteinuria. Proteinuria occurs commonly after kidney transplantation, being associated with reduced graft survival as well as an increased risk for cardiovascular events and death( Reference Tsampalieros and Knoll 76 ). In the general population, in a series of observational studies (longitudinal and transversal), low serum levels of 25(OH)D were associated with a higher prevalence and incidence of proteinuria( Reference Skaaby, Husemoen and Pisinger 77 , Reference Park, Ryu and Han 78 ). Few studies in RTR evaluated this issue; some found an inverse association( Reference Lee, Kong and Cho 57 , Reference Sezer, Yavuz and Canoz 73 ), whereas others found no association( Reference Filipov, Zlatkov and Dimitrov 67 , Reference Eyal, Aharon and Safadi 79 ). Therefore, to date, there is no consensus on the relationship between vitamin D and proteinuria in RTR.
It is not clear if proteinuria leads to reduced serum levels of 25(OH)D or contrariwise. Low serum 25(OH)D levels are commonly observed in patients with nephrotic syndrome( Reference Malluche, Goldstein and Massry 80 ). In contrast, there is evidence that a low serum level of 25(OH)D can promote proteinuria. Studies suggest that vitamin D may suppress the RAS axis, contributing to the reduction of proteinuria by haemodynamic mechanisms( Reference Freundlich, Quiroz and Zhang 81 ).
The strengths of this study include the adequate evaluation of body adiposity and the adequate adjustments of statistical analyses. There are several limitations to the present study, and the main one is its cross-sectional nature, which means that causality is not likely to be determined. The cut-off point for serum 25(OH)D levels for defining vitamin D deficiency has not been consensually established; however, we used the cut-off point that is mostly used in studies with RTR.
Conclusion
This study suggests that hypovitaminosis D is very common in RTR, even in individuals living in a city of low latitude, being associated with excessive BF, decreased eGFR and increased proteinuria. However, vitamin D deficiency is not associated with the classical risk factors for CVD, which are hypertension, diabetes, dyslipidaemia and the metabolic syndrome. As the cross-sectional design of this study precludes the assessment of possible causal effects, longitudinal and interventional studies with vitamin D supplementation are recommended to clarify the observed associations.
Acknowledgements
The authors express their sincere gratitude to Maria de Lourdes Guimarães Rodrigues, Débora Cristina Torres Valença, Bernardo Barreto da Silva Gaspar, José Firmino Nogueira Neto, Cláudio Teixeira Maia and Cristiane Souza Mendes.
The present study was supported by the Fundação Carlos Chagas Filho de Amparo à Pesquisa do Estado do Rio de Janeiro (FAPERJ).
K. T. C. R., R. B., M. I. B. S. and M. R. S. T. K. contributed to the study conception and design; K. T. C. R., A. P. M. M. B., K. S. S. P. and M. R. S. T. K. contributed to data collection, assembly, analysis and interpretation; C. J. M. M., R. B. and M. I. B. S. contributed to data analysis and interpretation; E. S. contributed to data collection; K. T. C. R., A. P. M. M. B., K. S. S. P., C. J. M. M., E. S., R. B., M. I. B. S. and M. R. S. T. K. contributed to manuscript drafting and the approval of the final version of the manuscript.
None of the authors has any conflicts of interest to declare.


