


Introduction
Canola (Brassica napus Linnaeus var. oleifera), a member of the Brassicaceae (cruciferous) family, is one of the main cultivated oilseeds in the world (Halinski et al. Reference Halinski, Dos Santos, Kaehler and Blochtein2018). The oil from its seed (about 38%) is used in human food and in the production of biodiesel, and the bran can be used to formulate animal feed due to the protein present in the seed (between 24 and 27%; Tomm Reference Tomm2007). In southern Brazil, canola cultivation has gained attention as a source of income for farmers during the winter and is included in crop rotation systems, mainly with maize and soybeans (Tomm Reference Tomm2013).
The effects of pollinating insects on canola yield has been evaluated in several studies (Blochtein et al. Reference Blochtein, Nunes-Silva, Halinski, Lopes and Witter2014; Fuzaro et al. Reference Fuzaro, Xavier, Carvalho, Nery, Carvalho and Andaló2018; Halinski et al. Reference Halinski, Dos Santos, Kaehler and Blochtein2018). In general, pollinators increase the final grain yield (Sabbahi et al. Reference Sabbahi, DeOliveira and Marceau2005). For that reason, the effect is beneficial to the point where practices to preserve these pollinators are strongly recommended to ensure continuity of their services to the canola crop (Marsaro Júnior and Pereira Reference Marsaro Júnior and Pereira2017). However, the effects are variable depending on the pollinator species, cultivation practices, agricultural landscape, climate, and the pollinator dependencies of the canola genotype (Blochtein et al. Reference Blochtein, Nunes-Silva, Halinski, Lopes and Witter2014; Ouvrard and Jacquemart Reference Ouvrard and Jacquemart2019).
Among the main pollinators of the canola crop are Apis mellifera (Linnaeus) (Apidae: Apini) and Trigona spinipes (Fabricius) (Apidae: Meliponini). Both species are generalists, with many host plants (Giannini et al. Reference Giannini, Boff, Cordeiro, Cartolano, Veiga, Imperatriz-Fonseca and Saraiva2015a). Apis mellifera is an exotic species introduced in the past and adapted to southern Brazil. Whereas A. mellifera is used in this region in the production of honey, mainly by rural producers who also cultivate canola, the native stingless bee T. spinipes occurs naturally in cultivated environments and forests in this region (Giannini et al. Reference Giannini, Garibaldi, Acosta, Silva, Maia and Saraiva2015b). In this scenario, the coexistence of both in cultivated environments is commonplace.
Both A. mellifera and T. spinipes are influenced by abiotic factors (e.g., temperature, rainfall, relative humidity, and solar radiation). As with other insects, temperature, relative humidity, and rainfall are important modulators of bee biology, affecting reproduction rates, development time, and longevity and impacting the final abundance of colonies. These variables can also influence the bees’ ecological behaviour, such as flight activity and foraging, changing their patterns of abundance at the local scale and consequently impacting crop pollination (Woyke et al. Reference Woyke, Wilde and Wilde2003; Clarke and Robert Reference Clarke and Robert2018; Soares et al. Reference Soares, Lima, Evangelista-Rodrigues, Silva, Silva, Lima and Da Costa2019).
Factors related to the canola genotype, such as the amount of nectar, total sugar concentration, and amino acid composition, can influence the preferences of these pollinator species (Kevan et al. Reference Kevan, Lee and Shuel1991; Bertazzini and Forlani Reference Bertazzini and Forlani2016). In addition, canola genotype may also influence bee abundance and final yield. Open-pollinated genotypes (varieties) are generally more pollinator-dependent than closed-pollinated genotypes (hybrids; Marini et al. Reference Marini, Tamburini, Petrucco-Toffolo, Lindström, Zanetti, Mosca and Bommarco2015). In southern Brazil, Hyola 61 and Hyola 575 hybrids and the Diamond variety are commonly sown. These genotypes vary in cycle and flowering time. Although Hyola 575 (Advanta Seeds 2021) and Diamond (Nuseed Brazil 2022) have early cycles, Hyola 61 (Advanta Seeds 2021) has a medium cycle. The flowering time for Hyola 575 and Diamond is 35–69 days and 35–45 days, respectively, whereas for Hyola 61, flowering time is 28–52 days. The flowering time of the genotypes varies according to the sowing season and climate (Lilley et al. 2019). Thus, genotypic traits can influence pollinator abundance in both direct and indirect ways.
Ecological relationships among pollinators that compete for the same resource can modulate the pollination services of different species and affect canola yield (Adegas and Couto Reference Adegas and Couto1992; Giannini et al. Reference Giannini, Boff, Cordeiro, Cartolano, Veiga, Imperatriz-Fonseca and Saraiva2015a). Competition is one of the main relationships between individuals on the same trophic level. Competition between pollinators can impact the frequency of occurrence and abundance of one or both species (Adegas and Couto Reference Adegas and Couto1992; Brizola-Bonacina et al. Reference Brizola-Bonacina, Arruda, Alves-Junior, Chaud-Netto and Polatto2012). Considering the foraging behaviour of T. spinipes, which damages the flower to obtain pollen, and its aggressiveness in the presence of other floral visitors (Brizola-Bonacina et al. Reference Brizola-Bonacina, Arruda, Alves-Junior, Chaud-Netto and Polatto2012), this bee may reduce A. mellifera visitation, which may in turn reduce canola yield.
Crop systems that have different sowing dates and exploit different canola genotypes can significantly influence the population abundance and seasonality of honeybees. This may be due to the indirect effects of the sowing date in conjunction with abiotic variables, such as air temperature, relative humidity, and precipitation, which may favour some species over others (de Mattos et al. Reference de Mattos, Souza and Soares2018; Soares et al. Reference Soares, Lima, Evangelista-Rodrigues, Silva, Silva, Lima and Da Costa2019).
The present study investigated the interactive effects of abiotic and biotic factors on population abundance of the bee species A. mellifera and T. spinipes within the context of canola cultivation. The underlying hypothesis suggests that variations in temperature, relative humidity, plant genotype, and sowing season can directly influence the abundance of these species, which in turn can impact crop yield. To determine if this is the case, a series of questions were addressed: (1) How does temperature and relative humidity affect the abundance of the studied bees? (2) Are different canola genotypes associated with variations in bee abundance?, and (3) Does sowing season exert influence on the abundance of A. mellifera and T. spinipes? The study also investigated how the coabundance of these bee species is related to canola yield. Results from the study will contribute to a deeper understanding of the interactions between pollinators and canola, which will have significant implications for sustainable agroecosystem management.
Material and methods
Study system
The study was carried out in the municipality of São Vicente do Sul, in the state of Rio Grande do Sul, Brazil (latitude: 29° 42’ 21”; longitude: 54° 41’ 39”). The region’s climate is considered mild, with an average temperature of the coldest month below 18 °C (mesothermal, approximately 10 °C) and average temperature of the hottest month above 22 °C (approximately 25 °C), with hot summers, infrequent frosts, and a tendency towards more rain in the summer but without a defined dry season (Valério et al. Reference Valério, Tres, Tetto, Soares and Wendling2018). The soil in the experimental area is classified as arenic dystrophic red argisol. The region in which the study was conducted is characterised by a large proportion of cultivated area with soybeans, maize, and rice in the summer and cereals in the winter (e.g., wheat, oats, and ryegrass). In this scenario, canola is a crop used mainly for rotating areas that are cultivated with cereals in winter. When present, canola becomes an ideal source of resources for pollinators.
Cropping system
The genotypes used in this experiment (Hyola 575, Hyola 61, and Diamond) refer to the main genotypes grown in southern Brazil. The Diamond variety is a genotype with an open-pollination strategy, whereas Hyola 61 and Hyola 575 use a hybrid strategy. Seeds were sown manually in four six-row plots/genotype, with a spacing of 0.45 m between rows. Each plot was 9 m long × 2.7 m wide, for a total area of 24.3 m2 per plot, a usable area of 97.2 m2/genotype, and 291.6 m² for total area. After sprouting, the canola plants were manually thinned to an overall density of 40 plants per square metre. The cultivation system adopted was the no-tillage system. Soil fertilisation was carried out according to soil analysis before sowing. For this, the technical recommendations for the crop were used while considering an expected yield of 1500 kg/ha (Tomm Reference Tomm2007). For weed control, herbicide (glyphosate) was sprayed before planting, and manual weeding was carried out after the crop emerged. No fungicide and insecticide sprays were applied so as to avoid negative impact on the pollinators. The plots were harvested and manually processed to obtain grain yield for each season and genotype. A total of 2 m² per plot (approximately 80 plants) was harvested. The sowing seasons for each year of the study are shown in Table 1. The number of plots was stable over the evaluated sowing seasons (four plots/genotype/sowing season), and each genotype was harvested according to its development cycle and sowing season. The experimental design applied included randomised blocks in a factorial scheme, with five sowing dates × three genotypes. For each genotype, 60 sampling points were obtained (four plots × five sowing times × three years), totalling 180 sampling points at the end of the experiment for the three evaluated genotypes.
Table 1. Dates of sowing (S) and harvest (H) for five plantings of canola used to study pollinator abundance at São Vicente do Sul, Rio Grande do Sul, Brazil, from 2017 to 2019.

Pollinator observation
Monitoring of wild bee abundance started at the flowering stage. Pollinators were sampled weekly in the middle two rows of each plot until the end of flowering stage. The sample size ranged from 7 to 10 weekly samplings, depending on year, sowing season, and canola genotype (Table 1). To survey insects, a sweep net was passed through the upper canopy of the plants. Four net passes were performed per sample, totalling 4 m² per plot. The captured insects were placed in glass bottles containing 70% ethyl alcohol. The collected material was sent to the Entomology Laboratory of the Farroupilha Federal Institute for identification and quantification.
Meteorological data
Temperature and relative humidity data were obtained using a thermo-hygrometer at the time of sampling. Data were obtained at the time of sampling because foraging conditions are volatile throughout the day. Because the bees being studied have diurnal pollination behaviour, temperature reductions at night could influence the average daily temperature and relative humidity and thereby affect the results obtained.
Data analysis
Effects of genotype, sowing season, and meteorological variables on bee abundance
Bee abundance data were analysed using generalised additive models, with errors following the negative binomial distribution. In this model, the dependent variables were the abundances of A. mellifera and T. spinipes. The plant genotype and sowing seasons were considered as fixed effects. The abundance of the other bee species and meteorological variables – instantaneous air temperature (°C) and instantaneous relative humidity (%) – were considered covariates. These variables showed a nonsignificant Spearman’s correlation (rho = 0.06; P-value = 0.57); therefore, no problem with collinearity occurred. The temporal variables years, months, and days of the evaluations were considered random variables. The models were submitted to deviance analysis, using the chi-square test ( $\chi^2$
). All analyses were performed at the significance level of P < 0.05. The model had the following structure:
$\chi^2$
). All analyses were performed at the significance level of P < 0.05. The model had the following structure:
 $$\gamma = \alpha + {\beta _i}*{\beta _j} + f({\beta _k}) + f({\beta _l},{\beta _m}) + {\beta _{n/o}} + {\beta _{o/p}} + {\beta _p} + \varepsilon $$
where $\gamma $
is the estimated population of A. mellifera or T. spinipes;
$\gamma $
is the estimated population of A. mellifera or T. spinipes; $\alpha $
is the intercept;
$\alpha $
is the intercept; ${\beta _i}$
is the plant genotype;
${\beta _i}$
is the plant genotype; ${\beta _j}$
is the sowing seasons;
${\beta _j}$
is the sowing seasons; $f({\beta _k})$
is the function of the smoothed effect of the abundance of other bee species;
$f({\beta _k})$
is the function of the smoothed effect of the abundance of other bee species; $f({\beta _l},{\beta _m})$
is the function of the smoothed effect of interaction of instantaneous air temperature and instantaneous air relative humidity;
$f({\beta _l},{\beta _m})$
is the function of the smoothed effect of interaction of instantaneous air temperature and instantaneous air relative humidity; ${\beta _{nop}}$
is the random effects of variables days, months, and years, respectively; and ϵ is the residual error.
${\beta _{nop}}$
is the random effects of variables days, months, and years, respectively; and ϵ is the residual error.
Effects of genotype, sowing seasons, and bee coabundance on canola yield
The effects of the genotype, sowing seasons, and coabundance of T. spinipes and A. mellifera on canola yield were investigated using a generalised additive model with Gaussian error distribution. To meet the assumptions of normality of residues and homogeneity of variances, data on yield were transformed to log(x). The year parameter was considered a random variable. The model had the following structure:
 $$\gamma = \alpha + {\beta _i}*{\beta _j} + f({\beta _k},{\beta _l}) + {\beta _m} + \varepsilon $$
where $\gamma \;$
is the estimated mean yield of canola (kg/ha); α is the intercept;
$\gamma \;$
is the estimated mean yield of canola (kg/ha); α is the intercept; ${\beta _i}$
is the genotype parameter;
${\beta _i}$
is the genotype parameter; ${\beta _j}$
is the sowing season parameter; and
${\beta _j}$
is the sowing season parameter; and $f\left( {{\beta _k},{\beta _l}} \right)\;$
is the function of the smoothed effect of the interaction between the mean abundances of A. mellifera and T. spinipes;
$f\left( {{\beta _k},{\beta _l}} \right)\;$
is the function of the smoothed effect of the interaction between the mean abundances of A. mellifera and T. spinipes; ${\beta _m}$
refers to the random effects of the year; and is the residual error.
${\beta _m}$
refers to the random effects of the year; and is the residual error.
Functions, packages, and software
The generalised additive models were fitted using the “gam” function, and their adjustments were evaluated through the “gam.check” function; the three-dimensional maps were fitted through the “vis.gam” function, with all functions provided by the mgcv package (Wood Reference Wood2017). All analyses were fitted using R, version 4.0.2 (R Core Team 2022).
Results
Effects of genotype and sowing season on pollinator visitation
In the entire experiment, 3945 bees were captured during the flowering stage. Of these, 1643 (41.64%) were A. mellifera, and 2302 (58.35%) were T. spinipes. The general additive mixed models showed a nonsignificant effect of genotype and sowing season on A. mellifera (Fig. 1A) and a marginal nonsignificative effect of only genotype on T. spinipes (Table 2). Despite the marginally nonsignificant effect of genotype, T. spinipes showed a preference trend for Hyola 61 in the first, fourth, and fifth sowing seasons (Fig. 1B).

Figure 1. Abundance of pollinators among canola genotypes and sowing seasons: A, Apis mellifera and B, Trigona spinipes. The vertical lines indicate the 95% confidence interval.
Table 2. General additive mixed model analysis for Apis mellifera and Trigona spinipes abundance in canola plantings in Brazil, 2017–2019.
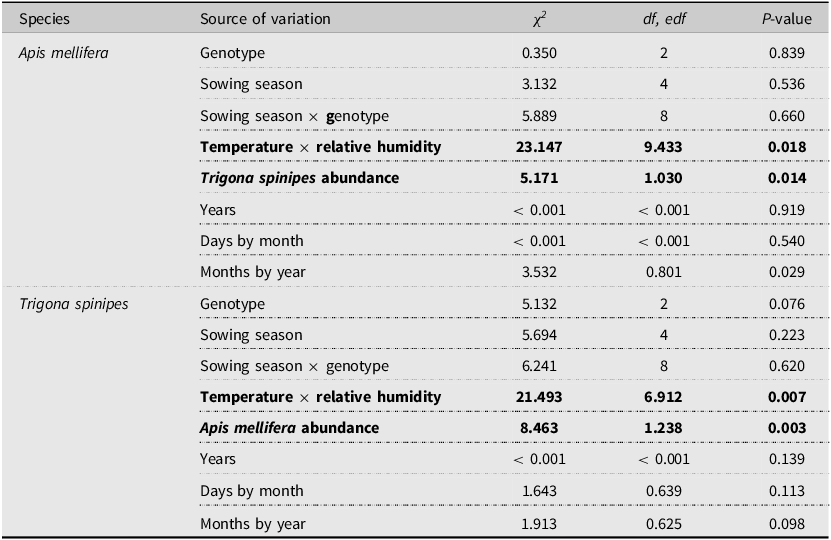
Categorical variables = genotype and sowing season. Smoothing terms = bee abundance, temperature, and relative humidity. Random variables = years, days, and months. Adjusted R² and deviance explained were 0.44 and 60.2% for Apis mellifera and 0.16 and 54.6% for Trigona spinipes, respectively; df and edf are the degrees of freedom and effective degrees of freedom for the categorical and smoothing terms, respectively. Terms in bold are statistically significant.
Effects of the meteorological factors on pollinator visitation
The general additive mixed models showed significant effects of the interaction between instantaneous air temperature and relative humidity on the population abundances of A. mellifera and T. spinipes (Table 2). The abundance of A. mellifera decreased as a function of the increase in temperature up to 15 °C, whereas it increased as a function of the increase in relative humidity. Maximum values were estimated at temperatures lower than 15 °C and relative humidity higher than 70%, and minimum values were estimated at temperatures around 25 °C and at relative humidity higher than 60% (Fig. 2A). For T. spinipes, maximum values were estimated at temperatures higher than 15 °C and relative humidity higher than 70% (Fig. 2B).
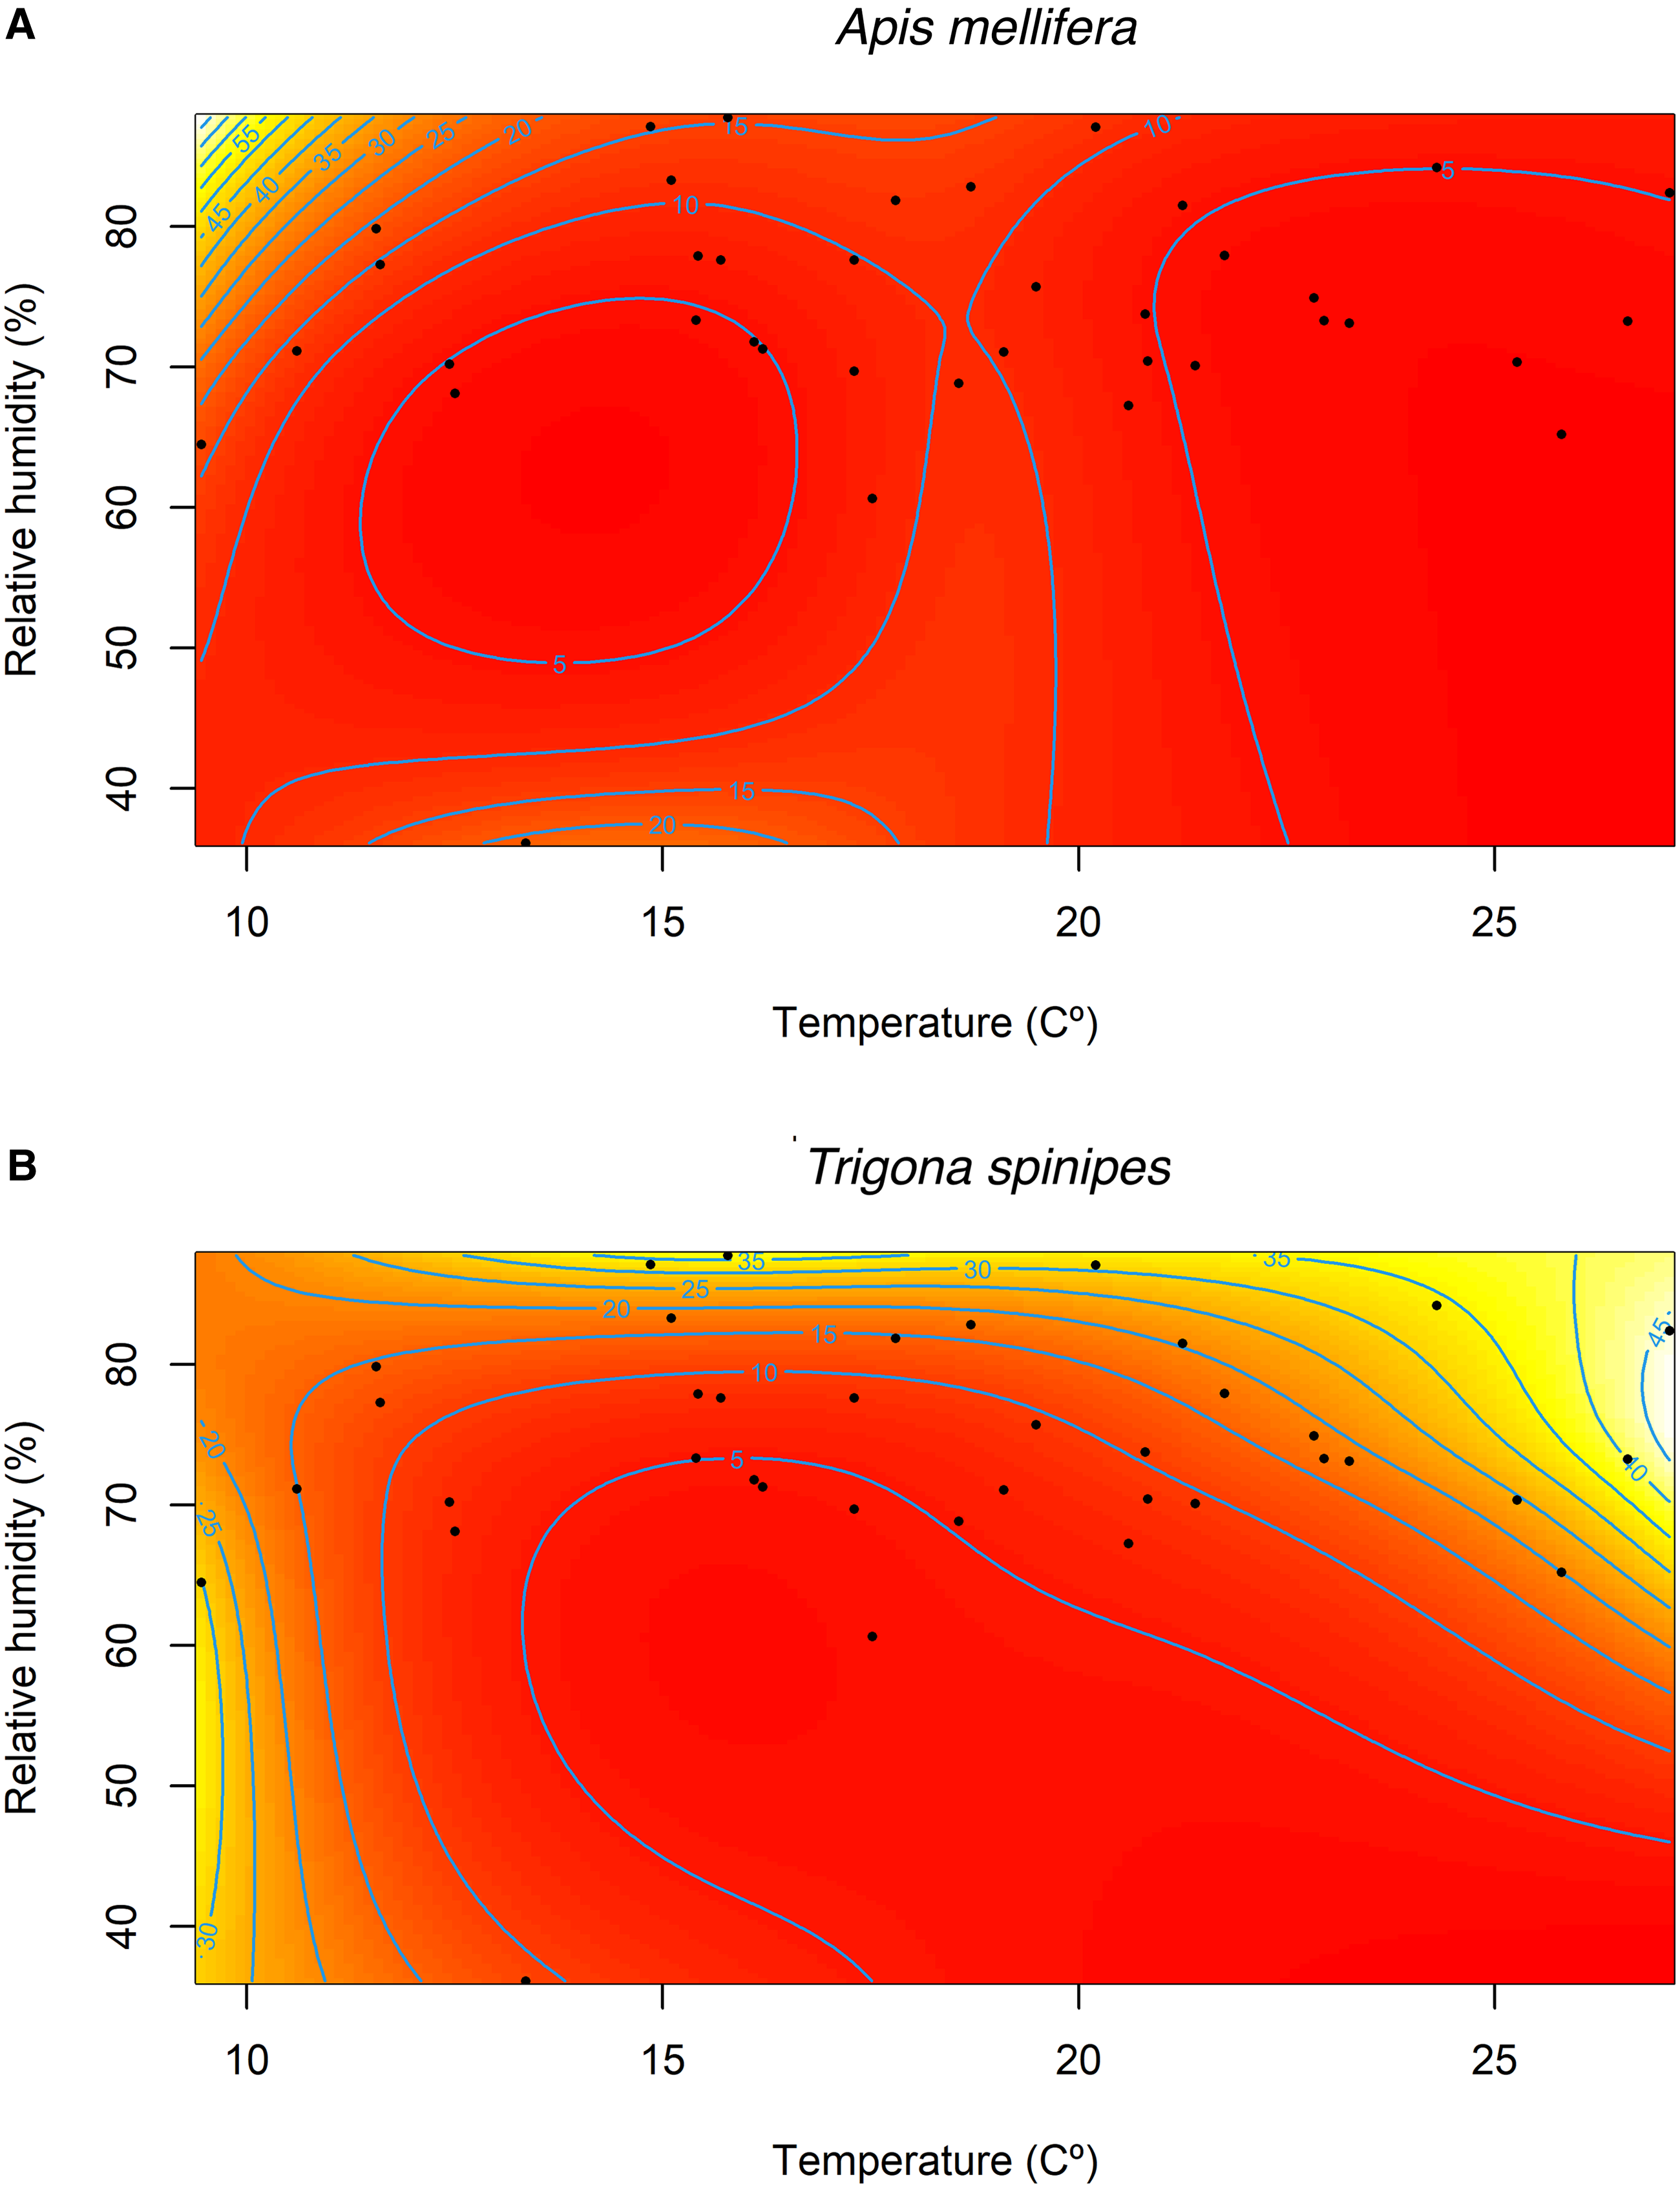
Figure 2. Instantaneous air temperature (°C) and instantaneous relative humidity (%) of general additive mixed models in the estimate abundance of A, Apis mellifera and B, Trigona spinipes.
Coabundance patterns
We identified a significant interaction effect between species (Table 2). Under the conditions in which the study was conducted, this effect was positive for both species, indicating a greater population of one when the other was present (Fig. 3). However, because the evaluations were carried out during the flowering period, which is the main and abundant source of floral resources in the agricultural landscape, this pattern may be related to the abundance of resources.

Figure 3. Smoothed effects of A, Apis mellifera and B, Trigona spinipes coabundance patterns. Shaded areas indicate the 95% confidence interval.
Effects of genotypes, sowing seasons, and bee coabundance on canola yield
Marginal effects were observed for interaction between genotype and sowing season on canola yield (Table 3). There were trends of higher yield for Hyola 61 in the first sowing season, whereas in the other sowing seasons, a higher average yield was observed for the Diamond variety. The Diamond variety showed increasing yield from the first to the second sowing seasons and decreased thereafter. Hyola 575 and Hyola 61 had higher yield trends in the first sowing season (Fig. 4).
Table 3. General additive model of variables affecting canola yield from five plantings sown in each year from 2017 to 2019 in Brazil.

Categorical variables = genotype and sowing season. Smoothing terms = Apis mellifera × Trigona spinipes. Random variable = years. Adjusted R² and deviance explained were 0.83 and 92.3%, respectively; df and edf are the degrees of freedom and effective degrees of freedom for the categorical and smoothing terms, respectively. Terms in bold are statistically significant.

Figure 4. Canola yield (kg/ha) among canola genotypes and sowing season. The vertical lines indicate the 95% confidence interval.
Apis mellifera and T. spinipes had significant effects on canola yield. For A. mellifera, linear and positive effects on the yield were observed (Fig. 5). For T. spinipes, increases in population density negatively affected yield when its populations exceeded a threshold of approximately 20 insects per square metre (Fig. 5). The highest mean yield (1600 kg/ha) was observed when both A. mellifera and T. spinipes reached a mean population around 50 bees per square metre (Fig. 5).

Figure 5. Canola log-yield as a function of Apis mellifera and Trigona spinipes abundance.
Discussion
The results obtained in this study show how anthropogenic and abiotic factors affect pollinator abundance for A. mellifera and T. spinipes. In addition, the results suggest that coabundance of these species positively affects canola yield.
Effects of genotype and sowing season
Both A. mellifera and T. spinipes showed nonsignificant effects of sowing season and genotypes. However, for T. spinipes, trends of genotype effects were observed with greater abundance on Hyola 61 in the first, fourth, and fifth sowing seasons. Different genotypes may show a distinctive response pattern in nectar production, total sugar concentration, and amino acid composition (Kevan et al. Reference Kevan, Lee and Shuel1991; Bertazzini and Forlani Reference Bertazzini and Forlani2016; Thom et al. Reference Thom, Eberle, Forcella, Gesch, Weyers and Lundgren2016). Phenotypic characteristics related to flower phenology, such as amount of pollen, can vary with genotype, which can directly influence the flower’s attractiveness to pollinators (Marini et al. Reference Marini, Tamburini, Petrucco-Toffolo, Lindström, Zanetti, Mosca and Bommarco2015; Bertazzini and Forlani Reference Bertazzini and Forlani2016). Based on this, and depending on the genotype, the phenotypic conditions may be attractive to T. spinipes. The lack of preference between genotypes observed in A. mellifera has been observed for other plant species, such as alfalfa (Kauffeld et al. Reference Kauffeld, Sorensen and Painter1969). Picard-Nizou et al. (Reference Picard-Nizou, Pham-Delègue, Kerguelen, Douault, Marilleau and Olsen1995) reported that even genotypes with higher nectar secretions and sugar concentrations may have questionable biological significance for A. mellifera, as no changes were observed in the behaviour of this foraging bee species across plant species.
Effects of meteorological factors
Apis mellifera
Apis mellifera tends to begin foraging when the environmental temperature reaches approximately 6 °C (Tan et al. Reference Tan, Yang, Wang, Radloff and Oldroyd2012). In our study, the number of foraging A. mellifera reached a peak at the instantaneous temperature of 10 °C and when relative humidity was higher than 80%. These results accord with the patterns observed by Degrandi-Hoffman and Chambers (Reference Degrandi-Hoffman and Chambers2006) in sunflower crops. In terms of foraging activity, A. mellifera showed peak activity on apple in India at 16 °C (Joshi and Joshi Reference Joshi and Joshi2010) and in semiurban areas in China at 20 °C (Tan et al. Reference Tan, Yang, Wang, Radloff and Oldroyd2012) and on oilseed canola in Lithuania between 14 and 26 °C (Blazyte-Cereskiene et al. Reference Blazyte-Cereskiene, Vaitkevičiene, Venskutonyte and Buda2010).
In relation to instantaneous relative humidity, our results show that relative humidity that was higher than 60% positive affected A. mellifera abundance. These results differ from those obtained by Akhtar et al. (Reference Akhtar, Aziz, Naeem, Ahmed and Bodlah2018) in Pakistan, who observed a negative correlation with relative humidity. On the other hand, de Mattos et al. (Reference de Mattos, Souza and Soares2018) found positive correlations between relative humidity and the number of foraging A. mellifera in a tropical region in Brazil, mainly in autumn and winter.
The effects of temperature and relative humidity on A. mellifera foraging activity are variable, with no global pattern, with significant variations from region to region, and with the host plant species evaluated (Abou-Shaara et al. Reference Abou-Shaara, Owayss, Ibrahim and Basuny2017). Forager bees may respond to variations in temperature and relative humidity during flight (Roberts and Harrison Reference Roberts and Harrison1999; Woods et al. Reference Woods, Heinrich and Stevenson2005). This may be related to the adaptive abilities of these insects to their local environment. In the case of foraging bees, local adaptation indicators may be related to individual thermoregulation, body size, and longevity (Stabentheiner et al. Reference Stabentheiner, Kovac and Brodschneider2010; Hatjina et al. Reference Hatjina, Costa, Büchler, Uzunov, Drazic and Filipi2014).
Trigona spinipes
Under the present study’s conditions, greater abundance of T. spinipes occurred when the temperature was above 15 °C and the relative humidity remained between 70 and 80%. Bee abundance at low temperatures (around 10 °C) occurred only when the relative humidity was below 50%. In general, our results agree with Soares et al. (Reference Soares, Lima, Evangelista-Rodrigues, Silva, Silva, Lima and Da Costa2019), who observed positive effects for temperature, and Vitali-Veiga and Machado (Reference Vitali-Veiga and Machado2000), who observed greater abundance of T. spinipes at high levels of relative humidity. Therefore, we emphasise the importance of joint analysis of these variables to understand their effects on the population dynamics of T. spinipes. Although we observed high populations in moments of high relative humidity, prolonged periods of high relative humidity can have indirect negative effects, such as fostering the occurrence and development of entomopathogenic fungi, which causes mortality in colonies (Polatto et al. Reference Polatto, Chaud-Netto and Alves-Junior2014).
Coabundance patterns
Patterns of co-occurrence and association between competing species are a central theme in ecology and are generally based upon presence–absence matrices (Gotelli and Ulrich Reference Gotelli and Ulrich2010; Veech Reference Veech2013), disregarding population abundance. The coabundance approach is important for understanding the competitive capacity between species at the local scale (Lopes et al. Reference Lopes, Souza-Filho, Gotelli, Lemos, Godoy and Zucchi2015; Brodie et al. Reference Brodie, Helmy, Mohd-Azlan, Granados, Bernard, Giordano and Zipkin2018). Niche-partition models involving A. mellifera and T. spinipes reveal considerable niche overlap among these species, explaining the need to understand their coabundance patterns and the subsequent implications for ecological issues, especially considering that A. mellifera is a nonnative species and T. spinipes is native to the study region (Giannini et al. Reference Giannini, Garibaldi, Acosta, Silva, Maia and Saraiva2015b). Furthermore, the aggressive behaviour of T. spinipes towards A. mellifera must be taken into account because T. spinipes may expel A. mellifera foragers when both are fighting for the same floral resource (Brizola-Bonacina et al. Reference Brizola-Bonacina, Arruda, Alves-Junior, Chaud-Netto and Polatto2012; Polatto et al. Reference Polatto, Chaud-Netto and Alves-Junior2014). However, no interference by either species with the other was observed in this study. This phenomenon can be related to the abundance of resources or to the species’ temporal partition if we consider the variations in the meteorological effects on these species. Studies that can control for the availability of floral resources and effects of the absence or presence of the other species can, in theory, better elucidate the competitive potential between these species.
Effects of bee abundance on canola yield
Variable effects on the yield were found between A. mellifera and T. spinipes. Apis mellifera was linear and positively related to the canola yield, whereas T. spinipes showed a nonlinear pattern, with positive effects up to a density of 20 insects per square metre and with negative effects observed at higher densities.
The presence of pollinators in canola crops tends to raise productivity levels (Fuzaro et al. Reference Fuzaro, Xavier, Carvalho, Nery, Carvalho and Andaló2018; Halinski et al. Reference Halinski, Dos Santos, Kaehler and Blochtein2018). Studies in Canada showed that A. mellifera is one of the main pollinators of canola, increasing the number of seeds by 30% (Sabbahi et al. Reference Sabbahi, DeOliveira and Marceau2005). However, the magnitude of the effect of insect pollination on canola yield depends on factors related to plant genotype. Genotypes with good grain weight compensation under lower fruiting tend to be less dependent on insect pollination to reach expected yield levels (Hudewenz et al. Reference Hudewenz, Pufal, Bögeholz and Klein2014).
In contrast, the effects of T. spinipes on canola yield remain doubtful, with previous studies suggesting their foraging behaviour causes yield reductions (Adegas and Couto Reference Adegas and Couto1992). Adegas and Couto (Reference Adegas and Couto1992) observed T. spinipes to perforate the floral structure when foraging for nectar and pollen, reducing the formation of fruiting bodies and subsequent yield. However, other studies report no yield reduction and suggest that T. spinipes is as important a pollinator as A. mellifera (Chambó et al. Reference Chambó, de Oliveira, Garcia, Ruvolo-Takasusuki and Arnaut de Toledo2017). Nonetheless, under the conditions in which the present study was conducted, T. spinipes was negatively related to canola yield when population densities were high. This result may be due to the relative abundance of T. spinipes, which was higher (58%) than that observed by Chambó et al. (Reference Chambó, de Oliveira, Garcia, Ruvolo-Takasusuki and Arnaut de Toledo2017; 1%), and to the behaviour reported by Adegas and Couto (Reference Adegas and Couto1992).
Conclusions
Despite trends, the effects of plant genotype and sowing time on bee abundance and canola yield were not statistically significant. We found that there were significant joint effects of instantaneous air temperature and relative humidity on the abundance of A. mellifera and T. spinipes. There was no evidence of competitive exclusion between T. spinipes and A. mellifera. In general, there was a positive joint effect of A. mellifera and T. spinipes abundance on average canola yield.
Acknowledgements
The authors thank FAPESP (2021/02722-0), as part of the Advanced Research Centre in Biological Control of São Paulo (SPARCBIO) (18/02317-5), for the scholarship granted to E. Engel.
Competing interests
The authors declare that they have no conflicts of interest.


