CVD is a major cause of morbidity and mortality worldwide( 1 ). There is now a plethora of evidence from epidemiological and clinical studies suggesting that modifications of dietary fat composition alter the risk of CVD, while total cholesterol (TC) and LDL cholesterol (LDL-C) concentrations are the most significant modifiable risk factors contributing to CVD mortality. A meta-analysis of forty-one published studies in hypercholesterolaemic patients and people with normal lipid levels concluded that an intake of plant sterols or stanols of 2–2·5 g/d reduces LDL-C concentration by ∼10 %( Reference Katan, Grundy and Jones 2 ). Furthermore, PUFA – especially long-chain n-3 PUFA which are found mainly in fish and seafood – have been shown to exhibit several beneficial effects with regard to CVD risk (i.e. reduction of serum TAG, lipoproteins, homocysteine, C-reactive protein (CRP), cytokines and blood pressure levels)( Reference Connor 3 – Reference Miles, Thies and Wallace 7 ). Antioxidants such as vitamins E and C and Se have been shown to play a protective role against PUFA oxidation( Reference Esterbauer, Waeg and Puhl 8 , Reference Niki 9 ). Supplementation with vitamin E has been shown to double the lag time to LDL oxidation( Reference Reaven, Khouw and Beltz 10 ), while vitamin C is believed to regenerate vitamin E from its oxidized state back to its activated state( Reference Steinberg 11 ). Furthermore, Se is an important component of the antioxidant enzyme glutathione peroxidase that protects cells from the adverse effects of free radicals and lipid peroxides( Reference Steinberg 11 ). Other important nutrients that have been associated with a reduction of CVD risk are folic acid and vitamins B6 and B12 ( Reference Carrero, Baro and Fonolla 6 , Reference McKinley, McNulty and McPartlin 12 , Reference Rimm, Willett and Hu 13 ). These nutrients when provided in combination with n-3 PUFA, usually as components of fortified food products, have consistently shown a reduction in plasma homocysteine levels, an independent CVD risk factor( Reference Carrero, Baro and Fonolla 6 , Reference Refsum, Ueland and Nygard 14 , Reference Siri, Verhoef and Kok 15 ), via its metabolic conversion to cystathionine or methionine( Reference Rees and Rodgers 16 ). Finally, it is well documented that regular dietary and/or supplementary intake of Ca and Mg has a significant blood-pressure-lowering effect( Reference Kawano, Matsuoka and Takishita 17 – Reference McGrane, Essery and Obbagy 19 ).
Until now, no study has examined the combined effect of all these nutrients that seem to reduce CVD risk when combined in a single food product. Furthermore, in most intervention studies providing fortified products, study participants received no further motivation to increase their compliance to the intervention scheme. The aim of the current study was to examine the effectiveness of a holistic approach combining the consumption of milk enriched with phytosterols, α-linolenic and linoleic fatty acids, vitamins and antioxidants, as well as regular lifestyle and nutrition counselling sessions, in reducing CVD risk factors compared with a group that received plain milk and lifestyle and nutrition counselling and a control group.
Experimental methods
Sampling
Participants were recruited via advertisement; a total of 340 men and women volunteered to participate. Inclusion criteria were age 40–60 years, BMI < 35·0 kg/m2, TC >200 but <310 mg/dl and no use of lipid-lowering medications, as well as absence of metabolic disorders other than hypercholesterolaemia (i.e. diabetes, thyroid, renal and hepatic disease). One hundred and fifteen volunteers were considered eligible and were invited to participate in the study. The experimental protocol was approved by the Ethics Committee of Harokopio University, Athens, and all participants provided signed informed consent.
Experimental protocol
Participants were equally randomized into two intervention arms and one control arm, each lasting for 3 months: (i) a group supplemented with a low-fat milk enriched with phytosterols, α-linolenic and linoleic fatty acids, vitamins and antioxidants (enriched milk group; EMG); (ii) a placebo milk group (PMG); and (iii) a control group (CG) receiving no product. The allocation into the two intervention arms was performed in a double-blind fashion. EMG and PMG participants were instructed to consume two portions (250 ml each) of milk daily. The placebo product was plain low-fat milk (1·8 %). The tested product was the same low-fat milk enriched (per 100 g) with 0·5 g of plant sterols, 0·43 g of linoleic acid, 0·04 g of α-linolenic acid, 40 mg of vitamin C, 7·88 mg of vitamin E, 111 μg of vitamin A, 2·5 mg of vitamin B6, 2·5 μg of vitamin B12, 100 μg of folic acid, 22 mg of Mg and 25 μg of Se. The milk consumed by both groups contained (per 100 g) 3·5 g of protein, 4·6 g of carbohydrate and 1·8 g of fat for a total energy of 205 kJ (49 kcal). The study products were all packaged in 1000 ml bottles (Friesland Campina Hellas, Athens, Greece).
Participants in the EMG and PMG attended seven dietary and lifestyle counselling hourly sessions, held biweekly in order to ensure compliance. The sessions were based on the Health Belief Model and Social Cognitive Theory( Reference Abood, Black and Feral 20 , Reference Prochaska and Velicer 21 ) and aimed at increasing awareness regarding health issues, especially those related to CVD, and motivate participants to set targets and change certain dietary and physical activity habits for improving cardiovascular risk and health status in general. Gradually, the sessions became more interactive and emphasis was placed on increasing self-efficacy in making changes to improve everyday habits. Some of the topics covered during these sessions included: reducing total and saturated fat intakes (replacing full-fat dairy products with the provided and other low-fat products), increasing fruit and vegetable intake, increasing fish consumption (especially fatty ones) and increasing physical activity. Participants in the CG only received a pamphlet on healthy lifestyle, including information on diet and physical activity; they did not attend any dietary and lifestyle counselling sessions.
During the week before and after the intervention, all participants came to the laboratory for anthropometric, nutritional and physical activity evaluation and blood sample collection.
Anthropometric assessment and blood pressure
Body weight was measured to the nearest 0·1 kg on a digital scale (Seca Alpha model 770, Hamburg, Germany) and standing height was recorded to the nearest 0·5 cm with a commercial stadiometer (Leicester Height Measure; CMS Instruments, Oxford, UK), while the participants wore light clothing and no shoes. BMI was calculated by dividing weight by the square of height (kg/m2). Blood pressure was measured in the right arm, with the participant seated and quiet after a 5 min rest, using a validated automated sphygmomanometer (Omron M6 Blood Pressure Monitor, Tokyo, Japan)( Reference El Assaad, Topouchian and Asmar 22 ).
Nutritional assessment
Three 24 h recalls (two consecutive weekdays and one weekend day) were obtained and data were analysed with Nutritionist V diet analysis software version 2·1 (First Databank, San Bruno, CA, USA), which was extensively amended to include data on Greek foods and recipes from the Greek food composition tables and on commercial food items widely consumed in Greece obtained by chemical analysis( 23 , Reference Trichopoulou 24 ).
Physical activity assessment
Physical activity was assessed by recording of one week's steps with the use of a pedometer (Yamax DigiWalker SW-200, Tokyo, Japan) as described by Strycker et al.( Reference Strycker, Duncan and Chaumeton 25 ).
Biochemical analyses
Fasting HDL cholesterol (HDL-C), TAG and C-reactive protein (CRP) were determined by photometric methods. All analyses were carried out by an automated centrifugal analyser with commercially available assays (Roche/Hitachi modular system, P800 module, Japan). LDL-C was calculated with the Friedewald equation, and VLDL cholesterol was calculated by subtraction from TC. Total fasting plasma homocysteine concentration was measured by immunoturbidometric method by an automated centrifugal analyser with commercially available assays (Abbott AxSYM, Abbott Park, IL, USA). Plasma folic acid and vitamin B12 concentrations were measured by electrochemiluminescence (Roche E170).
For the determination of fatty acids in erythrocyte membranes, venous blood samples were collected into EDTA-containing Vacutainer tubes and centrifuged immediately after collection at 4000 rpm for 10 min at 4°C (Universal 32R centrifuge; Hettich Laboratories, Tuttlingen, Germany). Supernatant plasma was then removed. Erythrocytes were washed and transferred into a freezer at −80°C for long-term storage until analysed. For fatty acid analysis, 300 μl of deep-frozen packed erythrocytes were thawed, vortexed, transferred to pre-weighed 10 ml Teflon-coated screw-capped tubes and precisely weighed. The erythrocyte membrane lipids were extracted and purified with chloroform–isopropanol as described by Rose and Oklander( Reference Rose and Oklander 26 ) and their fatty acid profiles were determined by GC of their methyl esters (FAME), which were prepared by the acetyl chloride methylation procedure described by Lepage and Roy( Reference Lepage and Roy 27 ). For the measurement of FAME, an Agilent HP series GC 6890 (Avondale, PA, USA) equipped with a flame ionization detector, split–splitless injector and an HP 6890 autosampler were employed. An aliquot (1 μl) of plasma FAME was injected into the gas chromatograph at a split ratio of 1 : 10. Separation of FAME was achieved on an SGE BPX70 capillary column (60 m long, 0·25 mm internal diameter), coated with a 0·25-mm thick film of cyanopropyl silicone. He gas was used as the carrier at a flow rate of 0·8 ml/min; the injector and detector were held at 230°C and 290°C, respectively, and the oven temperature programme was from 130°C to 250°C at a rate of 3°C/min. FAME peak identification was accomplished by means of a standard mixture of thirty-seven FAME purchased from Sigma (St Louis, MO, USA). The mixed FAME standard was injected periodically to record slight changes in retention times, while it furthermore served for the calculation of fatty acid response factors that were applied to the areas derived from the chromatographic traces. Quantification of fatty acids was accomplished by employing methyl nonanoate as internal standard and constructing reference curves by means of several dilutions of the FAME polystandard. For this purpose, 100 μl of the internal standard solution (methyl nonanoate, 1 mg/ml) was added both in standards and samples prior to analysis. Blood samples for each individual were processed in parallel to ensure that minor variations in sample handling were minimized.
Statistical analysis
All data are reported as the mean and standard deviation or as the mean change and 95 % confidence interval over baseline. Variables were examined for normality of distribution according to the Kolmogorov–Smirnov test. Baseline characteristics of the groups were compared with the use of one-way ANOVA for continuous variables and by the χ 2 test for categorical variables. For educational level, the non-parametric Kruskal–Wallis test was used. Data were analysed by using ANOVA for repeated measurements with time as a within-subject factor (baseline v. follow-up) and group as a between-subject factor (CG v. PMG v. EMG). When significant group × time interactions emerged, further analysis was carried out to evaluate the significance of changes over time within each group, by using Student's paired t test, and the significance of differences among groups before and after the intervention, by using one-way ANOVA. When necessary, ANCOVA was performed to adjust for potential confounders. Statistical analysis was carried out with SPSS statistical software package version 13·0. A two-tailed P ≤ 0·05 was considered statistically significant. The covariate that was used in all statistical analysis was education.
Results
Seven of the 115 participants initially assigned to participate in the study could not be re-examined at the 3-month follow-up and analysis of the fatty acid content in erythrocyte membranes could not be performed in seven of the remaining participants, providing a total of 101 participants with full data from both examinations. Consequently the number of participants in each group with full baseline and follow-up data was forty for the EMG, thirty-six for the PMG and twenty-five for the CG. The mean age of the participants was 48·7 (sd 8·6) years and 46·5 % of them were women. No significant differences were observed at baseline regarding the mean values of anthropometric and body composition indices as well as the percentage of participants smoking or being overweight or obese (Table 1). Significant differences were observed for educational status (lower years of education in the CG, P = 0·016) and therefore all further analyses were performed using this variable as a covariate.
Table 1 Baseline descriptive characteristics according to study group: hypercholesterolaemic adults (n 101) aged 40–60 years, Athens, Greece
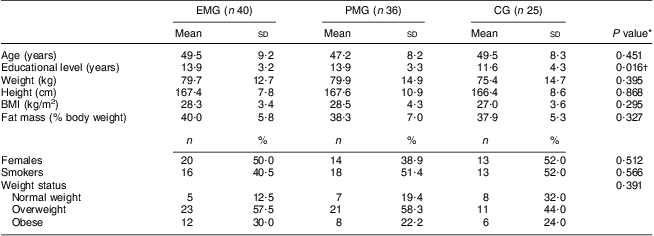
EMG, enriched milk group; PMG, placebo milk group; CG, control group.
*P values were derived by one-way ANOVA for continuous variables and by the χ 2 test for categorical variables.
†Derived from the non-parametric Kruskal–Wallis test.
According to the data presented in Table 2, the changes observed between baseline and follow-up for energy intake and percentage of energy intake derived from carbohydrate, protein and PUFA did not differ significantly among the study groups. However, a significant decrease with respect to percentage of energy intake derived from total fat was found for the EMG and PMG compared with the CG, who increased their intake (P = 0·037). Similar were the findings for percentage of energy intake derived from saturated fat (P = 0·042). Intake of linoleic acid differed significantly in the EMG compared with the PMG at follow-up (P = 0·005). Additionally, the intake of α-linolenic acid was found to increase only in the EMG, while in the PMG and CG it decreased at follow-up.
Table 2 Changes in dietary intakes of energy and macronutrients during the 3-month intervention period according to study group: hypercholesterolaemic adults (n 101) aged 40–60 years, Athens, Greece
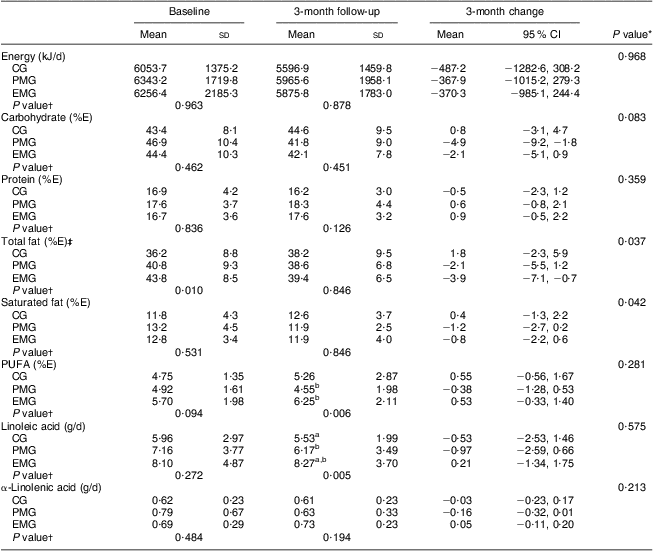
EMG, enriched milk group (n 40); PMG, placebo milk group (n 36); CG, control group (n 25); %E, percentage of energy intake.
All analyses were controlled for educational status.
Mean values were significantly different (P < 0·05): aEMG v. CG; bEMG v. PMG.
*Treatment × time interaction effect.
†Between-group comparisons at baseline and 3 months (treatment effect).
‡In the case of total fat intake, the analysis was adjusted for baseline values.
After examining the dietary consumption of certain food items, presented in Table 3, the consumption of total and fatty fish was found to increase, albeit insignificantly, in the intervention groups after the end of the intervention, while in the CG it decreased. Significant within-group increases in vegetable consumption were observed in both intervention groups, as well as significant decreases in cheese intake. The consumption of whole grains was significantly increased only in EMG compared with the CG (P = 0·025). The EMG and PMG increased their milk consumption significantly compared with the CG (P < 0·001). Changes were also observed at the end of study regarding daily steps and BMI, with the intervention groups exhibiting significantly more favourable values compared with the CG (Table 3) for both daily steps (P = 0·029) and BMI (P = 0·017).
Table 3 Changes in the consumption of certain food groups, physical activity levels and BMI during the 3-month intervention period according to study group: hypercholesterolaemic adults (n 101) aged 40–60 years, Athens, Greece
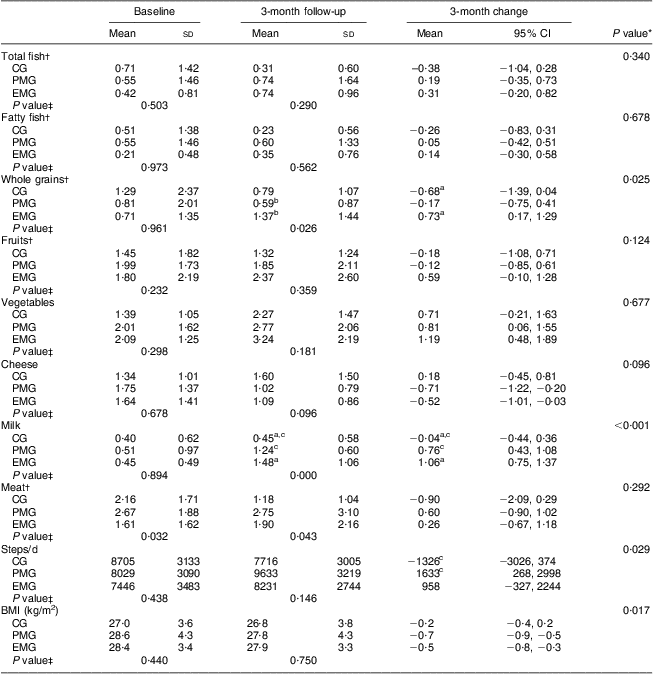
EMG, enriched milk group (n 40); PMG, placebo milk group (n 36); CG, control group (n 25).
All analyses were controlled for educational status.
Mean values were significantly different (P < 0·05): aEMG v. CG; bEMG v. PMG; cPMG v. CG.
*Treatment × time interaction effect.
†Values were rank transformed.
‡Between-group comparisons at baseline and 3 months (treatment effect).
Table 4 summarises the comparisons between groups with respect to the changes observed during the 3-month intervention period in the concentrations of PUFA in erythrocyte membranes, vitamin B12 and folic acid in plasma. No differences were observed between the three groups for linoleic acid, α-linolenic acid, arachidonic acid (AA), DHA and total n-3 PUFA, as well as for the ratios n-3:n-6 and AA:EPA. The only statistically significant changes were observed for EPA; in both the PMG and EMG, an increase in erythrocyte membrane content of EPA was observed whereas no significant change was observed in the CG (P < 0·001). Significant within-group changes were observed in all groups for DHA (increased at follow-up v. baseline), total n-3 fatty acids (increased at follow-up v. baseline) and n-3:n-6 (decreased at follow-up v. baseline). Only in the intervention groups were significant within-group changes in AA:EPA observed (decreased at follow-up v. baseline). Regarding plasma vitamin B12 and folic acid, the EMG exhibited significantly increased levels after the 3-month intervention compared with the PMG and CG (P < 0·001 and P < 0·001, respectively).
Table 4 Changes in the concentrations of selected fatty acids in erythrocyte membranes and plasma vitamin B12 and folic acid levels during the 3-month intervention period according to study group: hypercholesterolaemic adults (n 101) aged 40–60 years, Athens, Greece
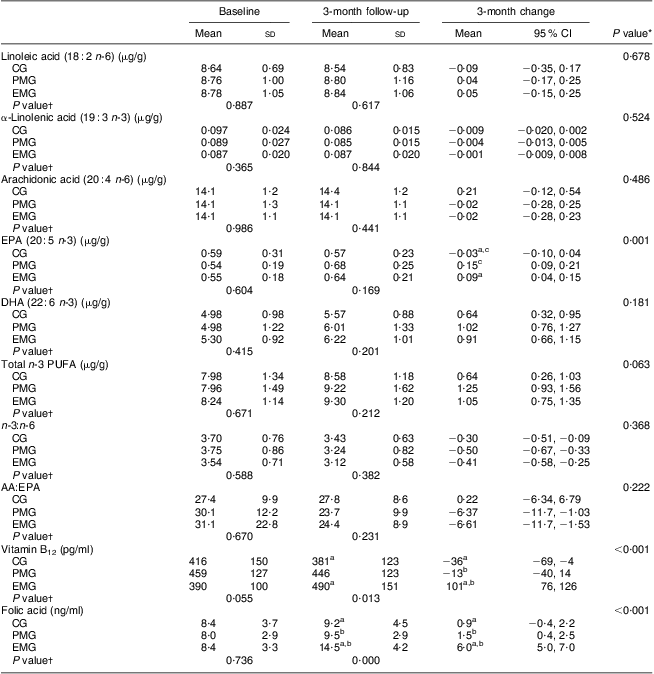
EMG, enriched milk group (n 40); PMG, placebo milk group (n 36); CG, control group (n 25).
All analyses were controlled for educational status.
Mean values were significantly different (P < 0·05): aEMG v. CG; bEMG v. PMG; cPMG v. CG.
*Treatment × time interaction effect.
†Between-group comparisons at baseline and 3 months (treatment effect).
Table 5 shows the changes in some biochemical indices after the 3-month intervention. Plasma homocysteine levels decreased significantly in the EMG compared with the other groups (P < 0·001). The EMG had lower LDL-C:HDL-C compared with the PMG and CG, the decrement being not significant (P = 0·066). In both the EMG and PMG, CRP levels decreased significantly compared with the CG (P = 0·003). In addition, a significant reduction in systolic blood pressure was observed within the intervention groups, while for diastolic blood pressure the reduction was significant only in the PMG.
Table 5 Changes in certain CVD risk indices during the 3-month intervention period according to study group: hypercholesterolaemic adults (n 101) aged 40–60 years, Athens, Greece
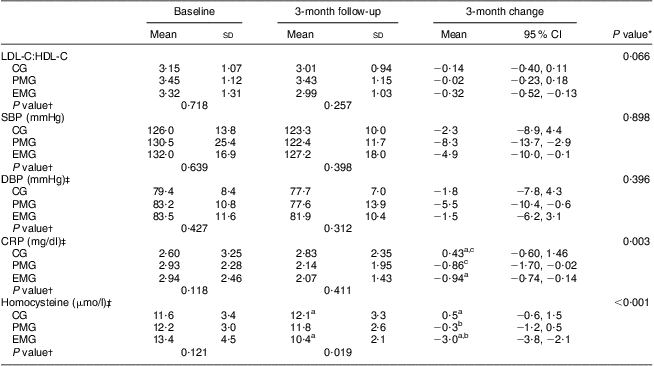
LDL-C, LDL cholesterol; HDL-C, HDL cholesterol; EMG, enriched milk group (n 40); PMG, placebo milk group (n 36); CG, control group (n 25); SBP, systolic blood pressure; DBP, diastolic blood pressure; CRP, C-reactive protein.
All analyses were controlled for educational status.
Mean values were significantly different (P < 0·05): aEMG v. CG; bEMG v. PMG; cPMG v. CG.
*Treatment × time interaction effect.
†Between-group comparisons at baseline and 3 months (treatment effect).
‡Values were rank transformed.
Discussion
The findings of the present study were indicative of the effectiveness of a 3-month dietary intervention scheme combining consumption of fortified milk with counselling, aiming to induce favourable changes in dietary and certain CVD risk indices in hypercholesterolaemic adults. Regarding lifestyle changes, both intervention groups (i.e. EMG and PMG) decreased their dietary intakes of total and saturated fat, while they increased their consumption of milk, vegetables, whole grains, total and fatty fish as well as their physical activity levels by ∼1000–1500 steps/d. These favourable lifestyle changes should be mainly attributed to the counselling part of the intervention, since both the EMG and PMG were motivated to decrease their consumption of high-fat foods (i.e. cheese) by replacing them with low-fat alternatives (i.e. lean meat, fish, fruits, vegetables, etc.) and to increase their daily physical activity level by setting personal goals of walking for at least 20–30 min/d.
Regarding the favourable dietary changes observed in the current study, these are in line with the findings of intervention studies that used nutrition counselling to reduce CVD risk( Reference Iacono 28 – Reference Brownlee, Moore and Chatfield 30 ). However, regarding changes in physical activity levels, the favourable findings of the present study are in contrast with other similar studies, which confronted difficulties in motivating adults who already had a sedentary lifestyle to become more active( Reference Moschonis, Katsaroli and Lyritis 31 , Reference Wolff, van Croonenborg and Kemper 32 ). The use of subjective methods (i.e. questionnaires) to assess changes in physical activity levels during the intervention period could provide an explanation for the lack of significant findings in these previous studies. The fact that the current study was able to report significant changes could be due to the use of a more objective method (i.e. pedometers) to assess changes in physical activity levels. The increase in physical activity levels observed for the intervention participants in the present study could be of great clinical importance; it is well documented that walking for ∼30 min/d on 5 d/week is associated with a 19 % reduction in CHD risk( Reference Zheng, Orsini and Amin 33 ).
Overall, the favourable dietary and physical activity changes recorded for the intervention groups in the present study are probably indicative of the effectiveness of the ‘nutrition and lifestyle counselling’ component of the programme in increasing the self-efficacy of the intervention participants to comply with the given health behaviour instructions. Adequate compliance of both intervention groups to the holistic intervention scheme provided to them could support the more favourable BMI changes observed in the EMG and PMG compared with the CG (−0·5, −0·7 v. −0·2 kg/m2 respectively, P = 0·017). A significant BMI reduction by 0·7 kg/m2 was also observed in another study that focused on reducing CVD risk factors via the implementation of healthy lifestyle counselling sessions for a period of 12 months( Reference Nilsson, Klasson and Nyberg 34 ), which is longer than the 3-month duration of the current intervention.
The effect of the increased PUFA intake in the intervention groups, which was probably and mainly through the increased consumption of fatty fish, although not significant compared with the CG, could be reflected in the respective significant increases in the EPA content of erythrocyte membranes. Still, no other significant differences were observed among study groups regarding the erythrocyte membrane contents of linoleic acid and α-linolenic acid, although the EMG was provided with an additional amount of 0·2 g of linolenic acid and 2·15 g of linoleic acid daily (∼20 % of the recommended Adequate Intakes, respectively)( 35 ). Probably the amounts of these two essential PUFA provided by the fortified milk to the EMG were not sufficient to induce significant changes in the concentration of these two fatty acids in erythrocyte membranes and this probably requires further intervention. Furthermore, it should be mentioned here that α-linolenic acid is normally metabolically converted to more elongated and unsaturated fatty acids, the sequence ending in EPA and DHA. As a result, the amounts of α-linolenic acid in plasma and erythrocyte membranes are expected to be low. In the human body the conversion yield of α-linolenic acid into EPA is relatively low – about 5–6 % – while the conversion to DHA is almost negligible( Reference Plourde and Cunnane 36 ). Hence, EPA in erythrocyte membranes might originate from dietary sources – i.e. fish and seafood – and probably to a lesser extent from metabolic conversion of dietary α-linolenic acid. This fact could provide another explanation for the lack of a significant increase in α-linolenic acid in EMG participants (originating from the α-linolenic intake from milk) and further explain the significant increment of EPA in erythrocyte membranes of both intervention groups (originating from changes in diet). This is another finding of the present study with potential clinical importance and application regarding CVD risk reduction.
Overall, the more favourable dietary, physical activity and BMI changes induced in the EMG and PMG may have also contributed to the significant decrease in CRP and blood pressure levels in these two groups compared with the CG. Regarding the effect of dietary factors on inflammation, n-3 fatty acids have well-established anti-inflammatory properties( Reference Mori and Beilin 37 ). Furthermore, the intake of fish and fish oils has been reported to exert a beneficial effect on certain CVD risk factors, such as on circulating levels of inflammatory markers( Reference Smith, Barraj and Kantor 38 ), and thus on the prevention of chronic diseases involving inflammatory processes( Reference Wall, Ross and Fitzgerald 5 ). Regarding the effect of BMI changes on CRP levels, previous studies have reported that obesity represents a low-grade chronic inflammatory state that is positively associated with increased CRP levels( Reference Matsushita, Yatsuya and Tamakoshi 39 , Reference Sell and Eckel 40 ). In this context, lifestyle intervention studies that favour changes in diet and exercise habits and have proved sufficient in achieving modest weight loss can also improve plasma levels of inflammatory cytokines such as CRP, IL-6 and TNF-α( Reference DeMarco, Johnson and Whaley-Connell 41 ). The clinical importance of the decrease in CRP levels reported for the intervention participants in the present study is further supported by a meta-analysis of twenty-two prospective studies, showing that patients with high plasma levels of CRP had a 45 % increase in CHD events compared with those with lower CRP levels( Reference Danesh, Wheeler and Hirschfield 42 ).
Moreover, significant within-group decreases in systolic blood pressure were observed in the EMG and PMG (4·9 and 8·3 mmHg, respectively). Epidemiological studies have shown that for every 10 mmHg reduction in systolic blood pressure, there is a 33 % decline in the risk of stroke( Reference Lawes, Bennett and Feigin 43 ). The increase in milk consumption in both the EMG and PMG could partly explain these favourable changes observed in systolic blood pressure. Based on growing evidence over the last years, regular consumption of dairy products is actively involved in blood pressure regulation( Reference McGrane, Essery and Obbagy 19 , Reference Kris-Etherton, Grieger and Hilpert 44 ). The blood-pressure-lowering effect of dairy products has been reported to be mainly attributed to their high content of specific nutrients, namely Ca, K and Mg( Reference McGrane, Essery and Obbagy 19 ).
All of the favourable changes reported above for both the EMG and PMG could be mainly ascribed to the combined lifestyle counselling and the consumption of plain milk. The additional positive effect of nutrients that were used in the fortification of milk consumed by participants in the EMG could be mainly reflected in the significant within-group decreases observed in LDL-C:HDL-C and homocysteine levels. Regarding changes in serum lipids, it is well known that in the context of a healthier lifestyle, the consumption of products enriched with plant sterols/stanols can reduce LDL-C levels by 10–14 %( Reference Plat and Mensink 45 ). This was also confirmed by the findings of the present study which showed a 12·6 % mean reduction in LDL-C levels as reported elsewhere( Reference Petrogianni, Grammatikaki and Pitsavos 46 ). Another possible explanation for the decrease in LDL-C:HDL-C in the EMG could probably stem from the increase in the consumption of whole grains observed for this group over the intervention period. A recent meta-analysis showed that greater whole grains consumption (2·5 servings/d v. 0·2 servings/d) was associated with a 21 % lower risk of CVD events( Reference Mellen, Walsh and Herrington 47 ).
Regarding the significant decrease in homocysteine levels observed for the EMG, this could be attributed to the fortification of milk with folic acid and vitamin B12. Higher intake of these nutrients by the EMG resulted in increased plasma levels, hence leading to the favourable reductions in plasma homocysteine levels in this group. As homocysteine is an independent risk factor for CVD, a reduction in its plasma levels is related to a decrease in relevant mortality and morbidity( Reference Refsum, Ueland and Nygard 14 , Reference Reeder, Hoffmann and Magdic 48 ).
The current study has certain strengths and limitations. Regarding strengths, to our knowledge the present study is the first intervention with enriched food products estimating changes of n-3 and n-6 PUFA levels in erythrocyte membranes rather than in plasma; although the former is highly modifiable, the latter is still the most common approach to assess nutritional status of PUFA. Regarding limitations, the quantities of nutrients used to enrich milk were in some cases not adequate to induce statistically significant changes to certain biochemical indices of their dietary intake. This is probably most obvious in the case of α-linolenic acid, in which the supplemented dose of 0·04 g/100 ml was possibly not adequate to significantly improve its content in erythrocyte membranes. Furthermore, although an extra group that would only receive placebo milk but without attending sessions would be useful to assess the real benefits of the educational component of intervention, still the main focus of the current study was to examine holistically the combined effect of a functional food with lifestyle counselling on behavioural and clinical risk indices of CVD.
Conclusions
The results of the present study revealed favourable changes in dietary and physical activity indices in both intervention groups that attended the lifestyle counselling sessions. These favourable lifestyle changes probably resulted in reductions in blood pressure and CRP levels in the EMG and PMG. An additional benefit of combining counselling with fortified milk was observed in the EMG, mainly in terms of decreases in LDL-C:HDL-C and homocysteine levels. Although the fortification of milk with only 0·04 g α-linolenic/100 ml in the current study seems not to have been sufficient to exert additional benefits in the EMG in terms of erythrocyte membrane PUFA content and blood pressure levels, the supplemented amounts of phytosterols, vitamin B12 and folic acid were found to be sufficient to induce favourable changes in LDL-C:HDL-C and homocysteine levels in this group. Further research is probably needed to address the issue of optimal fortification of milk or other food products and their effect on CVD, especially when combined with lifestyle counselling.
Acknowledgements
Sources of funding: The present study was supported by a research grant from Friesland Campina Hellas. Conflicts of interest: Y.M. works as a part-time scientific consultant for Friesland Campina Hellas. M.P., E.G., N.K., A.P., G.M., C.P. and S.A. have no potential conflicts of interest. Authors' contributions: M.P. and Y.M. contributed in the conception and design of the study. All authors contributed to data analysis and interpretation, drafting the article and approving the final version submitted. Acknowledgements: The authors would like to thank Dionysia Argyropoulou and Kostalenia Kallianioti for their help throughout the study.


