


Introduction
The South Shetland Islands are located north of the Antarctic Peninsula (Fig.l). The archipelago spans 510 km from south-west to north-east. It is made up of 11 islands each exceeding 100 km2 in area, the larger ones being King George Island (1 250 km2), Livingston Island (850 km2), and Elephant Island (480 km2). Eighteen further islands are between one and 100 km2, including Deception Island (85 km2). The total land area of the archipelago is about 3 740 km2. The larger islands are 96 to 98% ice-covered, with the exception of Deception Island (50%).
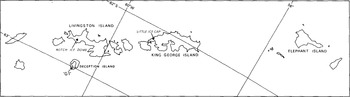
Fig.1. Index map of the South Shetland Islands, showing glaciers studied.
In this paper, glaciological data from Deception Island, Livingston Island, and King George Island, collected between 1968 and 1974, are presented and interpreted in terms of temporal and spatial variations of the mass-balance conditions.
DATA BASE
Deception Island
Glaciological studies at Deception Island were initiated by Orheim in the 1968–69 austral summer, and were continued as summer programmes until January 1974. Various mass-balance results, including the establishment of a record dating back to 1680 AD, were presented by Reference OrheimOrheim (1972, Reference Orheim1975, and Reference Orheim and Dunbar1977). In this paper, we discuss the mass-balance results from glacier “Gl” (Fig.2). Detailed mass-balance measurements were made on this glacier during the austral summers 1968–69 to 1970–71, using standard techniques including snow soundings, pits, and mass-balance stakes. Sixty-six stakes were placed on the glacier during those years, but some were lost each winter. Results from these studies were presented by Reference OrheimOrheim (1972). The mass-balance stakes were remeasured during the second half of January in the years 1972, 1973, and 1974 with the number of stakes recovered being 17, 6, and 9, respectively. The measurements in 1973 were carried out by J Curl and N Ten Brink.
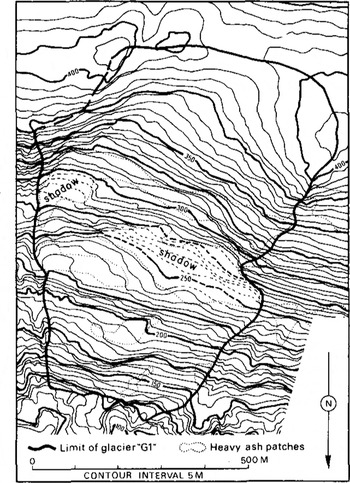
Fig.2. Glacier “Gl”. Original map was constructed by H H Brecher, Ohio State University, at scale 1:6 000 from Argentine aerial photography taken in 1968.
Livingston Island
Glaciological work was initiated by Orheim and Govorukha in January 1971, and Orheim remeasured the stakes in January 1972 and January 1974. J Curl and N Ten Brink took the measurements in the 1972–73 austral summer. The studies were done on the western part of Rotch Ice Dome (RID) (Fig.3), and 15, 20, and 9 stakes were revisited in the summer seasons 1971–72, 1972–73, and 1973–74, respectively.
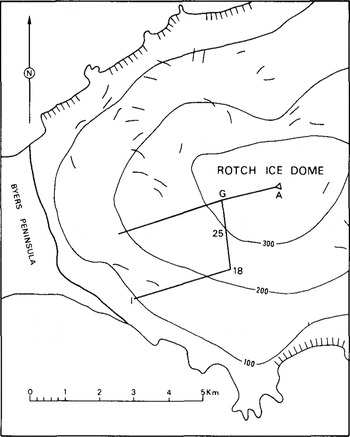
Fig.3. Rotch Ice Dome, Livingston Island, with location of mass-balance stakes. Short lines mark crevasses. Stakes 1 to 25 were established in 1971. The other west-trending leg was established in 1972, and stakes A to G in 1973.
King George Island
The glaciological results referred to here were collected by members of the Soviet Antarctic Expeditions at various times during the period 1968–71, primarily by V V Zamoruyev and A I Orlov in 1968 and 1969, and by Govorukha in 1969–71 (Reference ZamoruyevZamoruyev 1972, Reference Govorukha and SimonovGovorukha and Simonov 1973). Altogether 97 stake locations were established, extending across the island (Fig.4), but most stakes at high elevations were lost during the winter seasons. Special studies were done on the “Little Ice Cap” (LIC) near Fildes Peninsula up to stake 30. Radio echo-soundings (Reference Govorukha, Chudakov and ShalyginGovorukha and others 1974) show an average ice thickness of 100 m, with large variations (Fig.5).
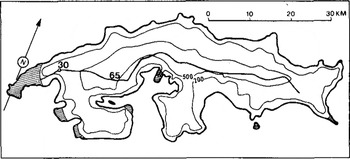
Fig.4. King George Island, with line of stakes.
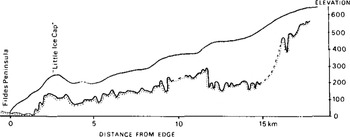
Fig.5. Ice-thickness profile from western part of King George Island, following stake line (Fig.4) up to no.65.
Results
Figures 6, , show stratigraphy and density profiles from RID, Livingston Island, and from LIC, King George Island. RID and LIC are very similar in form, stratigraphy, and density. Measurements shows that the snow temperature is raised to 0°C during the summer throughout their accumulation areas, which are thus in the soaked fades. Both ice caps show zones of superimposed ice at their western margins, where they terminate on land. The density measurements at LIC indicate that the firn/ice transition is at 12 to 20 m depth.
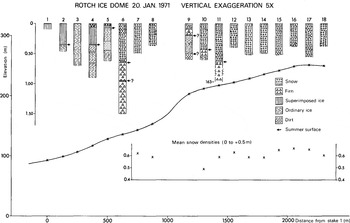
Fig.6. Surface profile of Rotch Ice Dome along stakes 1 to 18 (Fig.3), with stratigraphy and densities from shallow cores.
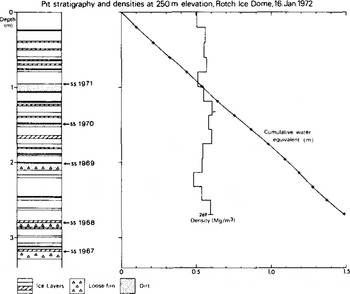
Fig.7. Stratigraphy and density by stake 17 on Rotch Ice Dome.
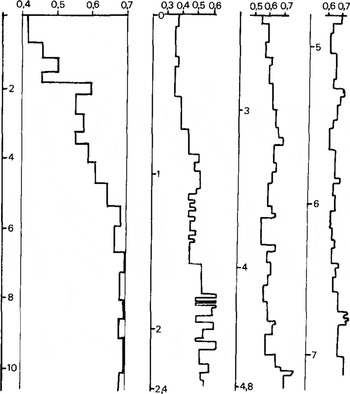
Fig.8. Two density profiles collected near stake 30 (Fig. 4) on “Little Ice Cap“, King George Island during August-November 1970. Note that the two curves have different depth and density scales.
Mass-balance results from the western sector of RID for 1971–74 are shown in Figure 9. The large variations in observed mass balance between 120 and 210 m elevation along the southern stake line are caused by the topography (Fig.3). The increase in slope results in deflation and redistribution of snow. This phenomenon is less marked in other parts of the western sector, and this has been compensated for in the net mass-balance curves.
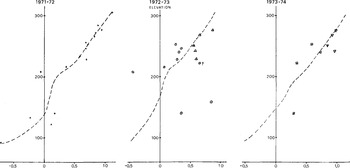
Fig.9. Net mass balance (bn) of western part of Rotch Ice Dome 1971–74. All stake measurements are shown. The triangles show data from the northern stake line.
The mass balances for 1969–71 for King George Island are shown in Figure 10. The observations indicate that the winter balance was similar in both years, but with a less negative summer balance in 1969, giving rise to a lower equilibrium line. This is supported by measurements at Bellingshausen station, which show a temperature higher by 0.3 deg for the December 1970-February 1971 period than for the same period in the previous year. Pyroclastic material from the August 1970 eruption at Deception Island lowered the albedo in the ablation area and also contributed to increased melting in the 1970–71 summer.
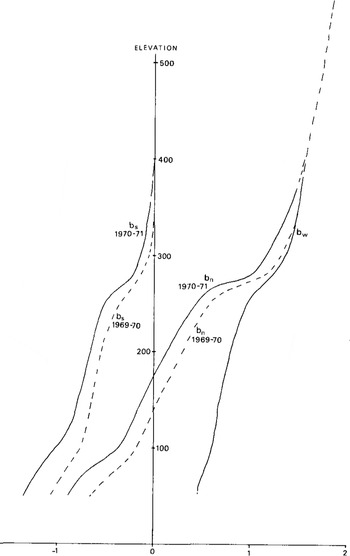
Fig.10. Net mass balances at King George Island, 1969–71, mainly from western part of profile on Figure 4. The data for the upper parts are based on few observations.
The volcanic eruptions on Deception Island in February 1969 and August 1970 left stratigraphic markers that could be observed visually in the accumulation areas of RID and at King George Island. Ash horizons from the December 1967 eruption were not observed at these two localities, as the winds were from the north-east during the eruption.
Figure 11 shows annual balances from a pit on LIC and from the fissure at “Black” glacier on Deception Island. The “Black” glacier stratigraphy is believed to be accurately dated because the summer dust layers form excellent markers (Reference OrheimOrheim 1972). The LIC stratigraphy has the usual uncertainties in dating resulting from use of changes in firn properties as stratigraphic horizons. Nevertheless, the curves show surprisingly good correspondence, suggesting that the dating may be accurate also at King George Island. The mass balances are fairly well correlated which also suggests that the whole archipelago experiences similar annual variations in winter and summer balances. That the variations in summer temperature at Deception Island are representative of a larger area has already been shown by Reference OrheimOrheim (1972).
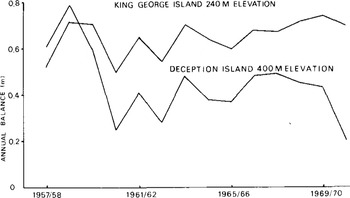
Fig.11. Net annual balance (in water equivalent) at 400 m elevation at Deception Island and at 240 m elevation at King George Island.
Figure 12 “average” or “normal” mass balances computed for the three islands. Obviously there are considerable uncertainties in these curves, especially for RID. The summer balance for RID is based on extrapolation from data on late summer balances, and is therefore less precise. It suggests, however, that the winter balance at RID must be less than at King George Island.
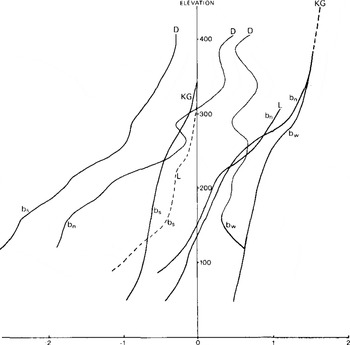
Fig.12. "Normal" mass-balance curves for the three locations: “Gl” on Deception Island (D), Rotch Ice Dome on Livingston Island (L), and King George Island (KG), balance. bs is summer balance and bw is winter
The Deception Island curves are markedly different from the other two, for three main reasons. (1) Glacier “Gl” consists of a series of steps extending across the glacier (Fig.2), which affects snow distribution and summer balance. (2) The summer balance at “Gl” is much more negative than at the other two localities, because of lower albedo on “Gl” from windblown dust. The summer temperatures are also higher on Deception Island. (3) The winter balance is lower on the upper sections of “Gl”. A ridge forms the upper boundary of “Gl”, and snow is deflated from here onto the lower slopes to such an extent that the winter balance is near-constant with elevation.
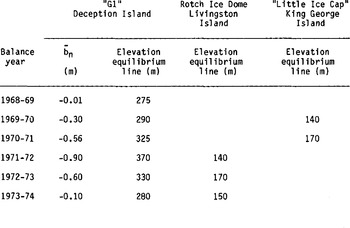
Table I compares the mass balances and equilibrium- line elevations for the three localities. bn is the mean net mass balance averaged over the glacier area. The mean net balances for “Gl” for the three balance years 1971–72 to 1973–74 have larger uncertainties than those for the previous three years, which were 0.10 to 0.15 m. However, the 1971–74 stake measurements are reasonably consistent, which gives confidence in the data. The large negative net balances during 1970–71 to 1972–73 are probably caused by the large amounts of pyroclastic material deposited on the island by the August 1970 eruption. This was among the largest explosive eruptions in the world in recent years. Strong winds redistributed the finer fractions to all parts of the glaciers during the summers when the pyroclastics were exposed. In subsequent years, this effect will become unimportant in the accumulation areas, whereas the ablation areas of the Deception Island glaciers will continue to show high melt figures.
The mass-balance curves for King George Island and RID are probably representative of the massbalance conditions throughout the archipelago, especially for glaciers of ice-cap form. Deflation affects the mass balances at all three localities, and must be taken into account for glaciers with steep slopes or ridges. The high summer balances shown at Deception Island are not typical.
Table 1. MEAN NET BALANCE (bݳn) FOR “Gl”, DECEPTION ISLAND, FOR THE BALANCE YEARS 1968–69 TO 1973–74, AND EQUILIBRIUM-LINE ELEVATIONS INVESTIGATED FOR THE THREE LOCALITIES DURING THE SAME YEARS
Acknowledgements
Many people took part in the field work at Deception and Livingston islands, and one of us (00) would like to thank especially Fleetwood Koutz, Kent Densing, Robert Ellis, Terence Hughes, Jim Curl, Mike Quinn, and Skip Birchall for their assistance. Colin Bull, Valter Schytt, and Jean-Roland Kläy also participated in the field work and provided many important contributions. 00's research was supported by US National Science Foundation grants GA-4233, GA-14733, GV-26133, and GV-28895, administered by the Ohio State Research Foundation, and later by Norsk Polarinstitutt. We are especially grateful to Jim Curl and Norman Ten Brink for providing the mass-balance data collected during the 1972-–73 sssseason.


