


Type 2 diabetes is escalating worldwide and is estimated to affect 23·6 million people or 7·8 % of the US population. About 800 000 new diabetes cases are diagnosed each year, and diabetes is the sixth leading cause of death in the USA. According to the National Diabetes Statistics of 2007, the average medical expenditure for diabetics was 2·3 times higher than that compared with non-diabetics and estimated at a total of $174 billion in direct and indirect costs of health care expenditures (http://www.diabetes.org/diabetes-statistics.jsp). The prevention and treatment cost for diabetes is estimated to exceed US $302 billion by 2025. Considering the heterogeneity of diabetes and the limitations of current therapies, such as various side effects as well as high secondary failure rates, there is an urgent need to explore new anti-diabetic agents. Furthermore, there is a growing and renewed interest in effective but low-cost alternative therapies with minimum side effects.
Morinda citrifolia L. (Rubiaceace), commonly known as ‘noni’ is native to Polynesia and widely cultivated in tropical areas of the South Pacific. In the USA, noni is grown in Hawaii and Florida. It is also native to Australia, Malaysia, the West Indies, India, Vietnam, the Philippines, Taiwan and other tropical parts of the world. Claims of its ‘healing powers’ have fuelled much of the commercial interest in noni and promoting a worldwide market for noni-based dietary supplements including fruit juice. Pacific Islanders and Native Hawaiians consume noni juice prepared by fermenting the fruits(Reference McClatchey1). Traditionally, the stem, bark, root and leaves of noni have been used for centuries to treat diabetes, hypertension, cancer and CVD(Reference McClatchey1–3). Earlier scientific studies have investigated the anticancer, antioxidant and immunomodulatory properties of noni(Reference Akihisa, Matsumoto and Tokuda4–Reference Zhang, Li and Wong9). Similarly, Zhang et al. (Reference Zhang, Li and Wong9) demonstrated that fermented noni fruit exudates or juice significantly reduced tumour burden in animals. Recent studies have demonstrated that root extracts of Morinda officinalis and M. citrifolia lowered plasma glucose in streptozotocin-induced diabetic rats and mice, respectively(Reference Kamiya, Hamabe and Harada10–Reference Soon and Tan12), while treatment with Tahitian noni fruit juice (NJ) for 4 weeks reduced blood glucose in alloxan-induced diabetic rats(Reference Horsfall, Olabiyi and Aiyegbusi13). However, the anti-diabetic mechanisms of noni remain unknown.
Obesity-associated insulin resistance is an important aetiological factor of type 2 diabetes and is associated with increased glucose production due to the inability of insulin to suppress hepatic gluconeogenesis and promote glycolysis(Reference Matsumoto, Han and Kitamura14). Insulin suppresses hepatic gluconeogenesis via activation of the Akt/phosphatidylinositol-3-kinase pathway and subsequent phosphorylation of forkhead box O (FoxO) transcription factors(Reference Matsumoto, Han and Kitamura14–Reference Zhang, Patil and Chauhan16). FoxO proteins are a family of transcription factors consisting of FoxO1, FoxO3a, FoxO4 and FoxO6, involved in several signalling cascades that regulate cell-cycle progression, cell death, DNA repair, protection against oxidative stress, glucose and lipid metabolism, and longevity(Reference van der Heide, Hoekman and Smidt17). FoxO1, along with the PPAR γ-coactivator 1α, stimulates glucose production by stimulating gluconeogenic enzymes, phosphoenolpyruvate carboxy kinase (PEPCK) and glucose-6-phosphatase, catalytic (G6P), via the cyclic AMP/Creb pathway(Reference Matsumoto, Han and Kitamura14). Under conditions of high circulating plasma glucose levels, insulin-induced phosphorylation of FoxO1 via Akt/phosphatidylinositol-3-kinase activation results in the nuclear expulsion of FoxO and the inhibition of PEPCK and G6P(Reference Aoyama, Daitoku and Fukamizu18), as well as the increase in genes regulating glycolysis such as glucokinase (GCK)(Reference Zhang, Patil and Chauhan16). A recent study by Horsfall et al. (Reference Horsfall, Olabiyi and Aiyegbusi13) indicated that fermented noni juice (fNJ) synergistically augmented insulin action in diabetic rats by lowering fasting glucose. Therefore, the aim of the present study was to investigate the molecular mechanism associated with insulin mimetic effects of M. citrifolia L. on hepatic gluconeogenic genes such as PEPCK and G6P and glycolytic genes such as GCK, and FoxO phosphorylation.
Materials and methods
Preparation of fermented noni fruit juice
NJ is commercially available as pure noni fruit juice. Moreover, NJ mixed with other fruit juices, such as apple, cranberry and/or grapes, is also popular. We tested the hypoglycaemic effects of fNJ in mice fed a high-fat diet (HFD). Ripened fruits of M. citrifolia L. were obtained from local plants in Honolulu, Hawaii, located near the University of Hawaii at Manoa (UHM) and placed in a closed glass jar in partial light at room temperature (20–25°C). All fruits were obtained from the same area, in fact the same plant, and were of the same age based on the degree of ripeness. After 2 weeks, the fermented fruits along with the juices and pulp were collected and strained through cheese cloth(Reference Zhang, Li and Wong9). The juice was stored at 0–4°C until analysis. Fruits were identified by Dr Will McClatchey, ethnobotanist, at the University of Hawaii, and voucher specimens were deposited at the official herbaria, UHM herbarium (HAW), and labelled as NerurkarNoni0001 and NerurkarNoni0002. Chemical analysis was conducted at cost by outsourcing to analytical laboratories in Honolulu, Hawaii. Physical properties and mineral contents of fNJ were analysed at the Agricultural Diagnostic Service Center, UHM, while scopoletin content was analysed at the Analytical Laboratory, Cancer Research Center of Hawaii, UHM using standard liquid chromatography–MS techniques (Table 1).
Table 1 Physical properties and mineral contents of fermented noni juice (fNJ)*
(Mean values and standard deviations)
ppm, Parts per million.
* Values are based on the analysis of 50 ml of fNJ per replicate.
Experimental design
Male C57BL/6 mice, 4–6 weeks old, were purchased from Jackson Laboratories (Ann Arbor, MI, USA) and randomised into four groups of six animals each: control; HFD; control+fNJ; HFD+fNJ. Control rodent chow contained 11 %kJ fat, 16 % kJ protein and 73 % kJ carbohydrate (17·02 kJ/g, #D12328; Research Diets, New Brunswick, NJ, USA), whereas HFD chow contained 58 %kJ fat, 16 % kJ protein and 26 % kJ carbohydrate (131·2 kJ/g, #D12331; Research Diets)(Reference Nerurkar, Lee and Motosue19). Nutrient contents of the two diets have been published earlier(Reference Nerurkar, Lee and Motosue19). fNJ was fed orally, twice per d at physiologically relevant human consumption levels of 1·5 μl/g body weight (v/w), for 12 weeks. For adults, the suggested dose for commercial noni juice is about 2 ounces twice per d (a total of 4 ounces or 118 ml). Assuming an average of 70 kg adult, the dosage is about 1·68 μl/g body weight. However, future studies are required to optimise the exact dosage in C57BL/6 mice. fNJ was fed to the mice orally through a pipette and the tip was held in the mouth, until all the fNJ was swallowed. Control mice were fed an equivalent amount of water using a pipette. All procedures were conducted in accordance with guidelines established by the National Institutes of Health and the University of Hawaii Institutional Animal Care and Use Committee. Animals were housed individually and allowed to eat and drink ad libitum for 12 weeks. Body weights, food and water intake were measured daily. At the end of the study, after an overnight fast, mice in each group were anaesthetised by isofluorane, followed by blood drawn through cardiac puncture. All tissues were snap-frozen in liquid N2 and stored at − 80°C until further analysis.
Analytical procedures
For plasma preparation, whole blood was collected in heparinised tubes. Liver function tests were analysed by measuring alanine aminotransferase, aspartate aminotransaminase (Biotron Diagnostics USA, Inc., Hemet, CA, USA) and lactate dehydrogenase (Bioassays Systems, Hayward, CA, USA)(Reference Nerurkar, Lee and Motosue19).
Glucose and insulin tolerance tests were conducted after a 4 h fast, as described previously(Reference Nerurkar, Lee and Motosue19). In brief, tolerance tests were conducted after an intraperitoneal injection of either 50 % dextrose at 1·5 mg/g body weight (NDC 57 319-071-07; IVX Animal Health, Inc., St Joseph, MO, USA) or human insulin at 0·5 U/kg (3·0 nmol/l per kg) body weight (Novolin R, Human, U-100, catalogue no. 183311; Novo Nordisk, Inc., Princeton, NJ, USA). Tail vein blood was used to determine blood glucose levels at 0, 30, 60 and 120 min with a One Touch Ultra™ glucometer (Lifescan, Philadelphia, PA, USA).
RNA extraction
In brief, a PRO 200 Laboratory Homogenizer (Pro Scientific, Oxford, CT, USA), was used to homogenise 30-40 mg of liver, followed by the QIAshredder (catalogue no. 79656; Qiagen, Inc., Valencia, CA, USA), and RNA was extracted using the RNeasy Mini Kit (catalogue no. 74104; Qiagen, Inc.), according to the manufacturers' protocol. The quality of RNA was tested using the Agilent bioanalyser at the Greenwood Molecular Biology Facility, Pacific Biosciences Research Center, UHM. The 18S:28S ratios of all samples were in the range of 1·8–2·0.
Genome-wide microarray analysis
Transcriptional profiling of mouse liver was performed using the Affymetrix GeneChip Mouse Genome 430 2.0 Array (part no. 900497; Affymetrix, Inc., Santa Clara, CA, USA), according to the standard GeneChip eukaryotic target labelling protocol (Affymetrix, Inc.) at the Greenwood Molecular Biology Facility, Pacific Biosciences Research Center, University of Hawaii. All subsequent manipulations, including labelling and hybridisation, were performed independently for each sample as published(Reference Nerurkar, Johns and Buesa20). Briefly, 10 μg of total cellular RNA per sample were used to synthesise double-stranded complementary DNA, which then was transcribed in vitro in the presence of biotinylated dNTP (Enzo Diagnostics, Farmingdale, NY, USA). Successful labelling of all the samples was tested by test array hybridisations, using the Affymetrix GeneChip Test3 Array (part no. 900341; Affymetrix, Inc.), to ensure quality of the biotinylated target. Appropriate internal controls were added to the hybridisation cocktail. Gene chip arrays were scanned at 570 nm with a gene array scanner and analysed with Gene Chip Operating Software version 1.4 (Affymetrix, Inc.). The method of normalisation used was a scaling algorithm, which involves multiplying the mean intensity of each chip (not including the upper and lower 2 %) by a factor, which changes the mean intensity to 500 for every chip. By scaling each chip, a direct comparison could be made between all the chips. For a given gene transcript in any chip-to-chip comparison, Gene Chip Operating Software generates a ‘change call’ parameter ‘increase’ or ‘decrease’ based on a consideration of signal specificity as well as intensity. The ‘change call’ is based on an evaluation of the intensities of the signals generated from each gene transcript on one chip relative to the corresponding signal intensities on the other chip. The data were filtered using Genespring 9.0 software, based on both ‘detection call’ (presence or absence) and ‘signal log ratio’ (1·5-fold change) in any of the comparisons between the control and various treatment groups. In the case of the Affymetrix ‘detection call’ algorithm, genes that were ‘absent’ in all samples were filtered out. Genes had to be detected or ‘present’ in at least one out of the four treatment groups. Additional filter was based on the ‘signal log ratio’, which is the log base 1·5 of the fold change. Relative changes equal to or greater than 1·5-fold levels of expression were considered significant.
Validation of selected genes by real-time RT-PCR
To confirm changes in the expression of selected genes, RNA samples from all groups of animals, including those analysed by microarray, were assayed by real-time PCR using SYBR Green (Bio-Rad iCycler, Hercules, CA, USA). In brief, 1 μg of total RNA was used for complementary DNA synthesis (iScript complementary DNA Synthesis Kit; Bio-Rad) and real-time RT-PCR was conducted using 2 μl of diluted complementary DNA (1:3) in duplicate, with both internal and no template controls. Primer sequences used for amplification of specific genes were designed using Beacon Designer 2.0 primer design software (PREMIER Biosoft International, Palo Alto, CA, USA; Table 2). The housekeeping gene GAPDH was used as an internal control for normalisation in parallel with each gene of interest. PCR cycling conditions were 95°C for 5 min, forty-five cycles of 95°C for 10 s, 54°C for 45 s, and the melt curve starting from 55°C of eighty cycles increasing 0·5°C every 10 s. Each reaction was performed at least twice in duplicate, to verify reproducibility. PCR product intensity data were normalised relative to GAPDH, and relative fold change was obtained using the ΔΔC t equation, which was calculated by Bio-Rad iQ5 software (Bio-Rad, Hercules, CA, USA).
Table 2 Mouse and human primer sequences for real-time RT-PCR
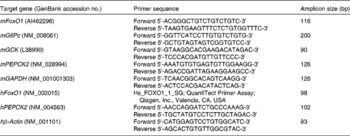
m, Mouse; h, human.
Analysis of hepatic forkhead box O phosphorylation by Western blotting
Whole cell extracts were prepared from frozen livers, as published earlier(Reference Snee, Nerurkar and Dooley21). In brief, proteins were extracted with ice-cold buffer containing 10 mm-Tris–HCl (pH 7·4), 150 mm-NaCl, 1 mm-EDTA, 1 mm-ethylene glycol tetraacetic acid, 100 mm-NaF, 150 mm-sodium pyrophosphate, 2 mm-sodium orthovanadate, 2 mm-phenylmethylsulphonyl fluoride and protease inhibitor (Roche Diagnostics Corporation, Indianapolis, IN, USA). Homogenates were centrifuged at 12 000 rpm at 4°C for 20 min and supernatants were stored at − 80°C until further analysis. Protein concentrations were determined using the Bradford protein assay reagent (Bio-Rad Laboratories), according to the manufacturer's instructions. Briefly, cytoplasmic and nuclear proteins (100 mg and 50 mg, respectively) were separated on 4–15 % gradient polyacrylamide gels (Bio-Rad Laboratories) and transferred to nitrocellulose membrane. The membranes were blocked in 0·5 % bovine serum albumin prepared in Tween/Tris-buffered saline and incubated overnight in goat phosphorylated Forkhead transcription factor (FKHR) (T-24) primary antibody (Santa Cruz Biotechnology, Inc., Santa Cruz, CA, USA) at room temperature. After washing, blots were probed with donkey anti-goat IgG horseradish peroxidase conjugate secondary antibody (Santa Cruz Biotechnology, Inc.). Blots were stripped using ReBlot Plus mild stripping solution (Millipore, Billerica, MA, USA) and probed for total FoxO with rabbit polyclonal FKHR (H-128; Santa Cruz Biotechnology, Inc.) and later with β-actin using monoclonal β-actin primary antibody (Sigma Chemicals, St Louis, MO, USA). All aforementioned primary and secondary antibodies were used at 1:3333 and 1:5000 dilutions, respectively. Proteins were visualised using a commercially available electrochemiluminescence kit (Novex® ECL Chemiluminescent Substrate; Invitrogen Corporation, Carlsbad, CA, USA). Protein bands were scanned and intensities were analysed using ‘UN-SCAN-IT gel’ analysis software (Silk Scientific, Inc., Orem, UT, USA).
HepG2 cell culture
Human hepatoma cells, HepG2, were obtained from the ATCC (Manassas, VA, USA) and maintained in Eagle's minimum essential medium supplemented with 10 % heat-inactivated fetal bovine serum from SAFC Biosciences (Lenexa, KS, USA) and 1 % penicillin–streptomycin from Sigma-Aldrich Company. Cells were used between passages 9 and 10 and used at 80–90 % confluency.
Forkhead box O ELISA
For phosphorylation studies, HepG2 cells were seeded in ninety-six-well plates at a density of 5 × 10⁴ cells/well in 200 μl media. At 72 h after plating, cells were serum-starved for 16 h, followed by treatment with and without 1·5 and 3 % fNJ in complete medium for 24 h. Doses were chosen based on our initial toxicity studies with varying concentrations of fNJ (v/v) in serum-starved cells (data not shown). Cells were treated with and without 100 nm-bovine pancreas insulin (Sigma-Aldrich Company) for the last 30 min before the assay. Cells were washed twice with serum-free medium and fixed in 4 % formaldehyde in PBS, followed by incubation in quenching buffer containing 1 % H2O2 and 0·1 % sodium azide in PBS. Cells were then blocked with a 5 % non-fat milk in buffer containing 10 mm-Na2HPO4, 1·8 mm-KH2PO4, 2·7 mm-KCl, 0·15 m-NaCl and 0·1 % Triton X-100. Total and phosphorylated FoxO were detected using the FACE™ FKHR ELISA kit (Active Motif, Carlsbad, CA, USA), according to the manufacturer's protocol. The ELISA kit provides a simple and sensitive method for detecting protein phosphorylation directly in the cell without Western blotting. In brief, blocked cells were incubated overnight at room temperature with phosphorylated or total FoxO1 primary antibody, followed by 1 h incubation with horseradish peroxidase-conjugated secondary antibody. After the addition of developing and stop solutions, absorbance was measured at 450 nm with the Wallac Victor2 1420 Multilabel Counter (PerkinElmer Life Sciences, Boston, MA, USA). Background absorbance was measured using a reference wavelength of 655 nm. Values were normalised to the cell number measured by staining the cells with Crystal Violet dye provided in the kit. After 30 min, cells were solubilised with 1 % SDS for 1 h and absorbance was read at 590 nm.
Small-interference RNA for forkhead box O 1
For transfection studies, HepG2 cells were plated in clear six-well plates at a density of 3·3 × 105 cells/well. After 24 h plating, cells were transiently transfected with a mixture of DharmaFECT 4 reagent and either FoxO1 small interfering RNA (siRNA) or non-target siRNA (Dharmacon, Inc., Lafeyette, CO, USA) using serum-free, antibiotic-free, Eagle's minimum essential medium (ATCC) to a final concentration of 100 nm, in accordance with the manufacturers' instructions. After 16 h, serum was added to the cells to a final concentration of 10 %. Cells were transfected for a total of 48 h, after which they were washed and treated with varying concentrations of fNJ for 1 h. Efficiency of FoxO1 knockdown and mRNA expressions of PEPCK, G6P and GCK were determined by quantitative RT-PCR. In brief, total RNA was extracted from HepG2 cells using Tri Reagent (Sigma-Aldrich Company), according to the manufacturer's instructions. DNA was then digested using the commercial DNA-free kit (Ambion, Austin, TX, USA), according to the manufacturer's instructions. All RNA samples had 260:280 ratios between 1·8 and 2·0.
Statistical analysis
Homeostasis model assessment (HOMA) was used to calculate relative insulin resistance (G 0 × I 0/22·5), where G 0 is the fasting blood glucose (mmol/l) and I 0 is the fasting plasma insulin (μU/l). All statistical calculations were performed using GraphPad Prism, Prism 5 for Windows, version 5.01 (GraphPad Software, Inc., San Diego, CA, USA). A one-way ANOVA model was used to compare means between the four animal groups (control, HFD, control+fNJ and HFD+fNJ). For repeated assays of plasma concentrations of various blood analytes, a repeated-measure ANOVA was used to compare means. Each sample was analysed twice in duplicate. Post hoc pairwise multiple comparisons were evaluated using Tukey's multiple comparison test, after ANOVA. All P values were based on two-sample tests. Results were considered significant at P < 0·05.
Results
Fermented noni juice reduces body weights and improves glucose tolerance in mice fed a high-fat diet
Control mice fed with fNJ did not have any significant effect on the daily intake and total energy of food consumed when compared with mice fed the control diet (Table 3). Both daily and total food intake were comparable in mice fed the HFD and HFD+fNJ, but were lower when compared with control diet-fed mice and control diet+fNJ-fed mice (P < 0·03; Table 3). Although there were no differences in initial body weights among all groups of mice, at the end of 12 weeks, the final body weights of HFD-fed mice were 23 and 28 % greater than control diet-fed mice and control diet+fNJ-fed mice, respectively (Table 3). fNJ significantly lowered (P < 0·05) the final body weights by 10 % among mice fed a HFD+fNJ, compared with HFD-fed mice, but was significantly higher (P < 0·05) by 12 % than mice fed a control diet (Table 3). Overall, the total weight gain in HFD-fed mice, over a period of 12 weeks, was significantly higher (164 %) (P < 0·05) than control diet-fed mice (Table 3). Similarly, the total weight gain in mice fed with the HFD+fNJ was significantly higher than control diet-fed mice (91 %) (P < 0·05), but 27 % lower than HFD-fed mice (P < 0·05). Feeding of the control diet+fNJ had no significant effect on body weights when compared with control diet-fed mice, but were lower than those of HFD- and HFD+fNJ-fed mice (Table 3).
Table 3 Metabolic parameters in C57BL/6 female mice fed a high-fat diet (HFD) and fermented noni juice (fNJ)
(Mean values and standard deviations)
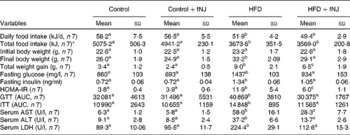
HOMA-IR, homeostasis model assessment-insulin resistance; GTT, glucose tolerance test; AUC, area under the curve; ITT, insulin tolerance test; AST, aspartate aminotransaminase; ALT, alanine aminotransferase; LDH, lactate dehydrogenase.
a,b,c Mean values with unlike superscript letters were significantly different (P < 0·05).
* Total food intake per mouse for 12 weeks.
The baseline fasting glucose did not differ between the groups (data not shown). However, by 12 weeks, fasting glucose levels among HFD-fed mice were significantly higher by 67 and 61 % (P < 0·05) when compared with control diet-fed mice and control diet+fNJ-fed mice, respectively (Table 3). fNJ did not affect blood glucose levels in control diet-fed mice, but significantly lowered (P < 0·05) glucose levels by 35 % in mice fed the HFD+fNJ when compared with mice fed only the HFD (Table 3). Similarly, insulin levels were significantly elevated in mice fed the HFD compared with control diet-fed mice and control diet+fNJ-fed mice. Mice fed the HFD+fNJ demonstrated lower plasma insulin compared with all the other groups (Table 3). Compared with HFD-fed mice, improvement in whole body glucose metabolism, among mice fed the HFD with NJ was apparent by improved fasting glucose and HOMA index (Table 3). HOMA-IR was significantly higher (P < 0·05) in HFD-fed mice when compared with control diet-fed mice. Mice fed the HFD+fNJ demonstrated significantly lower HOMA-IR (P < 0·05) when compared with HFD-fed mice, but were higher compared with control diet-fed mice (Table 3). The area under the curve for both glucose and insulin tolerance testd was higher in HFD-fed mice compared with mice fed the control diet, the control diet+fNJ and the HFD+fNJ (Table 3). In HFD-fed mice, glucose intolerance was evident at 30 and 60 min, normalising by 120 min, while insulin intolerance was demonstrated at 0, 30 and 60 min, also normalising by 120 min.
Mice fed the HFD+fNJ demonstrated an improved and normalised glucose and insulin tolerance tests curves and the area under the curve when compared with mice fed the HFD (Fig. 1(A); Table 3).
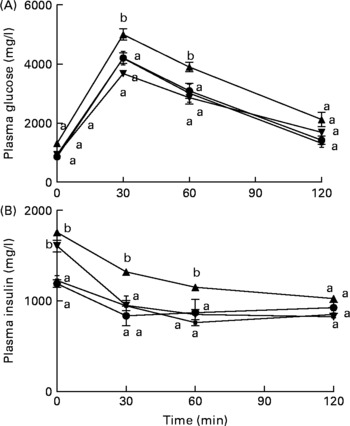
Fig. 1 Effects of fermented noni juice (fNJ) on glucose and insulin tolerance in high-fat diet (HFD)-fed mice. fNJ improves (A) glucose tolerance and (B) insulin tolerance in mice fed a control rodent chow (Con, ![]() ), Con+fNJ (
), Con+fNJ (![]() ), HFD (
), HFD (![]() ) and HFD+fNJ (
) and HFD+fNJ (![]() ) for 12 weeks. Values are means, with standard errors represented by vertical bars (n 6). a,b Mean values of HFD-fed mice with unlike letters were significantly different from those of the control, fNJ and HFD+fNJ groups (P < 0·05).
) for 12 weeks. Values are means, with standard errors represented by vertical bars (n 6). a,b Mean values of HFD-fed mice with unlike letters were significantly different from those of the control, fNJ and HFD+fNJ groups (P < 0·05).
Fermented noni juice improves liver function test in mice fed the high-fat diet
Liver function was unaffected in mice fed the control diet+fNJ when compared with control diet-fed mice (Table 3). Abnormal liver function test in HFD-fed mice was evident by significantly higher (P < 0·05) hepatic aspartate aminotransaminase, alanine aminotransferase and lactate dehydrogenase enzymes when compared with control diet-fed mice. Feeding mice with the HFD+fNJ significantly reduced (P < 0·05) these liver enzymes when compared with those fed only the HFD, but remained elevated above that of control diet-fed mice (Table 3). Similarly, serum aspartate aminotransaminase and alanine aminotransferase were significantly reduced (P < 0·05) in mice fed the control diet+fNJ when compared with mice fed the HFD+fNJ (Table 3) and were comparable with those of control diet-fed mice.
Fermented noni juice lowers hepatic forkhead box O gene expression and gluconeogenic genes in mice fed the high-fat diet
Microarray conducted on liver tissues resulted in a large number of genes altered by feeding of the HFD+fNJ. An independent manuscript is being prepared depicting the global overview of results and categorising significant pathways of metabolic and cellular functions. The primary focus of this manuscript is to investigate the effects of noni on hepatic gluconeogenesis. Therefore, selective relevant glucose-metabolising genes have been depicted in Table 4 that were changed by more than 2·0-fold among mice fed the HFD. Fig. 2 demonstrates the percentage change in representative genes as measured by real-time RT-PCR. The HFD significantly increased FoxO1 mRNA expression by more than 170 and 150 % (P < 0·05), above that of control diet-fed mice and control diet+fNJ-fed mice, respectively (Fig. 2(A)). Interestingly, the mRNA expression of FoxO-downstream gene, PEPCK2, was significantly increased (P < 0·05) by more than 2000 %, in HFD-fed mice when compared with control diet-fed mice and control diet+fNJ-fed mice (Fig. 2(B)), while the mRNA expression of the G6P gene remained unchanged (data not shown). The mRNA expression of FoxO1 and PEPCK genes were normalised in mice fed the HFD+fNJ (Fig. 2(A) and (B), respectively). In contrast, the mRNA expression of glycolytic gene, GCK, was not significantly altered in HFD-fed mice compared with both the control and control+fNJ groups, but was significantly elevated (P < 0·05) in mice fed the HFD+fNJ by more than 100 % above that of all the other groups (Fig. 2(C)). The mRNA expression of the FoxO1 and PEPCK genes in control diet+fNJ-fed mice were comparable with those of control diet-fed mice (Fig. 2(A) and (B)). In contrast, the control diet+fNJ diet significantly elevated GCK gene expression when compared with control diet-fed mice (P < 0·05; Fig. 2(C)).
Table 4 Fold change of glucose-metabolising genes in C57BL/6 mice fed the high-fat diet (HFD) and fermented noni juice (fNJ), analysed by the complementary DNA microarray technique
ND, not detected.
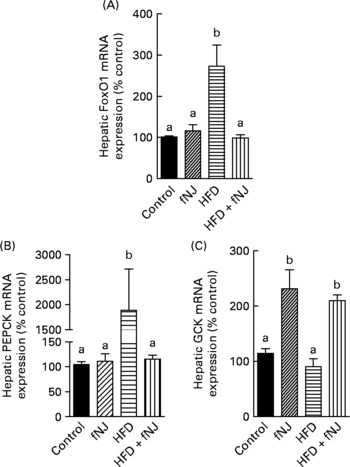
Fig. 2 Effect of fermented noni juice (fNJ) on glucose metabolising genes in high-fat diet (HFD)-fed mice. mRNA expression of (A) hepatic forkhead transcription factor 1 (FoxO1), (B) phosphoenolpyruvate carboxykinase (PEPCK2) and (C) glucokinase (GCK) in mice fed the HFD+fNJ. mRNA expression was quantified by real-time RT-PCR and values are presented as percentage of control values. Values are means, with standard errors represented by vertical bars (n 4). a,b Mean values with unlike letters were significantly different (P < 0·05).
Fermented noni juice increases phosphorylation of nuclear forkhead box O in mice fed the high-fat diet
Regardless of the gene expression, transcriptional activity is also controlled by phosphorylation of the FoxO protein(Reference Aoyama, Daitoku and Fukamizu18, Reference Vogt, Jiang and Aoki22), resulting in nuclear expulsion and inhibition of downstream target genes. Western blot analysis of hepatic cellular extracts demonstrated that the HFD significantly reduced (P < 0·05) the amounts of phosphorylated FoxO1 and increased (P < 0·05) the total FoxO1 protein levels when compared with all the other three groups of mice (Fig. 3(A)). Phosphorylation of hepatic FoxO1 proteins was significantly increased in mice fed the HFD+fNJ when compared with mice fed the HFD (P < 0·05), but were not different from both control diet-fed groups (Fig. 3(B) and (C)).
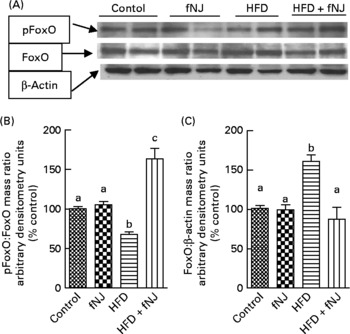
Fig. 3 Effect of fermented noni juice (fNJ) on protein phosphorylation. (A) fNJ lowers tyrosine phosphorylation (pTyr) of hepatic nuclear forkhead transcription factor 1 (FoxO1) in mice fed the high-fat diet (HFD)+fNJ. The bar graphs represent the densitometry scans of (B) pTyr FoxO1 and (C) FoxO1, 95 kDa band intensities. The 42 kDa β-actin band demonstrates equal amounts of protein loaded on the gel. Data are expressed as a percentage of control values, set at 100 %. Values are means, with standard errors represented by vertical bars (n 6). a,b,c Mean values with unlike letters were significantly different (P < 0·05). pFoxO, phosphorylated FoxO.
Fermented noni juice increases phosphorylation of forkhead box O in HepG2 cells
To establish that fNJ-associated effects on FoxO1 are not unique to rodents, we tested the effects of 1·5 and 3 % fNJ on protein phosphorylation and FoxO mRNA expression in human hepatoma cells, HepG2 using a cell-based commercial ELISA and quantitative RT-PCR, respectively. Overall, cells treated with insulin demonstrated a significant increase by 50 % in phosphorylated FoxO1 protein when compared with the control cells (Fig. 4). Treatment with 1·5 or 3 % fNJ for 24 h significantly increased FoxO phosphorylation (P < 0·05), compared with the control cells but was similar to the cells treated with only insulin (P < 0·05) (Fig. 4). Co-treatment of HepG2 cells with 1·5 % fNJ+insulin had no additional benefits since it did not increase FoxO1 phosphorylation or total FoxO above that of the insulin-treated cells. However, addition of 3 % fNJ+insulin significantly lowered total FoxO proteins compared with all the other groups, but phosphorylated FoxO remained unchanged compared with the other groups except the control group (Fig. 4). In contrast to mice studies, both concentrations of fNJ had no significant effect on FoxO1 mRNA expression in HepG2 cells (data not shown).
Fig. 4 Effect of fermented noni juice (fNJ) on forkhead transcription factor 1 (FoxO1) proteins in human hepatoma cells, HepG2. fNJ reduced total FoxO1 (![]() ) protein and increased FoxO1 phosphorylation (
) protein and increased FoxO1 phosphorylation (![]() ) in HepG2 cells treated in the presence and absence of insulin (positive control for FoxO1 phosphorylation). Three independent experiments were conducted in quadruplets. Values are means, with standard errors represented by vertical bars (n 12). a,b,c Mean values with unlike letters were significantly different (P < 0·05). Con, control; Ins, insulin.
) in HepG2 cells treated in the presence and absence of insulin (positive control for FoxO1 phosphorylation). Three independent experiments were conducted in quadruplets. Values are means, with standard errors represented by vertical bars (n 12). a,b,c Mean values with unlike letters were significantly different (P < 0·05). Con, control; Ins, insulin.
Fermented noni juice inhibits mRNA expression of hepatic gluconeogenic enzymes specifically via forkhead box O 1 regulation
The specificity of NJ-associated inhibition of FoxO1 signalling in regulating hepatic gluconeogenesis was determined by the transient knockdown of FoxO1 expression in HepG2 cells using commercial siRNA (Dharmacon, Inc.), according to the manufacturer's instructions. FoxO1 was efficiently knockdown by 80–85 % (P < 0·05) after 48 h of transfection as determined by quantitative RT-PCR (data not shown). The siRNA knockdown of FoxO1 was specific since the siGENOME Non-Targeting siRNA had no effect on FoxO1 mRNA expression determined by quantitative RT-PCR (data not shown). Treatment of HepG2 cells with 1·5 and 3 % fNJ resulted in a modest but significant 33–40 % reduction of PEPCK gene expression (P < 0·05), while the cells treated with FoxO1 siRNA, in the presence or absence of fNJ, demonstrated a significant reduction (P < 0·05) of PEPCK expression by 55–58 % (Fig. 5(A)). Similarly, both concentrations of fNJ significantly reduced (P < 0·05) G6P mRNA gene expression in control HepG2 cells by 50–60 %, but the reduction was more than 72 % in cells treated with FoxO siRNA (Fig. 5(B)). Overall, no dose-dependent effects were observed in the fNJ-treated cells.
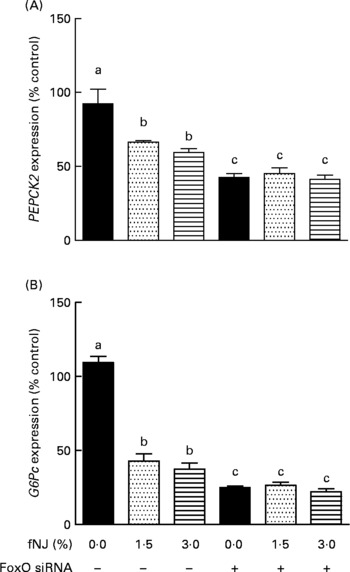
Fig. 5 Effect of fermented noni juice (fNJ) on glucose metabolising genes in human hepatoma cells, HepG2. mRNA expression of human (A) phosphoenolpyruvate carboxykinase 2 (PEPCK2) and (B) glucose-6-phosphatase (G6Pc) genes in HepG2 cells transiently transfected with forkhead transcription factor 1 (FoxO1) small interfering RNA (siRNA). mRNA expression was quantified by real-time RT-PCR and values are presented as percentage of control values. Three independent experiments were conducted in duplicate or triplicate. Values are means, with standard errors represented by vertical bars (n 6–9). a,b,c Mean values with unlike letters were significantly different (P < 0·05).
It was observed that 80–85 % inhibition of FoxO (Fig. 4) resulted in more than 60 and 75 % reduction in PEPCK and G6P mRNA expression, respectively (Fig. 5). However, cells treated with fNJ demonstrated only a 40–50 % reduction in PEPCK and G6P mRNA expression, respectively, which was lower than that observed in FoxO1 siRNA-targeted HepG2 cells. This difference is expected since fNJ reduces FoxO1 protein by 50 % in HepG2 cells and normalises to control levels in HFD-fed mice, and does not completely inhibit FoxO1 (Fig. 4). Our siRNA data indicate that inhibition of PEPCK and G6P expression by fNJ is achieved through FoxO1-dependent and -independent mechanisms. Overall, these data suggest that improvement in glucose metabolism by fNJ is associated with the inhibition of hepatic gluconeogenesis, in part via FoxO1 regulation.
Discussion
We investigated the long-term effects of fNJ prepared from noni fruits on glucose metabolism in mice fed a HFD containing 58 % fat for 12 weeks, the composition of which reflects Western diets, and is known to induce the metabolic syndrome in C57BL/6 mice(Reference Gallou-Kabani, Vige and Gross23). In the present study, the metabolic syndrome phenotype in the HFD-fed mouse model was evident by weight gain, increase in fasting plasma glucose and insulin, as well as glucose and insulin intolerance, which was normalised when the HFD was supplemented with fNJ. We present novel data indicating that fNJ improves hepatic insulin resistance and hyperglycaemia by regulating hepatic transcription factor, FoxO, in mice fed a HFD.
Although earlier studies in HFD-fed mice demonstrated a reduction in blood glucose(Reference Zhang, Patil and Chauhan16), to our knowledge, this is the first study to indicate a possible noni juice-associated mechanism involved in lowering blood glucose and improving HFD-associated hepatic insulin resistance. Epidemiological studies have demonstrated that HOMA-IR is a well-defined biomarker to assess insulin resistance and insulin sensitivity(Reference Haffner, Miettinen and Stern24, Reference Seo, Choi and Jung25) and a possible indicator of hepatic insulin resistance(Reference Bonora, Targher and Alberiche26). In the present study, improvement of HOMA-IR, as well as the glucose and insulin tolerance tests, indicates the ability of fNJ to improve hepatic insulin resistance in mice fed the HFD+fNJ. Mechanistic studies are warranted to not only delineate the effects of fNJ on the hepatic insulin receptor signalling pathway, but also its effects on peripheral insulin resistance.
PEPCK and G6Pc are two important gluconeogenic genes regulated by insulin. Improvement in hepatic gluconeogenesis was evident by a significant reduction in PEPCK mRNA gene expression among mice fed a HFD+fNJ. Besides gluconeogenesis, hepatic glucose utilisation via glycolysis also contributes to maintain plasma glucose levels within physiological limits. Studies in both human subjects and rodents have supported a critical role for GCK in glucose homoeostasis, which is highly expressed in liver and pancreatic β-cells and is known to regulate hepatic glucose metabolism and insulin secretion(Reference Leighton, Atkinson and Coghlan27). GCK catalyses the first step of glycolysis in the liver by converting glucose to G6P. Reduced GCK activity has been linked to abnormal insulin secretion from pancreatic β-cells and glucose tolerance. Earlier studies have demonstrated that hepatic mRNA expression and activity of GCK were increased in HFD-fed wild-type as well as GCK knockout mice(Reference Gorman, Hope and Brownlie28). However, we did not observe any changes in the hepatic GCK mRNA content of HFD-fed mice, possibly due to differences in either the type of diet or the sex of mice used. Regardless, our studies demonstrate that fNJ improves glucose metabolism by increasing glycolysis as evident by the significantly increased GCK mRNA expression in the livers of mice fed the HFD+fNJ. Overall, in our studies, the HFD increased gluconeogenesis but had no effect on glycolysis, while fNJ improved both pathways of glucose metabolism. Studies are warranted on additional glycolytic factors such as glycogen metabolism and peripheral glucose utilisation.
In the liver, metabolic adaptations to nutrient overflow are regulated at the level of gene transcription. In the present study, the reduction of PEPCK mRNA gene expression by fNJ was associated, in part, with the regulation of transcription factor, FoxO1, which is an important upstream regulator of key enzymes involved in glucose metabolism (gluconeogenesis, glycolysis, pentose phosphate shunt)(Reference Zhang, Patil and Chauhan16, Reference Frescas, Valenti and Accili29). Transcriptional activity of FoxO or FoxO function is governed by post-transcriptional modifications such acetylation, ubiquitination and phosphorylation. Insulin can inhibit the transcriptional regulation of glucose metabolising genes (PEPCK, G6Pc and GCK) by phosphorylating FoxO via the Akt/phosphatidylinositol-3-kinase pathway and subsequently translocating it from the nucleus to the cytoplasm(Reference Aoyama, Daitoku and Fukamizu18, Reference Vogt, Jiang and Aoki22, Reference Ganjam, Dimova and Unterman30). Transgenic mice, constitutively overexpressing hepatic FoxO1, demonstrate increased fasting glucose levels despite hyperinsulinaemia and reduced glucose tolerance and insulin sensitivity(Reference Zhang, Patil and Chauhan16). Similarly, in the present study, we observed an increase in FoxO function in HFD-fed mice in the presence of hyperinsulinaemia, which can be an additional contributing factor towards insulin intolerance. In contrast, inhibition of FoxO1 was associated with improved fasting glucose levels in db/db diabetic mice(Reference Altomonte, Richter and Harbaran31). Altomonte et al. (Reference Altomonte, Richter and Harbaran31) elegantly demonstrated that mutant FoxO1 vector, FoxO1-Δ256, interfered with FoxO1 function in the liver by inhibiting the binding of FoxO1 to the promoter of its target genes such as PEPCK and G6P and reducing gluconeogenesis.
A recent study has elegantly demonstrated that the Chinese herb berberine simultaneously reduced FoxO mRNA expression that correlates with the demonstrated reduction in nuclear and cytoplasmic phosphorylated FoxO and total FoxO in diabetic mice treated with berberine when compared with diabetic mice(Reference Xia, Yan and Shen32). Although we did not compare the nuclear and cytoplasmic distribution of phospho- and total-FoxO protein levels, the fact that fNJ reduces or normalises FoxO mRNA expression and the protein levels indicates a reduction in FoxO function. The regulation of glucose metabolism by the fNJ-associated inhibition of FoxO1 was further confirmed through the transient knockdown of FoxO1 in HepG2 cells, which demonstrated a concomitant reduction of PEPCK and G6PC, similar to that observed in our mice studies. Overall, the present results support the concept that fNJ regulates glucose metabolism by suppressing FoxO function to regulate genes involved in promoting hepatic gluconeogenic and glycolytic enzymes as well as liver TAG and plasma glucose in mice fed the HFD+fNJ. It is possible that fNJ regulates FoxO1 mRNA levels by inhibiting its upstream regulators such as histone deacetylase 1 in the liver(Reference Oiso, Furukawa and Suefuji33).
Similar to the present findings, previous studies have demonstrated that fNJ attenuated hyperglycaemia in streptozotocin-induced diabetic rats receiving fNJ in drinking-water for 10 d (100 ml/kg body weight)(Reference Nayak, Isitor and Maxwell11). A study by Horsfall et al. (Reference Horsfall, Olabiyi and Aiyegbusi13) demonstrated the synergistic effect of fNJ on insulin to improve alloxan-induced hyperglycaemia in diabetic rats after 4 weeks of treatment. Furthermore, studies by Soon et al. (Reference Soon and Tan12) and Kamiya et al. (Reference Kamiya, Hamabe and Harada10) demonstrated that organic solvent extract from the roots of M. officinalis and M. citrifolia (noni) reduced fasting serum glucose in streptozotocin-induced diabetic animals, 3 h after administration. Interestingly, Soon et al. (Reference Soon and Tan12) also observed that noni root extract increased fasting glucose levels in control rats(Reference Soon and Tan12), which is in contrast to the present study, where we do not observe any hyperglycaemic effects of fNJ when fed to control mice. The differences could be due to the different noni extracts (root extract v. fruit juice) and experimental conditions in the two studies. However, none of the previous studies delineated the mechanisms by which fNJ restored glucose homeostasis(Reference Kamiya, Hamabe and Harada10–Reference Horsfall, Olabiyi and Aiyegbusi13).
Our data also demonstrate that fNJ reduced weight gain in mice fed the HFD+fNJ when compared with control diet-fed mice. Previous studies were unable to demonstrate any effect of whole NJ on body weight or lipid metabolism possibly due to the shorter duration of the NJ treatment ranging from few hours to 4 weeks after induction of diabetes, or differences in methods of preparation or differences in parts of noni plant used in these experiments(Reference Kamiya, Hamabe and Harada10–Reference Horsfall, Olabiyi and Aiyegbusi13). In contrast, Mandukhail et al. (Reference Mandukhail, Aziz and Gilani34) demonstrated that commercial, 70 % aqueous ethanolic extracts of noni fruit, leaf and roots were able to reduce hyperlipidaemia, fasting glucose and body-weight gain in rats fed a HFD.
NJ contains numerous chemicals including saponins, triterpenes, flavanoids, coumarins and iridoids(Reference Nayak, Marshall and Isitor35–Reference Potterat and Hamburger37). Similarly, besides scopoletin, we were able to detect quercetin as well as anthocyanin, cyanidin-3-O-rutinoside, in methanolic extracts of fNJ using HPLC (data not shown). Both, quercetin and anthocyanin are known to improve hyperglycaemia in animal models(Reference Kampkotter, Nkwonkam and Zurawski38, Reference Takikawa, Inoue and Horio39). Interestingly, quercetin has recently been demonstrated to inhibit stress via FoxO regulation in Caenorhabditis elegans (Reference Kampkotter, Nkwonkam and Zurawski38, Reference Kampkotter, Timpel and Zurawski40). It is therefore possible that anti-diabetic properties of fNJ in our studies are in part associated with flavanoids such as quercetin and anthocyanin. Currently, there are no established doses for human consumption of NJ, which is a mixture of anthraquinones, organic acids, xeronine, flavanoids, Fe, Ca, K as well as vitamins, such as β-carotene, niacin, riboflavin and thiamin. Future studies are warranted to determine physiologically relevant doses of fNJ and to delineate the active components of noni that regulate glucose and lipid metabolism. Furthermore, exact combination of compounds in NJ requires further elucidation to determine its beneficial properties.
Conclusions
Overall, the present study indicates that fNJ supplementation improves plasma glucose levels in HFD-fed mice by modulating hepatic gene expression of gluconeogenic and glycolytic enzymes via FoxO1 phosphorylation. Diabetes represents one of the world's greatest health care challenges not only due to the rising incidence, but also the ever-increasing health care costs. Although fNJ can form a complementary treatment initially, complete characterisation of the active compounds may lead to novel treatments for diabetes. Advances in identifying alternative and affordable sources of treatment options, such as noni, can help to reduce health disparities in culturally sensitive populations as well as to reduce health care costs and offer a low-cost alternative specifically in the developing countries where general allopathic medicine is beyond the financial reach of low-income populations.
Acknowledgements
This study was supported partly by grants from the USDA–CREES (2004-34135-15182) and the National Center for Complementary and Alternative Medicine (R21AT003719), the National Center for Minority Health Disparity (P20MD000173), and Research Centers in Minority Institutions Program, National Center for Research Resources (G12RR003061), National Institutes of Health. We thank Dr Will McClatchey (Professor, Department of Botany, University of Hawaii) for identifying the noni specimens, voucher preparation and deposition into the herbarium. P. V. N. conceived and designed the study as well as analysed and interpreted the data, and wrote the manuscript. A. N., P. O. E., L. M. J. and E. V. performed the experiments for data acquisition. V. R. N. was involved in the data analysis and critically revising the manuscript for important intellectual content. P. V. N. has primary responsibility for the final content. Partial data were presented as a poster at the April 2010 ASBMB Annual meeting. All authors read and approved the final version of the manuscript. All the authors declare that they do not have any competing interests.


