


1. Introduction
Glaciers are freshwater reservoirs and store water in the form of snow and ice over different timescales. Mountain glaciers make a significant contribution to the current rate of sea-level rise (Dyurgerov and Meier, Reference Dyurgerov and Meier1997; Gardner and others, Reference Gardner2013; Zemp and others, Reference Zemp2019). The glaciers are highly sensitive to the meteorological parameters; therefore, glaciers are visually and quantitatively, one of the most reliable indicators of climate change (Huss and Fischer, Reference Huss and Fischer2016).
The meltwater from the snow and glaciers of the Hindu-Kush Himalayan (HKH) region is the main water resource for the downstream regions (Immerzeel and others, Reference Immerzeel, van Beek and Bierkens2010). These water resources sustain millions of people socially as well as economically. The western Himalayan regions are highly dependent on the snow and glacier melt during the dry seasons (Armstrong and others, Reference Armstrong2018; Pritchard, Reference Pritchard2019). Therefore, understanding the changes of snow and glaciers and their impacts on the social and economic structure has become essential.
The Himalayan region comprises a large area with diverse terrain and distinct climate regimes, which has one of the largest concentrations of glaciers outside the Earth's polar region. Monitoring and understanding of the Himalayan glaciers have been improved in the recent past (Pratap and others, Reference Pratap, Dobhal, Bhambri, Mehta and Tewari2016; Azam and others, Reference Azam2018). However, due to a large number of glaciers with distinct glacier responses, it has become necessary to investigate glacier changes across the Himalaya.
Glacier mass balance is determined by various methods such as glaciological (field-based), geodetic (field/remotely sensed) and glacier melt modelling (physical-based). However, to measure the glacier-wide annual mass balance, the glaciological method is the classical approach (Cuffey and Paterson, Reference Cuffey and Paterson2010). The monitoring of seasonal mass balance helps in assessing the accumulation and ablation processes at the glacier surface (Dyurgerov and Meier, Reference Dyurgerov and Meier1999; Thibert and others, Reference Thibert, Eckert and Vincent2013). The estimation of winter (B w) and summer mass balance (B s) can closely relate to the inter-annual changes in the meteorological conditions (Cogley and others, Reference Cogley2011; Wagnon and others, Reference Wagnon2013). However, most of the glaciological mass-balance studies in the Himalaya are focused on annual mass balance (B a) (e.g. Dobhal and others, Reference Dobhal, Mehta and Srivastava2013; Sherpa and others, Reference Sherpa2017; Acharya and others, Reference Acharya and Kayastha2018; Soheb and others, Reference Soheb2020).
Long-term observations of the glacier mass balance around the world show a negative trend between 1961 and 2016 (Zemp and others, Reference Zemp2019). Field-based measurements and remotely sensed studies show a negative mass balance all over the Himalayan region (Brun and others, Reference Brun, Berthier, Wagnon, Kääb and Treichler2017; Azam and others, Reference Azam2018; Bolch and others, Reference Bolch, Wester, Mishra, Mukherji and Shrestha2019) with an exception in the Karakoram region where glaciers are in a nearly balanced state (Bhambri and others, Reference Bhambri2013; Bolch and others, Reference Bolch, Pieczonka, Mukherjee and Shea2017; Farinotti and others, Reference Farinotti, Immerzeel, de Kok, Quincey and Dehecq2020). However, the observed mass loss was heterogeneous across the Himalaya, with variation over regional to local scales (Brun and others, Reference Brun, Berthier, Wagnon, Kääb and Treichler2017; Shean and others, Reference Shean2020). The glacier mass loss after 2000 for the HKH region shows a higher mass-loss rate in the western and eastern Himalaya (−0.6 m w.e. a−1) compared to central Himalaya (−0.4 m w.e. a−1) (Bolch and others, Reference Bolch, Wester, Mishra, Mukherji and Shrestha2019). Maurer and others (Reference Maurer, Schaefer, Rupper and Corley2019) observed an increased mass loss in the past two decades with an exceptional increased rate (factor of 3) in the Lahaul-Spiti region. Some of the studies show that spatial variation in glacier mass balance in the high-mountain Asian region is dependent on the sensitivity of the regional climate (Wang and others, Reference Wang, Liu, Shangguan, Radić and Zhang2019) as well as on the glacier geomorphology (Brun and others, Reference Brun2019). However, this spatially and temporally heterogeneous pattern of mass loss is not fully understood so far. Therefore, analysis of seasonal mass-balance components along with micro-climate could reveal the glacier characteristics and behaviours. Furthermore, it will help to understand the present state as well as the factors which govern the mass balance of the glaciers (Wagnon and others, Reference Wagnon2013; Brun and others, Reference Brun, Berthier, Wagnon, Kääb and Treichler2017; Sakai and Fujita, Reference Sakai and Fujita2017).
In this study, we investigated Patsio Glacier which is in the Bhaga basin of the Lahaul-Spiti region located near the Baralacha Pass of the Great Himalayan range. This study presents the field-based B a and B w for Patsio Glacier between 2010 and 2017. We also analysed the interrelationship between winter accumulation and B a. Furthermore, we studied the role of non-climatic parameters that govern the glacier-wide mass balance.
2. Study area
Patsio Glacier is a small valley-type glacier with an area of 2.25 km2, located with an altitude range of 4875–5718 m a.s.l. (Fig. 1). The glacier lies in the Lahaul-Spiti region of Himachal Pradesh, India. Lahaul-Spiti region falls in the monsoon-arid transition zone where the precipitation is influenced by Western Disturbances (WDs) in winter and Indian Summer Monsoon (ISM) in summer (Bookhagen and others, Reference Bookhagen, Thiede and Strecker2005). Patsio Glacier is fed by three tributaries. Two are located on the eastern flank (tributaries A and B) and one on the western flank (tributary C) of the glacier (Fig. 1). The orientation of the main glacier trunk is northeast (NE) in the ablation area. However, the orientations of tributaries A and B are almost towards northwest, and tributary C is oriented almost towards the east. Tributaries A and B cover the larger area (~45% of the total glacier area) in comparison with tributary C (~12%). The glacier has a wide valley of ~2 km at higher altitudes and gets narrower to <0.5 km with decreasing altitude. At the terminus, it is only ~300–400 m wide, and the frontal part is vertically steep. The average slope of the glacier is 14° (Kumar and others, Reference Kumar2018). At the lower altitude, the glacier is separated by a large-medial moraine (Fig. 1). Two medial moraines exist, one with a thin-small length located at the convergence of tributary C with the main glacier trunk, which later forms the part of the lateral moraine (Fig. 1). The main-medial moraine originates from ~5270 m a.s.l. Further down, it covers a large area around the glacier terminus. The length of the main-medial moraine is ~1.41 km and covers an area of ~0.12 km2.

Fig. 1. Geographical location of Patsio and Chhota Shigri glaciers in Lahaul-Spiti, and Stok Glacier in Ladakh, India. Debris-covered area, ablation, accumulation and meteorological measurement sites are also shown.
Meltwater from the glacier drains from two pro-glacial channels which coalesce and forms a single channel before joining the Bhaga river which is a tributary of the Chenab (Indus) river. The total glacier covered by debris including the main-medial moraine is ~0.29 km2, corresponding to ~12% of the total glacier area. A small piece of dead ice with a length of ~110 m was located ~500 m below the terminus (Negi and others, Reference Negi, Saravana and Rout2013). A series of glacier depressions formed at the higher altitudes of the ablation zone between 5200 and 5250 m a.s.l. During the early ablation season, meltwater gets stored in these depressions, which act as a supra-glacial pond at the early ablation season and finally drains out at the peak ablation season through a series of meltwater channels. Table 1 and Figure 1 give the general, topographic and climate information of Patsio Glacier.
Table 1. Characteristics and general information of Patsio Glacier

ELA0 and AAR0 are the calculated balanced budget ELA and AAR values, respectively.
a IMD = Indian Meteorological Department.
Preliminary studies mainly by remote sensing show a retreat of Patsio Glacier with an annual average frontal retreat of ~22 m a−1 between 1971 and 2011 (Negi and others, Reference Negi, Saravana and Rout2013). Geodetic analysis based on satellite images shows a thinning of −0.31 ± 0.13 m a−1 between 2005 and 2013 (Kumar and others, Reference Kumar2018). Similarly, the average glacier velocity between 2014 and 2015 using the Landsat images was found to be ~5 m a−1 (Singh and others, Reference Singh2018). Meteorological observations recorded for the period 1991–2010 at Snow and Avalanche Studies Establishment (SASE) Patsio station which is 7 km away from Patsio Glacier observed a decreasing trend in winter albedo and snowfall days, also increasing trend in winter temperature (Dimri and Dash, Reference Dimri and Dash2012; Negi and others, Reference Negi2017).
3. Method and data
3.1 Mass-balance methodology
A series of field campaigns were conducted on Patsio Glacier since the year 2010, and glacier-wide mass balance was measured using the traditional glaciological method (Kaser and others, Reference Kaser, Fountain and Jansson2003; Cuffey and Paterson, Reference Cuffey and Paterson2010). The ablation was measured using bamboo stakes inserted into the ice surface up to 8–10 m, distributed across the ablation zone (Fig. 1). In the accumulation zone, snow core, pits and depths were measured using manual auger drills (snow corer), digging manually and snow probe respectively (Fig. 1). Mass balance was calculated for each 50 m altitude band and the glacier-wide mass balance (B) was calculated using Eqn (1) (Cuffey and Paterson, Reference Cuffey and Paterson2010):

where bi is the mass balance of the altitudinal range i (m w.e. a−1), of area si, and S is the total area of the glacier. For each altitudinal range, bi is obtained from the corresponding stake readings or net accumulation measurements.
Conversion to w.e. was made by taking the density of ice as constant 900 kg m–3, and snow density from snow cores and pits measurements.
3.1.1 Annual glacier-wide mass balance
For calculation of B a, a hydrological year is defined from 1 October to 30 September of the following year for western Himalayan glaciers (Raina and others, Reference Raina, Kaul and Singh1977; Azam and others, Reference Azam2016). Measurements of B a were usually carried out at the end of September or the beginning of October based on the climatic conditions and human resources. In the year 2010, seven stakes were installed on Patsio Glacier surface between 4900 and 5200 m a.s.l. Later in 2012, ten more stakes were installed; seven of them were installed close (~10–30 m) to the previous stakes and three at higher altitudes (5200–5300 m a.s.l.). In 2013, four stakes were installed on the debris zone of the glacier to get a better representation of the ablation zone. Furthermore, in 2016, four more stakes were installed at different locations, two at the upper zone (>5300 m a.s.l.) of tributary C and two at lower altitudes (Fig. 1). For the calculation of B a, minimum stake measurements were seven in 2010/11 and a maximum of 22 in 2013/14. Missing bi at the ablation zone was obtained by using a single linear fit to all available stake measurements. Annual point accumulation measurement was performed on tributary A, mostly ~5375 m a.s.l. (Fig. 1). However, in the years 2014, 2015 and 2017, snow core measurements were not possible due to heavy snowfall during fieldworks. Therefore, instead of snow core, snow pit and snow depths were measured (Table S1, Supplementary material). The missing snow density for annual accumulation measurement for the years 2014 and 2017 was assumed to be the mean of all available years. Azam and others (Reference Azam2016) have observed relatively less variability in snow density than that of snow depth at Chhota Shigri Glacier during the end of ablation season. Accumulation measured at ~5375 m a.s.l. at the end of September or early October was considered as the net accumulation for higher altitudes. Measurement dates, the number of stakes and snow core/pit/probing sites with respective altitudes are presented in Table S1. Also, some of the challenges related to accumulation measurements are described in the Supplementary material under section 1. Equilibrium-line altitude (ELA) for each year was calculated based on annual point mass-balance measurements (excluding the debris-covered area and tributary C) between 5100 and 5400 m a.s.l. by applying a linear regression (Fig. 2). Accumulation-area ratio (AAR) was calculated using the ELA of the corresponding year following Mandal and others (Reference Mandal2020). The annual ELA was calculated excluding the mass-balance values of tributary C due to the following reasons: (a) total area covered by tributary C is small (~12%) compared to the eastern (~45%) and (b) mass-balance measurements were limited to tributary C.
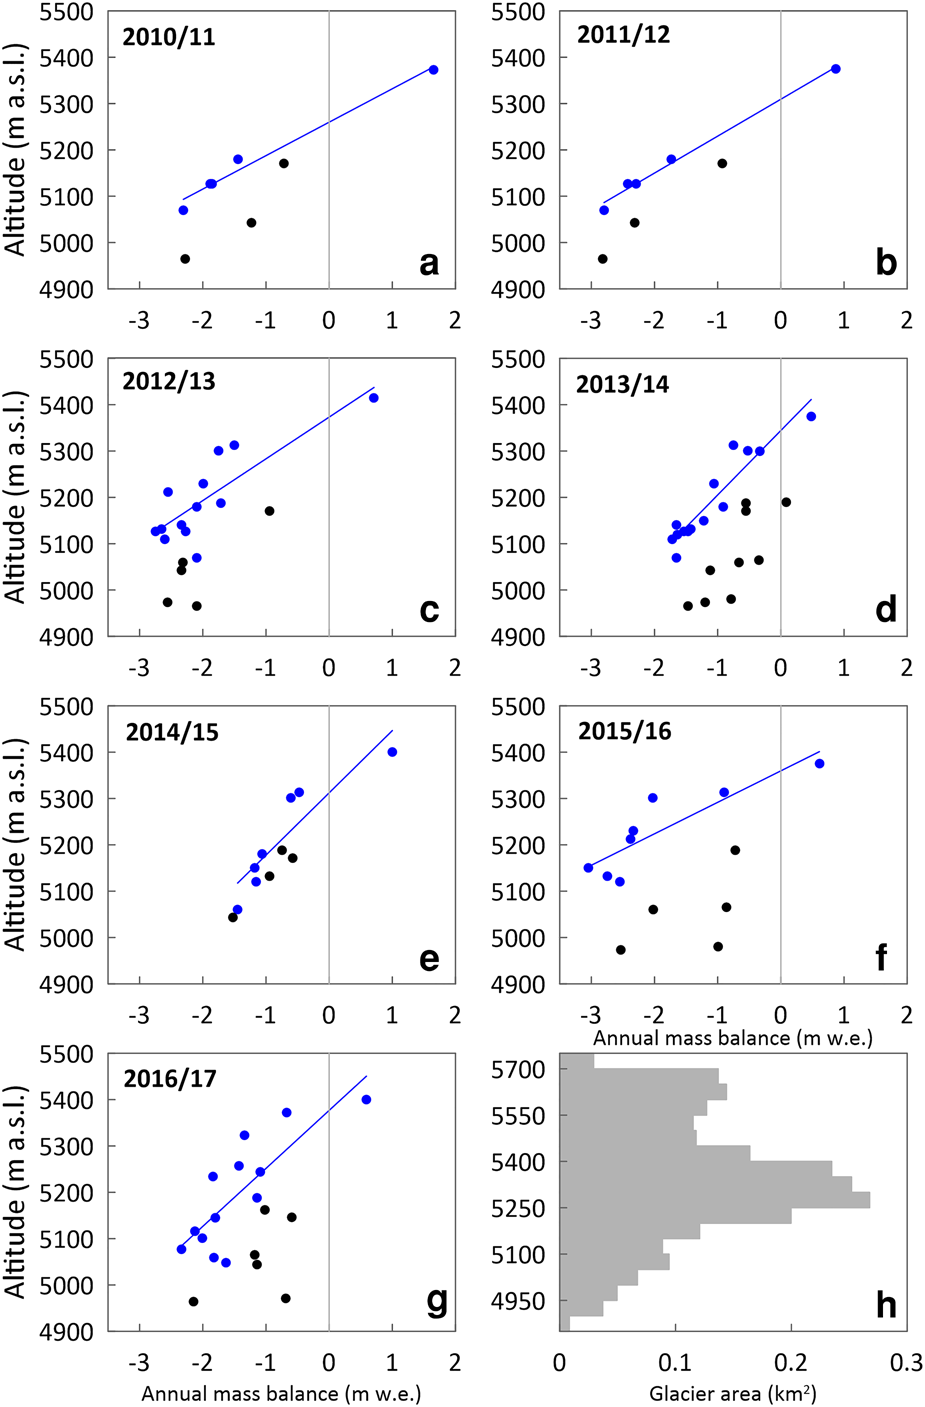
Fig. 2. Annual point mass balance (dots; panels a–g) as a function of altitude derived from field measurements (stakes, snow cores or pits) on Patsio Glacier between 2010 and 2017. Black dots represent the stakes over the debris/shadow area. Linear regression lines between 5100 and 5400 m a.s.l (excluding debris-covered area and tributary C) were used to compute the ELA. Hypsometry (50 m altitude bands) of Patsio Glacier is also shown (h).
3.1.2 Winter/summer glacier-wide mass balance
Avoiding the harsh climate and accessibility, which are the main hindrances of field observation in the Himalayan region, B w measurements were carried out in late May or early June for the period 2012–17. For B w, snow core was measured at higher altitudes (5200–5400 m a.s.l.) and snow pit and depths at lower altitudes (4900–5200 m a.s.l.). At least one core/pit was measured throughout the study period. Also, from 2013 onwards an additional snow core was measured at a lower altitude (~5220 m a.s.l.). In 2017, three snow cores were measured to check the distribution and accuracy of the data (Fig. 1). Detailed information is provided in the Supplementary material (Table S1). A minimum of eight (2015) and a maximum of 28 (2017) snow depth measurements were carried out throughout the study period (Table S1). Snow depths were measured manually with the help of a snow probe which was inserted inside the snowpack until it contacted the glacier surface. The point snow depth measurements were obtained by averaging three to six individual measurements almost within a radius of ~5–10 m. Snow density was measured by digging a snow pit and extracting snow cores (Cogley and others, Reference Cogley2011) (Fig. S1b). An averaged density was then used to convert snow depth readings into mass estimates (Kaser and others, Reference Kaser, Fountain and Jansson2003).
The summer glacier-wide mass balance (B s) was obtained after subtracting the winter mass balance (B w) from the annual mass balance (B a).
3.2 Other datasets
We measured the stake locations with the help of a handheld GPS device (Garmin 76CSx) during most field campaigns. In 2016 and 2017, we performed the differential GPS (DGPS) survey (Leica Viva GS14) on the glacier surface using a kinematic mode relative to a fixed reference point (32.77° N, 77.34° E; 4848 m a.s.l.) just below the snout on a firm rock.
Debris thickness was measured in 2014 at two different horizontal profiles at ~4900 and ~5000 m a.s.l. excluding the big boulders (Fig. S2). We measured debris thickness at nine different sites by manually digging through the debris to the glacier ice surface. The height of the debris was measured with the help of a measuring tape. However, the measurement sites were randomly selected in a horizontal line keeping the minimum and the maximum distances of 3 to 10 m, respectively.
The glacier boundary was manually digitised with the help of Landsat 8 image (30 m resolution, acquired on 30 August 2015) downloaded from USGS (http://earthexplorer.usgs.gov) and a PlanetScope satellite image (3 m resolution; acquired on 1 September 2018) (Planet Labs; https://www.planet.com). Glacier topography and altitude bands are obtained from Shuttle Radar Topography Mission (SRTM) data (USGS). Monthly precipitation data for Lahaul-Spiti district were obtained from IMD, Shimla (http://weathershimla.nic.in/). The precipitation data are the arithmetic mean of precipitations observed from stations in Lahaul-Spiti district. Additional air temperature data were used from the automatic weather station (AWS) (4863 m a.s.l.) located at Chhota Shigri Glacier (~55 km away) (Mandal and others, Reference Mandal2020). More information is provided in the Supplementary material (see Sections 1 and 2).
3.3 Uncertainty analysis
The various error sources are associated with glaciological mass-balance measurements, such as (1) point ablation and accumulation measurements and (2) interpolation and extrapolation of point measurements to the respective altitudinal bands (Thibert and others, Reference Thibert, Blanc, Vincent and Eckert2008; Sold and others, Reference Sold2016). Uncertainty related to point ablation measurements is generally comes from stake height determination and representation of the stakes for the particular altitudinal band. Our point annual ablation measurements at similar location and altitude excluding the debris-covered area show a B a difference of 0.01–0.17 m w.e. Therefore, we considered this as the stake representative error (σ stake) and estimated the ablation error (σ abb). In the accumulation zone, one of the main possible errors is the contribution of avalanches from the steep vertical sidewalls especially in the Himalayan glaciers (Laha and others, Reference Laha2017). Patsio Glacier has minimum snow/ice-free headwalls, and the winter accumulation measurements show low spatial variability at higher altitudes (5200–5400 m a.s.l.; Fig. 5). Also, errors in accumulation measurements could be due to snow depth and density measurements. To assess the uncertainty in accumulation measurements, we followed the method adopted by Kenzhebaev and others (Reference Kenzhebaev2017) (σ acc): (1) by assuming a linear increase in accumulation at higher altitudes, (2) constant measured accumulation values for accumulation zone and (3) inverse gradient in the highest two altitude bands. For a linear increase in accumulation, we used the accumulation gradient of 0.22 m w.e. (100 m)−1 measured at Chhota Shigri Glacier between 2002 and 2014 (Azam and others, Reference Azam2016). Finally, the uncertainty in accumulation measurements (σ acc) was obtained after taking the mean of standard deviation (SD) from all three approaches. Overall, mean annual glacier-wide mass-balance uncertainty (σ Ba; Eqn (2)) obtained after considering all the measurement errors is found to be ±0.37 m w.e. a−1. The expression for σ Ba is as follows:

Uncertainty analysis for glacier-wide B w (σ Ba) was performed based on density and snow depth variations following Thibert and others (Reference Thibert, Blanc, Vincent and Eckert2008). The uncertainty obtained for B w measurement was ±0.21 m w.e. a−1. Uncertainty of the individual Himalayan glaciers using the glaciological method varies between ±0.27 and ±0.53 m w.e. (e.g. Azam and others, Reference Azam2012; Wagnon and others, Reference Wagnon2013; Acharya and others, Reference Acharya and Kayastha2018; Sunako and others, Reference Sunako, Fujita, Sakai and Kayastha2019; Soheb and others, Reference Soheb2020) which is in agreement with our estimate.
4. Results
4.1 Annual point mass-balance profile
The annual point mass balance as a function of altitude for seven hydrological years (2010/11 to 2016/17) is presented in Figures 2a–g. The hypsometry (50 m bands) of Patsio Glacier is shown in Figure 2h. Annual point mass-balance measurements show that glacier surface conditions play an important role in annual ablation. The debris-covered area experienced ablation with an annual average value varying from −2.17 to −0.72 m w.e. The horizontal profile measurement of debris thickness at ~4900 and ~5000 m a.s.l. varies from 1 to ~13 cm (Fig. S2). However, the spatial distribution of the debris thickness on the glacier surface varies vertically as well as horizontally. Debris thickness around the stake located at 4980 m a.s.l. was higher (~20 cm) and has observed less ablation compared to the stake installed at 4970 m a.s.l. (<8 cm; Fig. S3). The mean ablation difference between the two stakes installed at ~4980 and 4970 m a.s.l was ~−1.25 m w.e. mainly due to the difference in debris thickness. Accumulation measured at ~5375 m a.s.l. was lowest in 2013/14 (0.48 m w.e.) and highest in 2010/11 (1.65 m w.e.) (Fig. 2).
4.2 Annual and winter vertical mass-balance gradients (db/dz)
Vertical ablation gradient (db/dz abl) was calculated between 5100 and 5350 m a.s.l. excluding the debris-covered area for each hydrological year (Fig. 2, Table 2). However, for the hydrological years 2010/11 and 2011/12, db/dz abl was calculated using all the available stake measurements due to the limited number of stakes. A minimum db/dz abl of 0.34 m w.e. (100 m)−1 and a maximum of 0.67 m w.e. (100 m)−1 was observed in 2014/15 and 2015/16, respectively. Winter mass-balance gradient (db/dzB w) was obtained using the point snow depth, pit and core measurements between 4900 and 5400 m a.s.l. (Fig. 5, Table 2). db/dzB w was consistently low throughout the study period with an SD of ±0.09 m w.e. (100 m)−1. The shallow db/dzB w indicates the low vertical spatial variability of snow on the glacier surface during the winter period.
Table 2. B a, B w (m w.e.), ELA (m a.s.l.), AAR (%) and db/dz (m w.e. (100 m)−1) for Patsio Glacier between 2010 and 2017

db/dz abl and db/dzB w stand for mass-balance gradient for ablation zone (5100–5350 m a.s.l.; debris-free area) and winter mass balance (4900–5400 m a.s.l.). Mean, SD, maximum (Max.) and minimum (Min.) are also displayed for every variable. B w OK is winter mass balance calculated using ordinary kriging (spherical).
a db/dz abl was calculated based on all the available stakes (4950–5200).
4.3 Annual and cumulative glacier-wide mass balance
The B a of Patsio Glacier for the period 2010–17 is presented in Table 2. Figure 3 shows the B a, B w and cumulative mass balance. Interannual mass-balance variability was moderate with an SD of ±0.32 m w.e. Mean and cumulative B a was −0.34 m w.e. and −2.35 m w.e., respectively for the period 2010–2017. Two slightly positive B a years were observed in 2010/11 (B a = 0.08 m w.e.) and 2014/15 (B a = 0.07 m w.e.). For other years, B a was negative, ranging from −0.68 to −0.25 m w.e. in 2015/16 and 2013/14, respectively.
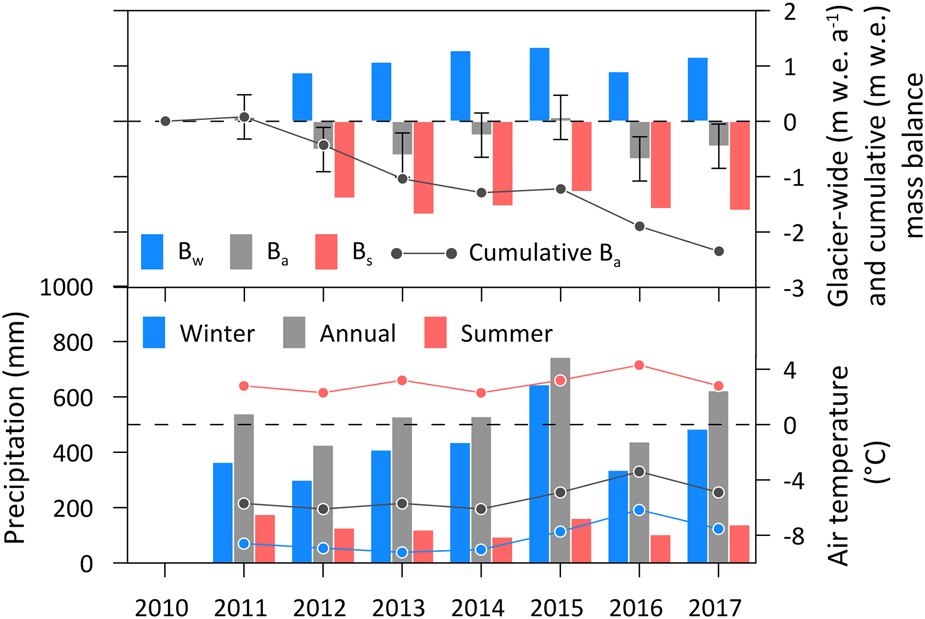
Fig. 3. Annual (B a), winter (B w), summer (B s) and cumulative mass balance of Patsio Glacier between 2010 and 2017 are shown by grey, blue, pink histograms and grey line scatter for cumulative respectively. Annual, winter and summer precipitation of Lahaul-Spiti district of Himachal Pradesh are represented by grey, blue and pink histograms, respectively (obtained from IMD, Shimla; Section 3.2). The annual, winter and summer mean temperatures in grey, blue and pink line scatters respectively obtained from AWS installed at Chhota Shigri Glacier at 4863 m a.s.l.
4.4 ELA and AAR
Calculated ELA and AAR of Patsio Glacier between 2010 and 2017 are given in Table 2. ELA and AAR are directly related to B a. Both ELA and AAR showed a positive correlation with B a between 2010 and 2017 (r = 0.97 and 0.98 for ELA and AAR respectively; Fig. 4). Minimum ELA was 5289 m a.s.l. in 2010/11 (B a = 0.08 m w.e.) and maximum was 5366 m a.s.l. in 2012/13 (B a = −0.61 m w.e.).

Fig. 4. ELA and AAR as a function of B a of Patsio Glacier.
4.5 Winter mass balance (B w)
The B w was positive throughout the study period with a minimum of 0.88 m w.e. in 2011/12 to a maximum of 1.34 m w.e. in 2014/15 (Table 2 and Fig. 3). Mean B w of Patsio Glacier is 1.11 m w.e. a−1 over 2011/12 to 2016/17 (6 years) with a cumulative B w of 6.63 m w.e. Interannual variability of B w was low with an SD of ±0.19 m w.e. a−1 compared to an SD of B a: ±0.32 m w.e. a−1. The mean vertical gradient of winter mass balance (db/dzB w) was 0.21 m w.e. (100 m)−1 during the study period with a maximum value of 0.36 m w.e. (100 m)−1 in 2016/17 and a minimum of 0.12 m w.e. (100 m)−1 in 2013/14. The point B w measurements are shown in Figure 5. The mean density of winter snowpack, an average of all available measurements at different altitudes, varying from 410 to 550 kg m−3, corresponding to a mean of 510 kg m−3 (n = 16). At times, thin hard layers at various depths of snowpack were observed (Fig. S1b). The hard layers indicate the refreezing of the snow at various depths.
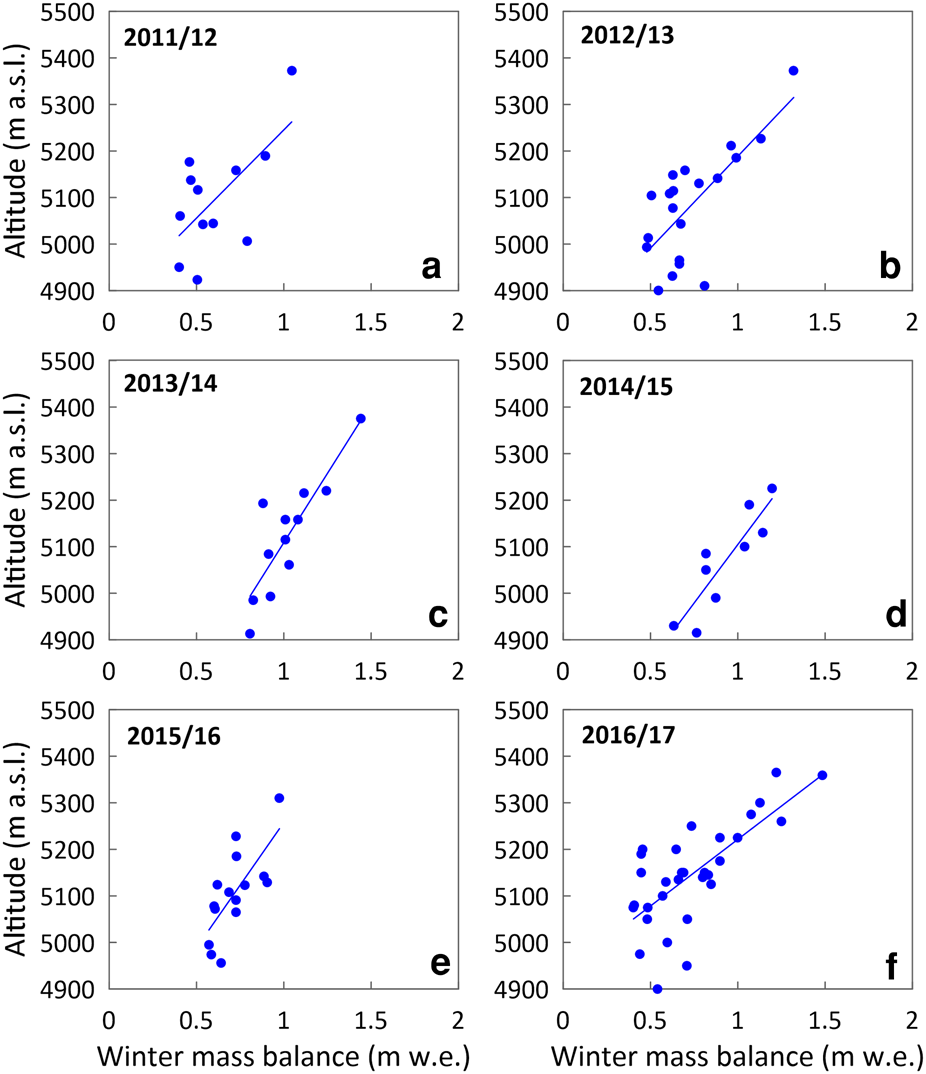
Fig. 5. Winter point mass balance (dots; panels a–f) as a function of altitude derived from field measurements (snow depths, pits and cores) on Patsio Glacier between 2012 and 2017.
5. Discussion
5.1 Role of debris cover and topography on the mass balance
Annual point mass balance measured at the lower ablation zone (Fig. 2) was systematically reduced by 0.5–1.5 m w.e. a−1 compared to other parts of the ablation zone irrespective of their altitudes. This difference in surface melting is mainly due to the presence of debris at the lower parts of the glacier, which efficiently protects the glacier from melting (Wagnon and others, Reference Wagnon2007; Banerjee and Shankar, Reference Banerjee and Shankar2013). The debris measurement at two different altitudes ~4900 and ~5000 m a.s.l. show non-uniformity (Fig. S2). This difference in debris thickness has induced spatial variation in point mass balance at the debris-covered area (Fig. 2). Besides, the steep slope and surrounding narrow valley probably provide abundant debris onto the lower part of the glacier along with the shading effect, which acts as an insulator and reduced ice-melt (Wagnon and others, Reference Wagnon2013). Stakes installed at ~5175 m a.s.l. experienced less ablation (−0.74 m w.e.) compared to the stakes installed ~5200 m a.s.l. (−1.34 m w.e.). The glacier surface at ~5175 m a.s.l. is also covered by debris, and oriented towards the NE, receiving less solar radiation. Also, snow depth measured during B w measurements was higher around the stake located at ~5175 m a.s.l. compared to stakes installed ~5200 m a.s.l. In 2013/14, the annual point mass balance measured at ~5175 m a.s.l. was slightly positive (Fig. 2d). Simultaneously, the point annual ablations measured for the year 2013/14 were low compared to other years (Fig. 2), which corresponds with the low summer temperature recorded at Chhota Shigri Glacier (Table S2).
In August 2016, two stakes were installed on tributary C (~5360 m a.s.l.) of Patsio Glacier. In 2016/17, negative point mass balance was measured at those two stakes whereas positive point mass balance was measured (snow core) on tributary A at a similar altitude (~5375 m a.s.l.). B w measurements in 2016/17 show similar snow depths on two different tributaries (A and C). The difference in B w measurements at two different tributaries was only 0.25 m w.e., which suggest winter snow accumulations on tributaries A and C were almost uniform. Hence, the differences in the B a measurements at the two different tributaries (A and C) were mainly due to differences in summer mass balance which is the main ablation period in this region (Pratap and others, Reference Pratap2019; Mandal and others, Reference Mandal2020). The annual ablation measured at similar altitudes of the main glacier trunk showed uniform melting except at debris-covered areas because of the difference in debris thickness (Fig. S4). Therefore, the probable reason for such a difference in B a at the two tributaries is their orientations. Tributary A is facing towards the north whereas tributary C is facing towards the east, receiving more solar radiation compared to tributary A. Higher solar radiation increases the surface temperature leading to higher melt. A similar difference was observed at Chhota Shigri Glacier (Wagnon and others, Reference Wagnon2007; Mandal and others, Reference Mandal2020). Similarly, Schmidt and Nüsser (Reference Schmidt and Nüsser2017) stressed the importance of shading and radiation effects on glacier melting over the Trans-Himalayan region.
5.2 B a and B w variability
B a was mostly negative, except for 2010/11 and 2014/15 (Fig. 3). B w shows a low spatiotemporal variation compared to B a (Figs 5, Fig. 2). Mean db/dz abl (0.47 ± 0.12 m w.e. (100 m)−1; Table 2) is lower than the neighbouring Chhota Shigri Glacier (0.68 ± 0.12 m w.e. (100 m)−1; Mandal and others, Reference Mandal2020). Glacier vertical mass-balance gradients are an essential factor in understanding the climate setting of a glacier (Oerlemans, Reference Oerlemans2001). db/dz abl is mainly controlled by the difference in air temperature at different altitudes. Table 3 provides the vertical mass-balance gradient (db/dz) of recently measured glaciers in the Himalayan region. The db/dz values in the Nepalese Himalaya were mostly vertically steep except for Mera Glacier, which has a relatively gentle gradient (0.46 m w.e. (100 m)−1 a−1) compared to other Himalayan glaciers (Table 3). One of the possible reasons for such low db/dz at Mera Glacier was due to continuous snowfall/accumulation on the glacier surface during summer, which subdues the ablation (Sherpa and others, Reference Sherpa2017). However, for Patsio Glacier, db/dz was calculated only for the ablation zone, which shows a gentle gradient (0.47 m w.e. (100 m)−1 a−1) as compared to Chhota Shigri and Stok glaciers. A low db/dz observed at Patsio Glacier could be due to significant ablation observed even at the higher altitudes (Fig. 2). Such high ablation is possibly due to the fine dust/sediments (Fig. S5a) present on the glacier surface between 5200 and 5350 m a.s.l. which tends to modify the albedo leading to enhanced ablation.
Table 3. Comparison of glaciological mass balance (B a) and vertical mass-balance gradients (db/dz) of measured glaciers in the Himalayan region for the period 2010–17

* db/dz of the ablation zone.
During B w measurements, at the lower altitude (4900–5100 m a.s.l.) snow distribution showed less variability with altitude (Fig. 5). The summer season starts at the end of May in the Lahaul-Spiti region (Singh and others, Reference Singh2019). Glaciers in the Lahaul-Spiti region fall within the range of 4000–6000 m a.s.l. (Vijay and Braun, Reference Vijay and Braun2016). Patsio Glacier is situated at higher altitudes, where the glacier snout is located at 4875 m a.s.l. Such higher regions remain cold during the early summer period (Mandal and others, Reference Mandal2020). Therefore, there is less possibility of snow ablation at Patsio Glacier surface during the early summer season. Correction analysis of B w due to variation in dates are beyond the scope for this study however, the mean vertical gradient observed during the study period falls within the error range. Our B w measurements show a low vertical mass-balance gradient (mean of 0.29 ± 0.12 m w.e. (100 m)−1). The possible reason for shallow db/dzB w is due to continuous snowfall and cold temperature during the winter season, which has been observed in this region (Dimri and Dash, Reference Dimri and Dash2012; Negi and others, Reference Negi2017).
B a and B w show a systematic interannual variability (Fig. 6). A significant positive correlation (r = 0.82, p < 0.05) between B a and B w for the period 2012–17 was observed. Similarly, a correlation coefficient of r = 0.76 was observed between B a and B w of Chhota Shigri Glacier between 2009 and 2019. A positive correlation (r = 0.98) was found for Stok Glacier, however, the B a and B w were based on modelling (Soheb and others, Reference Soheb2020). The probable reasons for a good correlation between B a and B w are due to snow accumulation over the glacier surface, which protects the glacier ice from melting during summer, due to the albedo effect (Mölg and others, Reference Mölg, Cullen, Hardy, Kaser and Klok2008; Azam and others, Reference Azam2014; Zhu and others, Reference Zhu2015). Also, the less snow cover led to early exposure of glacier surface, ultimately increases the glacier ablation duration.

Fig. 6. Box plots of interannual variation of mass-balance measurements of both annual and winter. B a_Pt represents the annual point mass balance excluding the positive mass-balance measurements (from 2010/11 to 2016/17), and B w_Pt is the winter point mass-balance measurements (from 2011/12 to 2016/17). B a and B w are the annual and winter mass balance.
5.3 Mass balance and meteorological parameters
Precipitation contribution in the Lahaul-Spiti region was ~75% in winter and ~25% in summer seasons (area-averaged precipitation for Lahaul-Spiti district; see Section 3.2). Similarly, the contribution of winter and summer precipitation measured at the Chhota Shigri Glacier base camp (2012–17) was ~71 and 29%, respectively (Azam and others, Reference Azam2019). To make a consistent comparison, we divided the total precipitation into annual, winter and summer, corresponding to the measured mass-balance periods (Fig. 3). A comparison between B a (after removing two positive B a years) of Patsio Glacier and positive temperature sum (∑T air+) recorded at Chhota Shigri Glacier show a significant negative correlation (r = 0.91, p < 0.05). In 2011/12 and 2015/16, B w measurement shows almost similar values i.e. 0.88 and 0.9 m w.e., respectively. However, B a in 2015/16 was more negative (−0.68 m w.e.) than that in 2011/12 (−0.51 m w.e.). Higher negative B a in 2015/16 corresponds well with the higher summer temperature, especially ∑T air+ (Table S2). Similarly, high ablation observed on Stok Glacier in 2015/16 correlates with high summer temperature, which resulted in an increased negative B a compared to other years (Soheb and others, Reference Soheb2020). In 2013/14, Patsio Glacier experienced a low ablation and accumulation, which correlates well with the summer temperature and annual precipitation (Fig. 3 and Table S2) during the study period. In the same line, ∑T air+ recorded at Chhota Shigri in 2013/14 was lowest for the study period (2010–17). Comparison between seasonal mass balance and meteorological parameters at Chhota Shigri Glacier showed that air temperature was the primary governing factor of B a (Mandal and others, Reference Mandal2020). Subsequently, summer snowfall also plays a sub-equal role in governing the B a of Chhota Shigri Glacier. However, the timing and intensity were crucial (Azam and others, Reference Azam2014; Mandal and others, Reference Mandal2020). In 2014/15, summer snowfall might have played an essential role in subduing the ablation (albedo feedback) at Patsio Glacier, when B a was close to zero. We noticed heavy snowfalls during summer field visits in 2015. Also, high precipitation was recorded during summer 2015 (Fig 3 and Table S2). Soheb and others (Reference Soheb2020) also found a good correlation between high summer precipitation and low ablation for a couple of years in Stok Glacier. Multiple regression analysis of B a versus annual and summer precipitation shows a significant positive correlation (r = 0.78). A correlation coefficient analysis between seasonal mass balance and precipitation is given in Table S3. Overall, we noticed a similar variation in B a of Patsio, Chhota Shigri and Stok glaciers during 2010–17 (Table S2). Therefore, winter and summer precipitation (snowfall) including summer temperature plays a significant role in glacier ablation ultimately B a at Patsio and the neighbouring glaciers. However, for detailed and accurate statistical analysis we need an uninterrupted continuous temperature and precipitation dataset from the different glaciers, which is one of the most challenging but utmost requirements in the Himalayan region for glacier–climate interaction studies.
5.4 Comparison of mass balance with other studies
The cumulative B a of Patsio Glacier between 2010 and 2017 is −2.35 m w.e. (−0.34 m w.e. a−1) which is similar to the cumulative B a of −2.53 m w.e. (−0.36 m w.e. a−1) for Chhota Shigri Glacier for the same period (Mandal and others, Reference Mandal2020). Similarly, inter-annual variability of B a for Patsio (SD of ±0.32 m w.e. a−1) and Chhota Shigri glaciers (SD of ±0.34 m w.e. a−1) was almost similar. B a variability of Stok Glacier, which is ~130 km north of Patsio, was 0.26 m w.e. a−1 for the period 2014–17. Similarly, the cumulative B a of Stok Glacier between 2014/15 and 2016/17 (3 years) was −1.31 m w.e. (−0.44 m w.e. a−1) (Soheb and others, Reference Soheb2020). The mean B w of Patsio Glacier was 1.11 m w.e. a−1, which coincides with the mean B w (1.07 m w.e. a−1) of Chhota Shigri Glacier for the period (2011/12 to 2016/17). Similarly, the cumulative B w (6.63 m w.e.) of Patsio Glacier is concurrent with the cumulative B w of Chhota Shigri Glacier (6.42 m w.e.). Also, the year-to-year variation pattern of B a and B w of Patsio Glacier corresponds well to Chhota Shigri and Stok glaciers (Table S2). The above similarities indicate that at present, the above glaciers are responding similarly for the period 2010–17.
Estimation of glacier mass balance in the Lahaul-Spiti region is carried out mostly through remotely sensed geodetic method (Guo and others, Reference Guo2014; Brun and others, Reference Brun, Berthier, Wagnon, Kääb and Treichler2017; Shean and others, Reference Shean2020). Most of the study shows a negative geodetic mass balance in the recent past (Vincent and others, Reference Vincent2013; Vijay and Braun, Reference Vijay and Braun2016; Brun and others, Reference Brun, Berthier, Wagnon, Kääb and Treichler2017; Shean and others, Reference Shean2020). A negative mass loss of −0.44 ± 0.16 m w.e. a−1 for the periods 1999–2010 was observed over the Lahaul-Spiti region by Vincent and others (Reference Vincent2013) and −0.45 ± 0.13 m w.e. a−1 by Gardelle and others (Reference Gardelle, Berthier, Arnaud and Kääb2013) for the same period. Brun and others (Reference Brun, Berthier, Wagnon, Kääb and Treichler2017) estimated a geodetic mass balance using ASTER data and showed a negative mass loss of −0.37 ± 0.09 m w.e. a−1 for the Lahaul-Spiti region during 2000–16. Recently, Shean and others (Reference Shean2020) estimated a negative geodetic mass balance of −0.31 ± 0.08 m w.e. a−1 for the Lahaul-Spiti region for the period 2000–18 using high-resolution DEMs (WorldView/GeoEye) and ASTER data. They estimated a slightly lower geodetic mass balance of −0.20 ± 0.07 m w.e. a−1 for Patsio Glacier individually. The observed value of Shean and others (Reference Shean2020) is slightly lower than that of Brun and others (Reference Brun, Berthier, Wagnon, Kääb and Treichler2017) but within the error range. Geodetic mass balance estimated on Patsio Glacier using SRTM-X and TanDEM-X for the period 2000–13 shows a mass loss of −0.26 ± 0.11 m w.e. a−1 (Kumar and others, Reference Kumar2018), which is slightly lower than most of the region-wide geodetic estimates. The low negative mass balance observed during 2000–13, could be due to a couple of positive mass-balance years observed in this region, e.g. 2005, 2009–11 (Azam and others, Reference Azam2012; Negi and others, Reference Negi, Saravana and Rout2013; Mandal and others, Reference Mandal2020). Overall, the Lahaul-Spiti region has experienced a negative mass loss in the past two decades. The observed mean B a (−0.34 m w.e. a−1) of Patsio Glacier is also concordant with the geodetic and glaciological estimates observed for the Lahaul-Spiti glaciers (Mandal and others, Reference Mandal2020), especially with the observation of Brun and others (Reference Brun, Berthier, Wagnon, Kääb and Treichler2017) and Shean and others (Reference Shean2020). Also, in situ measurements at the higher altitudes of Patsio Glacier show ablation, which further confirms the geodetic observations made by Brun and others (Reference Brun, Berthier, Wagnon, Kääb and Treichler2017).
Table 3 presents the glaciological mass balance observed in the Himalayan region for the period 2010–17. The annual mass balance observed in eastern Nepal shows a higher mass loss in comparison with the western Himalayan region except for Mara and Rikha Samba glaciers which show a similar mass loss (Table 3). However, large variability in glacier mass loss has been observed in the eastern Himalayan region, which has been explained mainly by altitudinal differences of the different glaciers (Sherpa and others, Reference Sherpa2017). Overall, glaciological mass-balance observations across the Himalaya show negative mass balance in the recent periods.
6. Conclusion
We present the annual and winter glacier-wide mass balance of Patsio Glacier, which is the first-ever long-term in situ mass-balance datasets of a glacier from the Bhaga basin in the Lahaul-Spiti region. B a measurements reveal that Patsio Glacier has lost mass at the rate of −0.34 m w.e. a−1 from 2010 to 2017. However, during the winter season, Patsio Glacier has accumulated mass at the rate of 1.11 m w.e. a−1. The inter-annual variability of B w was smaller than that of B a. Also, a low spatiotemporal variation was observed for B w (db/dzB w of 0.21 m w.e. (100 m)−1) during the study period (2012–17).
Statistical analysis between B w and B a shows a positive correlation (r = 0.82, p < 0.05) indicating the role of winter accumulation in governing the annual mass balance during the study period. The spatial variation of point annual mass balance of Patsio Glacier was primarily governed by the non-climatic factors, especially the debris-cover and glacier orientation/aspect. Based on our observation and other related studies, it is apparent that the glaciers in this region are responding roughly at a similar magnitude during the study period.
Despite having some limitations, this study provides baseline datasets of annual and winter mass balance from one of the most data scare regions of the world. However, the long-term seasonal mass-balance measurements are required to validate the positive correlation between winter and annual mass balance along with the geodetic mass-balance measurements to support the glaciological observations.
Supplementary material
The supplementary material for this article can be found at https://doi.org/10.1017/jog.2021.60.
Acknowledgements
This study was partially supported by Space Application Centre (SAC)-Indian Space Research Organisation (ISRO), Government of India (GOI) and GLACINDIA project, a joint project between the Department of Science and Technology (DST), GOI and Research Council of Norway (RCN). The authors are highly thankful for our ex-glacier group members, Dr Parmanand Sharma, Dr Anurag Linda and Dr Jose George Pottakkal for helping in initiating and conducting mass-balance measurements at the beginning of the study period. We are highly grateful to the Scientific Editor Argha Banerjee and the two anonymous referees whose detailed comments and suggestions have significantly improved the paper. TA is grateful to Jawaharlal Nehru University, for the laboratory facilities throughout the study period. The authors are grateful for various glacier training programmes conducted by DST, GOI, and also for CHARIS project. We are also thankful to all the field experts and assistants, especially Mr Adikari, who helped in conducting the fieldwork. Finally, we thank the USGS for Landsat and SRTM data, Planet Labs for PlanetScope image and Indian Meteorological Department for precipitation data.
Author contributions
TA, AM, MS, VBS, SV and SM conducted the field measurements. TA performed all calculations, analysed all data and wrote the paper. ALR supervised, conceptualised and modified the manuscript in all stages. IMB made comments on the draft, final proofreading with suggestions and arranged partial funding. AM helped in writing the manuscript and produced the final figures. MS helped in improving the manuscript and figures. SV and SM helped in improving the manuscript.


 Open access