


INTRODUCTION
Syndromic surveillance systems arose from the need to immediately identify unexpected clusters of disease; the main impetus behind building this kind of surveillance has been the threat of bioterrorism [1–5]. The SARS epidemic in 2004 and the pressing threat of an influenza pandemic are now providing more relevant uses for syndromic surveillance in a wider public health spectrum [Reference Reingold2, Reference Petrosillo, Puro and Ippolito6–Reference Cooper9].
The rationale behind monitoring syndromes instead of diseases is to identify the occurrence of clusters as quickly as possible [Reference Buehler3, Reference Dembek, Cochrane and Pavlin10].
To be useful and efficient a syndromic surveillance system must be sensitive, i.e. it should recognize real clusters, specifically, it should have a high positive predictive value (PPV), in other words it should make very few false positives, and timely, the cluster should be identified early enough for an effective response [11, Reference Wagner12].
One of the factors influencing both specificity and sensitivity of a surveillance system is the operative case definition adopted [Reference Espino and Wagner13–Reference Greenko15]. Several syndromes have been under surveillance in order to monitor different hypothetical disease clusters [16–19]. In the Lazio region there is an Emergency Information System (EIS) [Reference Giorgi Rossi20] that collects all the daily admissions from 34 (out of 61) of the emergency departments (ED) in the region.
In this paper we developed operational case definitions for the 13 syndromes included in the syndromic surveillance [19] of an Italian region, which can automatically be detected from the electronic emergency-room visit report, and we estimated their sensitivity and their PPV.
MATERIALS AND METHODS
The setting
The setting was the Lazio region, with about 5·5 million inhabitants, which is the region of central Italy that includes Rome (3 million inhabitants).
Data source
The syndromic surveillance system of the Lazio region is based on the EIS [Reference Giorgi Rossi20]. Since 2000, it has recorded all emergency ward admissions in Lazio from all 61 EDs in the region.
For each ED admission the EIS reports:
• personal data (the name, the date and place of birth, the gender of the patient);
• information collected at triage:
— the triage code (an operative scale of urgency used to establish treatment priority);
— the chief complaint [grouped into 15 categories (coma, fever, convulsions, other nervous system symptoms, dyspnoea, trauma, chest pain, precordial pain, vomiting, abdominal pain, intoxication, haemorrhage without trauma, other symptoms, other pain, fixed appointment)];
— symptom onset (in hours before the visit);
— some vital parameters (body temperature, blood pressure, respiratory rate, cardiac frequency, Glasgow Coma Scale);
• up to five diagnoses and up to five therapeutic procedures (both diagnoses and procedures coded according to ICD-9-CM);
• the outcome of the admission (hospitalization, death, transfer or discharge).
All of the data from 34 EDs is immediately transferred from the hospital to the regional system in real time. These EDs are included in the syndromic surveillance (Fig. 1).
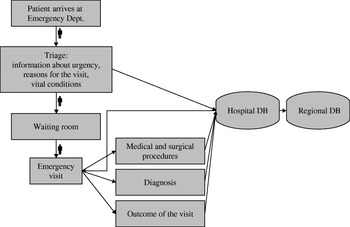
Fig. 1. Flow-chart of the surveillance system. The Emergency Information System collects the data gathered at triage and at the end of the emergency visit and transmits it to the region, where the data are automatically analysed in real-time for clustering by the syndromic surveillance. Then the identified clusters are manually screened by the epidemiology team to detect putative outbreaks.
About 40% of the records included free-text diagnoses, which were directly reported by the emergency physician at the end of the visit, integrating the ICD-9-CM codes.
Study design (Fig. 2)
The operational case definitions were tested on the 2004 database. To ascertain the cases identified, we used a re-abstract study based on the analysis of the electronic ED medical records and the Hospitalization Information System (of all the hospitalizations that occurred in our region [Reference Cardo21] of the cases identified). As examples of false-positive records identified, many cases of unspecified shock (ICD-9-CM 785.50; 785.59), which were identified by the operational definition as ‘Sepsis or unexplained shock’ syndrome, were re-classified as lipothymia during the re-abstract study; furthermore, many ED visits reporting central nervous system ICD-9-CM codes were classified as ‘Meningitis, encephalitis, or unexplained acute encephalopathy’ syndromes by the operational definition, but during the re-abstract study it was clear that they were recurrences of pre-existing psychoses.

Fig. 2. Study design. All the emergency department visits reported to the system are divided into three subsets: true syndromes (solid line circle), the cases fulfilling the operational definition (dashed line circle), and the cases fulfilling the free text-based definition (dotted line circle). The formulas used to calculate sensitivity, related to the figure by letters, are at the top left. At the bottom left we reported an example with the numbers for respiratory symptoms with fever.
To measure the PPV, we randomly sampled, for each of the 13 identified syndromes and among cases with electronic medical records available, 300 cases that matched the operational definitions. If there were fewer than 300 cases that fulfilled the definition, we checked the entire population. We measured the percentage of true positives and false positives in the sample.
To measure the sensitivity we needed to know how many cases were not captured by our operational case definition. The total number of records that did not fit any of our case definitions was very high and we expected a very low prevalence of false negatives, so the estimate would have been very imprecise unless we studied a very large sample. To minimize this problem we created a second case definition designed to be as sensitive as possible, based on a different source of information than that used for the operational case definition, i.e. the free-text diagnosis of the electronic medical record, we call this second definition the ‘free text-based definition’.
We applied this free text-based definition on the same dataset. We calculated the sensitivity of the free text-based definition on the subgroup of the true positives that we had already captured with the operational definition.
We quantified the PPV of the free text-based definition on a random sample of 300 cases for each syndrome. For this sampling we excluded all the records already captured by the operational definition; consequently the estimated PPV refers only to the population not captured by the operational definition. This choice allowed us to have a higher precision in the estimation of the entire population. If there were fewer than 300 cases that fulfilled the definition, we checked the entire population.
Applying the sample estimate of the PPV of the two definitions to the entire captured population and the observed sensitivity of the free text-based definition to the subset of the operational definition, we estimated the number of true cases captured by both definitions, those captured by the operational definition only, and those by the free-text definition only. These three quantities were then used to calculate the true cases not captured by either definition through a capture–recapture method assuming the two sources were independent.
The following formula was adopted to estimate the entire population and consequently the sensitivity of the operational definition (Fig. 2):

where a represents the true cases captured by both definitions; d the true cases captured only by the free-text definition; e the true cases captured only by the operational definition; ? the true cases not captured by any definition; PPVop is the sample estimate of the PPV of the operational definition; Nop is the number of cases captured by the operational definition; PPVtext is the sample estimate of the PPV of the free-text definition among the population not captured by the operational definition; Ntext is the number of cases captured by the free-text definition among the population not captured by the operational definition; Senstext is the sample estimate of the free-text definition sensitivity.
Estimate of uncertainty due to the sampling procedures
We calculated 95% confidence intervals (95% CI) for the PPV sample estimates according to a binomial distribution. The 95% CI for sensitivity rate was calculated using Monte Carlo [22] simulations assuming binomial distributions of the sample estimates for the PPVop, PPVtext and Senstext.
Power of the study
The 300 case samples provided a precision of ±3% in the case of a 50% PPV, i.e. the case maximizing the variance and the uncertainty.
RESULTS
The EIS collects records from about 2·2 million ED visits per year, 1·5 million are from hospitals that participate in the syndromic surveillance system.
Table 1 presents the syndromes and their operational case definitions. Most of the definitions are based on the information gathered at triage (e.g. fever, absence of trauma or other chronic conditions), first contact between the patient and the emergency personnel, the diagnosis given at the end of the visit, and on outcome of the visit (i.e. for ‘unexplained death’). Only one syndrome, haemorrhagic diarrhoea, requires the presence of two diagnostic codes at the same visit.
Table 1. Syndrome definition and putative diseases or aetiological agents

Neurological syndromes include the largest number of codes from different chapters of the ICD-9-CM: infectious diseases, neurological disorders, symptoms and trauma.
The number of cases that fulfilled the operational case definition in 2004 ranged from 27 320 for gastroenteric syndrome to three for haemorrhagic diarrhoea (Table 2). The PPVs ranged from 99·3 to 20, half of the definitions have a PPV over 90%, while sepsis, neurological/meningitis and coma are below 50%.
Table 2. Number of cases captured by the case definitions and positive predictive values (PPV)

* Number of cases for which the free-text definition was available.
† Two out of three cases, without free-text diagnosis were ascertained directly checking the medical records, for the last one the medical record was not available.
‡ Since the captured cases were less than 300, we checked all the available records.
§ For 25 cases the free-text diagnosis was not informative and was not included in the PPV proportion.
To calculate the sensitivity of our operational definitions we used a second definition, based on the free-text diagnosis, which was developed to be as sensitive as possible despite its low specificity. The free text-based definitions are given in the Appendix (available in the online version of the paper), together with a complete list of the codes used in the operational definitions. Table 3 presents the sensitivity of the free text-based definitions, measured on the subset of true positives of the operational case definitions: the objective of high sensitivity was reached since all values are close to or over 90%. On the other hand, the PPVs range from 2% to 78%.
Table 3. Sensitivity of the case definitions. In the following table are reported the values used to estimate the sensitivity of each operational case definition: the sensitivity of the free-text definition, the positive predictive value (PPV) and the estimated number of missed cases

* The free-text definition has been applied only to the records that have not been captured by the operational definition.
† The 95% confidence intervals have been calculated using Monte Carlo simulation and assuming binomial distribution for the sensitivity and the PPVs.
‡ For these syndromes we did not estimate the 95% CI because of small numbers, the results are subject to extreme variability.
The sensitivity of the operational definitions, obtained through the modified capture–recapture model, ranges from 90% for coma to 22% for haemorrhagic diarrhoea.
DISCUSSION
The formation of new public health goals has freed syndromic surveillance from its original objective of being a tool to prevent bioterrorism, and given it new relevance and applicability [Reference Reingold2, Reference Cooper9].
The syndromes to be monitored were selected by a collaborative panel composed of the Ministry of Health and Defence [19]. The goal of this surveillance is to detect unexpected clusters of existing diseases as well as putative bioterrorism attacks. Bearing in mind the objectives of the surveillance system, we evaluated how the case definitions worked in practice.
The syndrome with the lowest PPV was sepsis or shock. This is an obvious consequence of the low prevalence of this syndrome [Reference Altman and Bland23, Reference Lombardo, Burkom and Pavlin24]. Furthermore, the a priori knowledge of the small number of cases and the syndrome's severity led us to use a non-specific definition to maximize sensitivity. Unfortunately, despite the low PPV, the sensitivity is still not high.
The neurological syndromes, central (associated with meningitis) and peripheral (associated with botulism), performed worst (low sensitivity and low specificity). This reflects the multitude of symptoms that an acute neurological disorder may produce; these are not syndromes but systemic diseases that include several syndromes [Reference Lombardo, Burkom and Pavlin24–Reference Henry, Magruder and Snyder26].
The operational definition used for haemorrhagic diarrhoea syndrome is not well adapted to this information system because it needs the presence of two diagnoses, while more than 90% of the cases in our dataset list only the principal diagnosis. All other syndromes that require the presence of two conditions can use at least one from triage (chief complaint or vital parameters).
The low sensitivity for unexplained death was unexpected. If the sensitivity of the automatic surveillance of ED visits is less than 60%, such an important syndrome should be surveyed with several sources of information and followed by specific training for ER personnel.
Limits and methodological remarks
We calculated the sensitivity with a simple two-source capture–recapture method. This model assumes that the two capturing methods are independent (not a very reasonable assumption). We modified the capture–recapture model to take into account captured cases that were false positives, i.e. we adjusted for poor specificity, but we estimated the proportion of false positives only on a sample of the captured cases.
Another limit of the study is our gold standard: we used all the information available in the electronic ED medical records and hospital admission databases to identify cases, but the accuracy of this information is often poor [Reference Cardo21]; on the other hand, this approach permitted us to evaluate 13 syndromes relatively quickly without site visits or having to re-abstract paper medical records.
To our knowledge, there are few studies that apply a capture–recapture model to adjust for the PPV of the data sources; van Hest and colleagues [Reference van Hest27] accounted for the non-ascertainment of cases and for imperfect record-linkage in their estimate of tuberculosis under-notification, but their results are not comparable with ours since they were interested in laboratory-confirmed cases while our aim was to capture syndromes.
CONCLUSIONS
EDs are universally considered one of the best sources for syndromic surveillance [Reference Wagner12, Reference Hirshon28]. The present study confirms that an online emergency information system can be efficiently used to automatically monitor several syndromes [Reference Foldy7, Reference Wagner25, Reference Irvin, Nouhan and Rice29–Reference Yuan, Love and Wilson33].
The sensitivity and PPV estimates we propose are context-specific and cannot be applied to other surveillance systems, because the operational definitions must be established with local emergency physicians and tested in the area under consideration. Nevertheless, the method we propose can be used in any automated surveillance system and some general findings about the syndromes to be monitored can be made. Some syndromes, such as gastroenteritis, where the exposure history [Reference Giorgi Rossi and Borgia34] and symptoms are immediately clear, fit this surveillance better than others, such as hemorrhagic diarrhoea, where the symptoms are not evident and a more precise diagnosis, often based on a simple laboratory test, is needed.
ACKNOWLEDGEMENTS
We thank all the staff from the Emergency Information System who make the surveillance possible every day. In particular Assunta De Luca, coordinator of the Emergency network of the Lazio region and Luisa Sodano, Centre for Disease Control and prevention (CCM) of the Italian Ministry of Health. We also thank Margaret Becker for the English editing, and the reviewers of this paper for their invaluable contribution to the final version of this paper. The project has been financed by the Italian Ministry of Health Centro per il Controllo e la Prevenzione delle Malattie (CCM).
DECLARATION OF INTEREST
None.
NOTE
Supplementary material accompanies this paper on the Journal's website (http://journals.cambridge.org).


