


Bipolar disorder is often misdiagnosed as unipolar depression, leading to inadequate treatment and poor outcome. Unfortunately, no biological markers yet exist to facilitate differential diagnosis of bipolar disorder. Reference Almeida and Phillips1 A relatively recent development has been the application of pattern recognition in combination with neuroimaging techniques. Clinically, this combination is capable of classifying individuals, case by case, into one of two diagnostic groups based on neuroimaging measures. Reference Mourão-Miranda, Bokde, Born, Hampel and Stetter2 We aimed to use a pattern recognition technique to classify individuals with current depression, case by case, as either having bipolar or unipolar depression based on measures of resting blood flow using arterial spin labelling (ASL) in different anterior cingulate cortex (ACC) subdivisions, given the role of the ACC in the pathophysiology of mood disorders.
Method
We recruited 36 females in a depressive episode, 18 with recurrent unipolar depression and 18 with bipoloar I disorder. The groups were matched for demographic and clinical variables (see online Tables DS1 and DS2). An age-matched group of 18 healthy females was also recruited. Assessments were carried out using the Structured Clinical Interview for DSM-IV Axis I disorders (SCID-I). Reference First, Spitzer, Gibbon and Willians3 The University of Pittsburgh Medical Center Institutional Review Board approved the study protocol. All participants gave written informed consent.
Perfusion data processing and analyses were carried out primarily with Statistical Parametric Mapping software (SPM5, Wellcome Department of Cognitive Neurology, UK; www.fil.ion.ucl.ac.uk/spm) implemented in Matlab7 (Math Works, Natick, MA), with some additional modifications for perfusion analysis Reference Wang, Fernandez-Seara, Alsop, Liu, Flax and Benasich4 (http://cfn.upenn.edu/perfusion/software.htm; see online supplement).
We performed support vector machine (SVM) analyses Reference Mourão-Miranda, Bokde, Born, Hampel and Stetter2 for cerebral blood flow in a pair-wise fashion (i.e. bipolar depression v. unipolar depression group, bipolar depression v. healthy group, and unipolar depression v. healthy group). Masks based on anatomically defined subdivisions of the ACC were used as input to the classifier from the toolbox WFUpickatlas, and included: subgenual ACC (BA25), rostral/perigenual ACC (BA24) and rostral ACC (BA32). We also used whole-brain blood flow to define spatial patterns of cerebral blood flow, as input to the classifier. Pattern recognition analyses with ACC regional (and whole brain) grey matter volume were also performed and reported in online Table DS4 given our main focus on pattern recognition using cerebral blood flow.
The PROBID toolbox (www.kcl.ac.uk/iop/depts/neuroimaging/research/imaginganalysis/Software/PROBID.aspx) was used to perform the pattern classification analysis of brain imaging data. For pattern recognition-based classification, the task of classifying a set of images into two classes (such as unipolar v. bipolar depression) can be viewed as a task of finding a decision boundary between two groups. The classification procedure consists of two phases: training and testing. During the training phase, the algorithm finds a hyperplane that separates the training examples in the input space according to their class labels. Once the decision function is learnt from the training data, it can be used to predict the group membership of test individuals, case by case. We evaluated the performance of SVM to discriminate between groups using a leave-one-pair-out cross-validation test. Here, we first used data from all but one individual in each group to train the classifier. Then, we predicted group membership using the brain scans of the remaining individual (one per each group). Permutation testing was used to derive a P-value for the SVM accuracies. Reference Mourão-Miranda, Bokde, Born, Hampel and Stetter2 Further details of the pattern recognition analyses are in the online supplement.
Results
For the unipolar v. bipolar depression groups, pattern recognition analysis was significant for the pattern of regional cerebral blood flow across voxels at rest in the subgenual ACC (BA25) subdivision (P = 0.001). Here, classification was at 83% sensitivity, 78% specificity, and 81% overall accuracy for this ACC subdivision (Table DS3, Fig. 1). The positive predictive value was 79% and the negative predictive value was 82% for the same ACC subdivision. Of the three participants with unipolar depression who were unmedicated, two were correctly classified. All four participants with bipolar depression who were unmedicated were correctly classified.
Testing the unipolar depression v. healthy groups, pattern recognition analysis was only marginally significant for the pattern of regional cerebral blood flow across voxels at rest in the rostral/perigenual ACC (BA24) subdivision (P = 0.02). Here, classification was at low accuracy: approximately 50% sensitivity, 83% specificity, and 67% overall accuracy for this ACC subdivision (Table DS3). Other comparisons were not significant (Table DS3).
Discussion
Our goal was to use ASL, a promising non-invasive neuroimaging technique, to identify the extent to which measures of ACC resting cerebral blood flow could have clinical utility to distinguish recurrent unipolar from bipolar depression. Reference Almeida and Phillips1 Our findings indicate that the ASL measure of pattern recognition of resting blood flow across voxels in the subgenual subdivision (BA25) of the ACC, classified, case by case, females with unipolar depression and bipolar I depression with 83% sensitivity, 78% specificity and 81% accuracy.
We focused our neuroimaging investigation on the functional integrity of rostral and subgenual subdivisions of the ACC, key neural regions implicated in mood regulation and processing of negative self-referential information. Reference Price and Drevets5 A number of earlier positron emission tomography (PET) studies revealed metabolic and blood flow abnormalities in ACC in currently depressed individuals with recurrent unipolar depression. Reference Price and Drevets5,Reference Mayberg, Liotti, Brannan, McGinnis, Mahurin and Jerabek6 Here, the most consistent PET findings report abnormally elevated resting ACC blood flow in individuals with unipolar depression relative to healthy individuals, Reference Mayberg, Liotti, Brannan, McGinnis, Mahurin and Jerabek6 especially in the subgenual region. Reference Price and Drevets5 Other studies, however, reported a relative decrease in ACC blood flow in individuals with unipolar depression relative to healthy individuals. Reference Bench, Friston, Brown, Scott, Frackowiak and Dolan7 Ours is the first study to use ASL to measure regional blood flow in individuals with bipolar disorder.
It should be emphasised that pattern recognition analysis with SVM does not rely on univariate measures distinguishing groups; rather, it allows individual participants, case by case, to be classified as belonging to one of two groups using multivariate measures. In univariate analysis a statistical test is applied to each voxel to test whether there is mean difference in signal between the groups. Univariate analyses enable local inference regarding the effect of interest. Conversely, pattern recognition approaches (e.g. SVM) are multivariate techniques (i.e. they take into account spatial correlations in the data), and if the discrimination is based on the whole brain pattern, all voxels within the brain will contribute to the classification and no local inferences based on these approaches should be made. When applied to regions of interest, pattern recognition approaches can achieve relatively greater sensitivity than univariate analysis as they are able to detect subtle, spatially distributed patterns. Reference Mourão-Miranda, Bokde, Born, Hampel and Stetter2,Reference Schölkopf and Smola8,Reference Vapnik9
Pattern analyses using ACC regional cerebral blood flow did not accurately distinguish between healthy females and females with either unipolar or bipolar depression. However, the diagnostic value of a test will be much improved if, based on our history and clinical assessment, we limit the use of the test to those patients who are likely to have the disease in question. A positive or a negative result is then more likely to be meaningful, than when the test is indiscriminately applied to a population. A diagnostic test should be used to supplement rather than as a substitute for clinical judgement.
There were some limitations to our study. Nearly all patients were on medication, and several had a history of substance misuse. However, we found no significant relationships between clinical measures (including medication) and test margins for regions accurately classifying individuals as belonging to either group with depression (Tables DS6-7). Our study included only females. Also, there was no independent test-set of data. Thus, the generalisability of our results remains to be proven and replicated.
Our findings indicate for the first time that resting cerebral blood flow, together with pattern recognition analysis and SVM in the subgenual ACC subdivision, could potentially be used as novel multivariate neuroimaging measure to accurately classify individuals with depression as having a recurrent unipolar v. a bipolar I diagnosis. These very promising findings highlight the utility of neuroimaging measures such as ASL to help identify biological markers reflecting pathophysiological processes associated with different affective disorders, and the important, emerging role of pattern recognition techniques to help accurately classify individuals into diagnostic groups based upon biological measures.
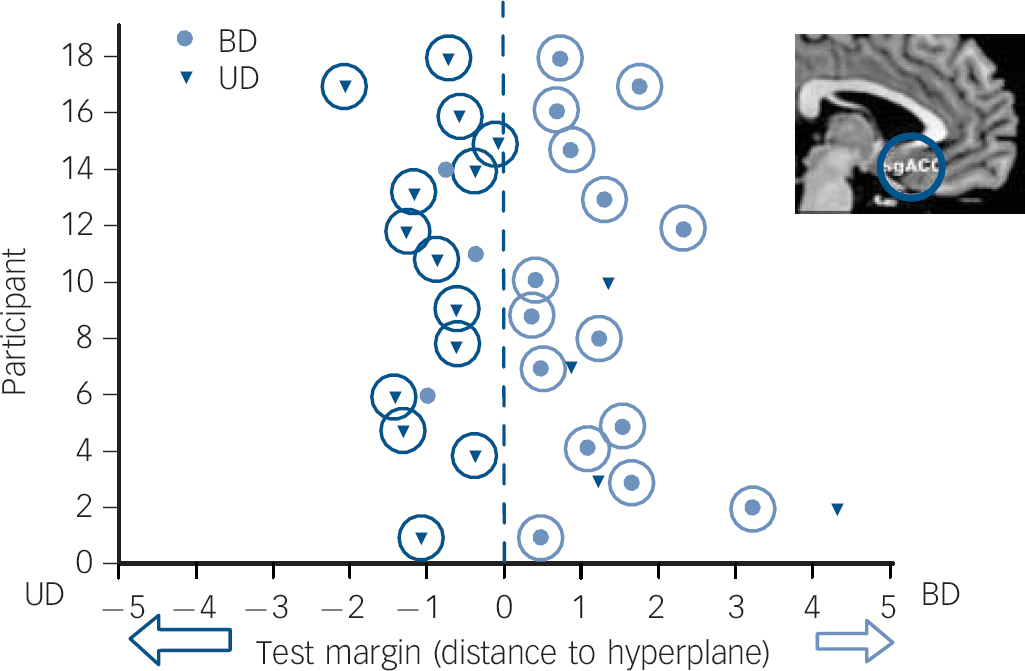
Fig. 1 Distance from the hyperplane (or test margin) for each participant based on the spatial pattern of resting blood flow within the subgenual anterior cingulate cortex (ACC, BA25) classifier.
Participants were classified with unipolar depression (UD, triangle, 14/18 accurately classified) or bipolar depression (BD, circle, 15/18 accurately classified) with 80.6% accuracy (P = 0.001). Top right: schematic representation of the brain with the subgenual (sg) ACC highlighted by a circle.
Funding
J.R.C.A received funding from U01MH092221-01 (EMBARC); M.L.P. from R01 MH076971-01 and U01MH092221-01; A.V. from a NARSAD young investigator award; J.M.-M. from Wellcome Trust Career Development Fellowship grant number WT086565/Z/08/Z; H.L. from R01 MH084021; and F.A.K from DM090122, 1 U01MH092221-01.


eLetters
No eLetters have been published for this article.