


Air-displacement plethysmography (ADP), integrated in the commercially available system BOD POD®, is a validated technique to assess body composition(Reference Fields, Goran and McCrory1). It has the advantage over the four-compartment model of including a quick, comfortable, automated, non-invasive and safe measurement process, making it feasible for children. As the best performing two-compartment model, ADP is more reliable for body composition than routine anthropometric measurements(Reference Fields and Goran2). Nevertheless, the conversion from body density obtained by ADP measurement to fat mass percentage (FMADP%) needs consideration in children. As the chemical maturation of lean tissue changes with age and proceeds differently in males and females, age- and sex-adjusted factors need to be considered for children, as was done by Lohman(Reference Lohman3) and more up-to-date by Wells et al. (Reference Wells, Williams and Chomtho4).
Although ADP is considered as a more feasible method for large-scale surveys in comparison with the four-compartment model, the immobile aspect of ADP could also be a limitation for large-scale surveys. Due to these logistic and budgetary constraints, examinations in large-scale epidemiological studies, including the assessment of body composition, are often restricted to only routine measurements (weight, height, circumferences, skinfold thickness and bioelectrical impedance (BIA)). However, the accuracy of routine anthropometric measurements in children is still doubted, although inter- and intra-observer error can be controlled when thorough training is carried out(Reference Stomfai, Ahrens and Bammann5). Furthermore, a variety of techniques are used (e.g. whole body v. foot-to-foot BIA) and equations to convert the measurement in FM% are population specific. Especially, in children, the assessment of body composition remains a challenging task(Reference Wells and Fewtrell6, Reference Sweeting7).
In the present paper, the validity of anthropometric measurements/indices and of FM% equations (FMeq%) based on anthropometric measurements (skinfolds and BIA) was investigated with FMADP%, using as the reference method the BOD POD® device with the up-to-date Wells adjusting factors for children. As such, research groups without specialised technologies such as ADP can make a well-founded choice on the routine anthropometric measurements, indices and equations to be used in obtaining a good indication of children's body fat. Furthermore, it is interesting to examine whether the bigger workload, cost and the more complicated survey management with an immobile device like the BOD POD® is justified in large-scale surveys (i.e. are the anthropometric measurements interchangeable with ADP?). The present study will help in these two decisions using a large child population (n 480) in which a large battery of anthropometric measurements was performed.
Methods and materials
Population
Participating children were part of the Belgian control region (i.e. Aalter, a city in Flanders, the northern, Dutch-speaking part of Belgium) of the IDEFICS (Identification and prevention of Dietary- and lifestyle-induced health EFfects In Children and infantS) study, funded within the European Sixth Framework Programme. The aim of the IDEFICS study was to identify and prevent dietary- and lifestyle-induced health effects in infants and children(Reference Ahrens, Bammann and Siani8). In Belgium, children were selected by random cluster sampling (all children from a selection of schools in the control city), and 750 children participated in the routine anthropometric measurements at school (participation rate of 41·3 %, 11 % overweight). Of these 750, 480 children (52·3 % male, 6·7 % overweight), aged between 5 and 11 years, agreed to undergo the extra ADP measurement at the survey centre within maximal 3 weeks of the school measurement. Data were collected from February to May 2010. All children were Caucasian, except for five girls of African-American origin. The present study was conducted according to the guidelines laid down in the Declaration of Helsinki and all procedures were approved by the ethics committee of Ghent University. Written informed consent was obtained from all parents.
Body composition measurements
Routine anthropometric measurements
All field work was carried out by two observers, and intra- and inter-observer reliability was enhanced by extensive training(Reference Stomfai, Ahrens and Bammann5). The children were measured barefooted in underwear and/or T-shirt.
Weight was measured in fasting status with an electronic scale (TANITA® BC 420 SMA; Tanita Europe GmbH) to the nearest 0·1 kg. Height was measured with a telescopic height measuring instrument (SECA 225; Seca Ltd) to the nearest 0·1 cm. The BMI z-score was obtained by calculating the BMI (weight (kg)/height (m)2) and adjusted for age and sex using British 1990 growth reference data(Reference Cole, Freeman and Preece9). Overweight was determined by the International Obesity Task Force classification(Reference Cole, Bellizzi and Flegal10).
Foot-to-foot impedance (Ω) was measured with the electronic TANITA® BC 420 SMA scale (prototype adapted to the small foot size of children). As impedance is dependent on length of the conductor, an impedance index reflecting the fat-free mass was defined as impedance index = height2/impedance. To reflect fat-mass, ‘weight minus impedance index’ was calculated.
Skinfold thicknesses (mm) were measured twice on the right side of the body to the nearest 0·2 mm with a skinfold calliper (Holtain, range 0–40 mm) according to the international standards for anthropometric assessment(Reference Marfell-Jones, Olds and Stewart11) and the mean of both measurements was calculated. The triceps skinfold (TSF) was taken halfway between the acromion process and the olecranon process at the back side of the arm. The subscapular skinfold (SSF) was measured 20 mm below the tip of the scapula, at an angle of 45° to the lateral side of the body. If the first and second measurements of the skinfolds differed by more than 2 mm, a third measurement was performed.
Circumferences (cm) were measured once with an inelastic tape (Seca 200, precision 0·1 cm, range 0–150 cm; Seca Ltd), with the subject in a standing position. Circumference measurements were performed at the following three sites: (1) mid-upper arm circumference (MUAC), relaxed arm, halfway between the acromion process and the olecranon process; (2) waist, halfway between the top of the iliac crest and the lower coastal border (10th rib) and (3) hip, at the maximum extension of the buttocks.
Equations found in the literature were used to calculate FMeq% as long as they were at least partly based upon a population sample that included children and if all the needed parameters were measured in the study. For BIA, only equations using the impedance (as we have measured), and not the resistance or reactance were selected. The selected equations based on impedance or skinfold thickness and their characteristics are listed in Table 1. Apart from the built-in Tanita® equation(Reference Susan, McCarthy and Fry12), the equations of Schaefer et al. (Reference Schaefer, Georgi and Zieger13), Deurenberg 1 and 2(Reference Deurenberg, Pieters and Hautvast14, Reference Deurenberg, van der Kooy and Leenen15) and Tyrrell(Reference Tyrrell, Richards and Hofman16) were selected for the impedance measurements and the equations of Slaughter(Reference Slaughter, Lohman and Boileau17), Goran(Reference Goran, Driscoll and Johnson18), Deurenberg 3(Reference Deurenberg, Kusters and Smit19) and Dezenberg(Reference Dezenberg, Nagy and Gower20) for skinfold measurements.
Table 1 Fat percentage-assessing equations investigated in the present study (Mean values and standard deviations)

FM%, fat mass percentage; BIA, bioelectrical impedance; NM, not mentioned; DEXA, dual-energy X-ray absorptiometry; F, foot-to-foot BIA; I, impedance; W, weight (kg); H, height (cm); S, sex; A, age; FFM, fat-free mass (kg); Wh, whole body BIA; TSF, triceps skinfold (mm); SSF, subscapular skinfold (mm); M, sexual maturation; SFS, skinfold sum (TSF+SSF) (mm); FM, fat mass (kg); E, ethnicity.
The following indices were calculated in the present study. Apart from BMI, Rohrer's index (weight (kg)/height (m)3), arm fat area (AFA = (MUAC (cm)2/4π) − (MUAC (cm) − (π*TSF (cm)))2/4π)), waist:hip ratio (WHR = waist (cm)/hip (cm)), waist:height ratio (WHtR = waist (cm)/height (cm)) and the conicity index (ConI = waist (cm)/(0·109 ×  $$\sqrt {weight\,(kg)/height\,(cm)} $$) were also calculated to assess the correlation between these indices and the FMADP%.
Reference method
Air-displacement plethysmography
Body volume was measured by ADP (BOD POD®, Software version 4.2.4, Life Measurement, Inc.) using standardised procedures(Reference McCrory, Gomez and Bernauer21). Children had to refrain from physical activity and food 2 h before the measurement. The BOD POD® was calibrated daily and at each measurement according to the manufacturer's guidelines. Children were assessed in tight-fitting bathing suits with swimming caps to rule out air trapped in clothes and hair. If the first two readings for body volume differed by more than 150 ml, a third measurement was taken and the two values that were closest and within the criteria for agreement were averaged. Thoracic gas volume was predicted by the software with a validated child-specific equation(Reference Fields, Hull and Cheline22). FMADP% was calculated using the up-to-date child-specific conversion factors reported by Wells et al. (Reference Wells, Williams and Chomtho4).
Statistical analyses
Means and standard deviations were given for all measurements and the association with sex and age was tested. As indices were not normally distributed, Mann–Whitney U tests and Spearman's correlation coefficients were employed.
For the first objective, the correlation between anthropometric measurements/indices and FMADP% was determined using age-adjusted Spearman correlations.
The second objective was to compare FMeq% using skinfold measurements or BIA (see Table 1) with FMADP%. First of all, the mean difference and standard deviation between FMADP% and FMeq% are given; its significance was determined with a paired t test using Bonferroni adjustment. As the difference is calculated as ‘FMADP% minus FMeq%’, a positive mean difference indicates an underestimation by FMeq%. To compare these results with those of the anthropometric indices, age-adjusted correlations were calculated.
Accuracy and precision were examined using regression analysis. As nine equations were tested separately for boys and girls, the results of eighteen regression analyses were noted. If age was a significant predictor, the results of the multiple regression were given (both FMeq% and age as predictors), otherwise of the simple regression. The FMeq% was considered accurate when the regression between FMADP% and FMeq% did not differ significantly from the line of identity (slope non-significantly different from 1 and intercept non-significantly different from 0). The precision of FMeq% was assessed by the R 2 and the standard error of the estimate (SEE).
The presence of a sex effect on the FM% difference was separately examined by multiple regression analyses with one of the nine FMeq% and sex as predictors each time. To examine whether there was a real sex effect or whether this was induced due to the FM% difference between sexes, an FMeq%–sex interaction term was included as an extra variable in this regression.
Bland–Altman analysis was used to examine the agreement between FMeq% and FMADP%. Apart from the 95 % limits of agreement (LOA), the presence of a direction (heteroscedacity: upwards/downwards) or dispersion (convergent/divergent) trend across the range of fatness were also examined. A downwards or upwards direction trend was present if there was a significant univariate regression line between ‘FMADP%-FMeq%’ and the mean values of FMADP% and FMeq%. A potential dispersion trend (convergent/divergent from the zero point) was visually evaluated. As the difference was calculated as ‘FMADP% minus FMeq%’, an upwards Bland–Altman line indicates an underestimation by FMeq% in children with a higher fat mass (if the Bland–Altman regression line goes through the zero point). A convergent dispersion trend demonstrates more FM% agreement between both methods with increasing FM%, while a divergent trend shows more disagreement with increasing FM%.
Finally, single-measure intraclass correlation was calculated as an interchangeability measure using a two-way mixed model with absolute agreement. Interchangeability has been suggested to be excellent when the intraclass correlation coefficient is higher than 0·75 (Reference Fleiss23).
All statistical analyses were performed using SPSS/PASW version 19 (IBM Corporation). To correct for multiple testing when using the FM% equations, a Bonferroni correction was applied with a P-value of 0·003 (0·05/18; nine equations × two sexes = eighteen tests) as the threshold of significance. For all other analyses, the two-sided level of significance was set at < 0·05.
Results
Descriptive data on the study population are shown in Table 2. Boys and girls were non-significantly different in age. Girls had a higher FMADP%, arm circumference, skinfold thickness, AFA and Rohrer's index, but a lower impedance index and a lower WHR. For measurement results, anthropometric values increased with age, except for a negative trend in impedance and no trend in FMADP%. Based on the BMI z-scores, 6·7 % of the present population was overweight, with FMADP% ranging between 6·27–37·35 % for boys and 9·31–45·14 % for girls.
Table 2 Descriptive statistics for the study population and age and sex differences (Mean values and standard deviations)
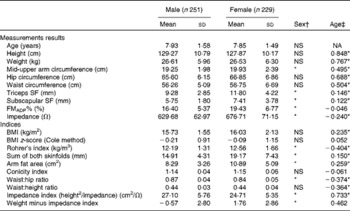
NA, not applicable; SF, skinfold; FMADP%, fat mass percentage with air-displacement plethysmography.
* Mean values were significantly different (P< 0·05).
† Mann–Whitney U test.
‡ Spearman's correlation coefficient.
Table 3 gives the age-adjusted Spearman correlations between FMADP% and calculated indices stratified by sex. All correlations were highly significant, except for WHR and impedance index in boys. All correlations were higher in girls than in boys. For both sexes, sum of both skinfold thicknesses showed highest correlation, followed by TSF, AFA and SSF. The lowest correlation coefficients were found for ConI, WHR and impedance index. The remaining indices (Rohrer's index, BMI, BMI z-score, WHtR, MUAC, ‘weight minus impedance index’, hip and waist) had similar intermediary correlations (coefficients between 0·447 and 0·699).
Table 3 Age-adjusted Spearman correlations (r) of anthropometric measurement data and indices with BOD POD fat mass percentage, stratified by sex
Some indices were calculated using the same measurement data. First of all, WHtR performed better than WHR and ConI and slightly better than waist circumference. Second, Rohrer's index and BMI had similar correlational strength. Third, AFA gave very similar results as the TSF, but somewhat better than MUAC. Finally, ‘weight minus impedance index’ was preferred to the impedance index itself. This result of ‘weight minus impedance index’ was not caused purely by the correlation of weight with FM%, as the latter was only 0·148 and 0·393 in boys and girls, respectively (data not shown in table).
In Table 4, FMeq% of published equations was tested against FMADP%. Overall, better results were obtained in girls, although no real sex difference existed when ranking on validity.
Table 4 Comparison between fat mass percentage with air-displacement plethysmography (FMADP%) and fat mass percentage assessed with equations (FMeq%), stratified by sex (Mean values and standard deviations)
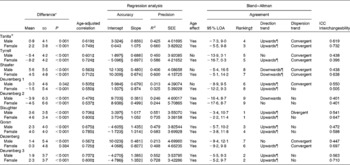
ICC, intraclass correlation; SEE, standard error of estimate; LOA, limits of agreement.
* FMADP% − FMEq%, paired t test with Bonferroni correction.
† Ranking on interval width stratified by sex.
‡ Correlation with significant P-value.
§ Significantly different from 0.
∥ Significantly different from 1.
¶ Maintained significance after correction for age.
First, we investigated the sex and age effects. Analyses were stratified by sex, as several FMeq% (Tanita®, Tyrrell, Shaefer, Deurenberg 2 and Deurenberg 3) showed a significant sex effect (data not shown). After correction for the FM%–sex interaction, the sex effect disappeared in the Deurenberg 2 FMeq% (data not shown). An age effect was also found in most FMeq%, except for the Tyrrell, Shaefer and Deurenberg 1 FMeq% in boys.
When analysing the mean difference, both over- and underestimation occurred, although Tyrrell predominantly overestimated FM% in girls. Using regression analysis, best accuracy was reached with the Tanita® FMeq% in girls, as there was no difference from the line of identity (intercept = 0 and slope = 1). Furthermore, no significantly different slope could be detected for the FMeq% of Slaughter and Deurenberg 1 in girls. Precision was best (high R 2 and low SEE) in Slaughter and Deurenberg 3, while worst in Deurenberg 1 and 2.
Furthermore, Bland–Altman analysis was used to analyse agreement on individual level. Agreement was highest (small 95 % LOA) in Slaughter and second in Deurenberg 3, while lowest in Deurenberg 2. Only the Deurenberg 2 for both sexes and the Tyrrell and Dezenberg for boys had no direction trend across the range of fatness after adjusting for age. Most other FMeq% gave an upwards trend with more FM% underestimation in heavier children, although an overall downwards trend was present for the Schaefer FMeq%. As a convergent dispersion trend was seen in half of the FMeq%, the agreement with FMADP% increases with increasing FM%. Nevertheless, the Slaughter FMeq% in boys had a divergent dispersion trend.
Highest interchangeability (high intraclass correlation) was seen in the Tanita® FMeq% and second in Deurenberg 3 FMeq%. On the other hand, overall lowest interchangeability was observed for the Deurenberg 2 FMeq%. Nevertheless, in neither occasion, the 0·75 cut-off to gain excellent interchangeability was reached.
When comparing the age-adjusted correlation coefficients of Tables 3 and 4, the ‘weight minus impedance index’ obtained lower results than those of the FMeq% based on impedance, and approximately the same coefficients were retrieved for the sum of both skinfold thicknesses and both the Slaughter and Deurenberg 3 FMeq%.
Discussion
In the present study sample of children aged between 5 and 11 years, girls had higher adiposity, and most anthropometric measurements were dependent on the child's age as their body is still growing. In contrast, no age differences in FMADP% were seen.
Skinfold thicknesses showed the best correlation with FMADP%. As indicated in literature, the age-adjusted correlations were highest for the sum of TSF and SSF thicknesses, followed by the TSF(Reference Freedman, Wang and Ogden24). This is also reflected by the frequent use of sum of skinfold thicknesses in published equations (see Table 1). If skinfold measurements are not feasible, the ‘weight minus impedance index’ can be used. As the impedance index is inherently a fat-free mass marker, the ‘weight minus impedance index’ resulted in higher correlations with FMADP% than the impedance index itself. Indeed, skinfold thickness is preferred above impedance, as skinfold measurements are a more direct way of measuring FM.
Indices combining different measurements are not necessarily preferred. First, the ConI was one of the worst performing indices, as was also shown in previous research(Reference Candido, Freitas and Machado-Coelho25). Second, the combined AFA index did not show a better correlation compared to the raw TSF(Reference Chomtho, Fewtrell and Jaffe26) and the WHtR was only slightly better than the waist circumference. The combined index WHR was considerably inferior to the WHtR, as literature showed that WHR is less suitable in measuring abdominal and total fat, also in children(Reference Corvalan, Uauy and Kain27). Still, we need to keep in mind that waist, WHR, WHtR and ConI are specifically reflecting central adiposity and therefore correlate less with total adiposity(Reference Taylor, Jones and Williams28). Overall, the present findings are the first to replicate these literature findings(Reference Candido, Freitas and Machado-Coelho25) in the present Belgian childhood population, i.e. higher correlations in girls because of their higher prevalence of adiposity and best correlations for the sum of skinfold thicknesses.
When validating the FM% equations, the present results showed that for BIA, the Tanita® FMeq% was the best performing FMeq%. There was no deviation from the line of identity in girls, and it produced the best interchangeability, a small agreement interval and medium precision. A similar study comparing Tanita® FMeq% with FMADP% also concluded the non-interchangeability with overall underestimation and an upward direction trend(Reference Azcona, Koek and Fruhbeck29). This non-interchangeability on the individual level was published also for obese children with the four-compartment model due to substantial 95 % LOA, even though there was no mean difference(Reference Radley, Cooke and Fuller30). The Tyrrell BIA FMeq% performed somewhat lower and was the only one with an overall overestimation, confirming what was mentioned in their validation paper(Reference Tyrrell, Richards and Hofman16).
For skinfold thickness, the Slaughter and Deurenberg 3 FMeq% performed best in both boys and girls, with high precision (high R 2 and low SEE) and good agreement on the individual level (small 95 % LOA interval). The present skinfold equation results are quite precise, as the SEE values in Table 4 are in the same range as the original published Deurenberg 3 (between 3 and 5 %) and Slaughter (3·7 %) SEE values(Reference Slaughter, Lohman and Boileau17). Nevertheless, both the Slaughter and Deurenberg 3 resulted in an overall FM% underestimation. Previously, the Slaughter equation was successfully cross-validated with underwater weighing by Janz et al. (Reference Janz, Nielsen and Cassady31), with better results for girls and SEE values similar to the present study. Nevertheless, overall FM% overestimation was shown by Paineau when using a three-compartment model with similar 95 % LOA as the present study(Reference Paineau, Chiheb and Banu32), while FM% overestimation in boys and underestimation in girls was shown using underwater weighing with the same direction trend, as observed in the present study(Reference Reilly, Wilson and Durnin33). In the latter study from Reilly, the Slaughter equation showed the best accuracy. The Deurenberg 3 FMeq% has previously shown a similar agreement interval as the present study when comparing with the three-compartment model, although it resulted in an overall overestimation(Reference Paineau, Chiheb and Banu32). In the same study, the Deurenberg 3 FMeq% based on four skinfolds performed best, and the Slaughter FMeq% had a wider agreement interval than the Deurenberg 3 FMeq%. Indeed, also in the present study, the Deurenberg 3 skinfold equation could be preferred above the Slaughter skinfold equation because of the better interchangeability and bias on population level. Other articles cross-validating the Deurenberg 3 based on only TSF and SSF were not found as most researchers used the four skinfold equation.
In conclusion, the Deurenberg 3 equation was the best skinfold equation (although inferior to the index ‘sum of skinfold thicknesses’) and the Tanita® equation was the best BIA equation (even better than the ‘weight minus impedance index’). Furthermore, Dezenberg was the worst performing FMeq% based on skinfold thickness, while the Deurenberg 2 FMeq% based on impedance was the worst performing overall.
When creating a new equation, a certain methodology is performed in a selected population sample. The characteristics of the methodology and the population sample are inherent restrictions to the usefulness of this equation in other studies. First, we will consider the methodology of published equations. For BIA, only equations using the impedance (as we have measured), and not the resistance or reactance, were selected. As only the Tanita® and Tyrrell equations were validated for foot-to-foot BIA, some whole-body equations were also tested. For the skinfold equations, both TSF and SSF are normally included, although the Dezenberg equation was restricted to only TSF. Dual-energy X-ray absorptiometry and underwater weighing are often taken as the reference method, although the four-compartment model is the only ‘gold standard’. Second, it is crucial to consider the population in which the equation was validated. We only selected equations validated in at least a child population. The Tyrrell, Deurenberg 2 and Dezenberg equations were validated in a population with a much higher FM% than the present study, while Tyrrell, Slaughter and Dezenberg were validated in non-European groups and the Deurenberg and Slaughter equations did not fully cover the age range of the present study.
Some of these population and device characteristics (Table 1) can partially explain the performance of the FMeq% in the present population (Table 4). Obviously, the Tanita® equation had the best BIA FMeq%. This can have several reasons: (1) it was validated specifically for the device, (2) the age range of the present study was fully covered and (3) age, sex and weight were considered. Nevertheless, the original Tanita® validation used another reference technique than that used in the present study and population characteristics of their validation study are not available. The Tyrrell equation might be somewhat lower ranked due to its validation population (much higher FM%, also non-European) and another type of the BIA device. As expected, the FMeq% based on whole-body BIA were less appropriate when using data from foot-to-foot BIA, although no general trend in over- or underestimation was seen. Especially, the Deurenberg 2 FMeq% did not fit at all, as its validation population was far more obese and did not totally cover the age range of the present study. In the skinfold equations, Dezenberg FMeq% was the worst, probably due to the exclusive use of TSF thickness (while the sum of skinfold thicknesses performed best in the present analysis) and the population characteristics (mixed population and high obesity level).
As such, caution is needed when using equations, as the prediction equation may have a profound effect on the FM% estimate. Biological (age, FM% and ethnicity) and methodological (foot-to-foot v. whole-body BIA, trained staff and reference method) factors should be considered in choosing a published equation. For example, the Dezenberg equation performed differently between the US and the UK children(Reference Wells34). Furthermore, researchers should be aware that the magnitude (dispersion trend) and direction (direction trend) of the error depend on the FM% of the studied children. Often, we have seen a convergent dispersion trend in parallel with what has been stated in the literature: better FM% prediction agreement with increasing FM%(Reference Bray, DeLany and Harsha35). Overall, the use of prediction equations inevitably confounds the raw measurements with prediction error, even if a similar population is used. We have shown that even the best skinfold equation did not perform better than the sum of skinfolds.
It is noteworthy that none of the best-performing equations (Tanita® and Deurenberg 3) is perfect for overweight detection, as they both resulted in overall underestimation, especially in the high FM% area (an upward direction trend). This direction trend through the FM% range is in accordance with previous findings of Reilly et al. (Reference Reilly, Wilson and Durnin33). They showed no excellent interchangeability with FMADP% and quite broad 95 % LOA intervals: approximately 14, 15 and 16 % FM for Slaughter, Deurenberg 3 and Tanita®, respectively, while the maximum range of FMADP% was on average 33 % FM. Indeed, agreement intervals of 16 and 18 % were previously shown(Reference Wells and Fewtrell6). This indicates that results obtained with these equations should be interpreted with caution on the individual level. Furthermore, the non-interchangeability (based on intraclass correlation) justifies the use of an immobile device like the BOD POD®, despite the higher workload and cost and more complicated survey management.
Strengths and limitations
One of the major strengths of the present paper is the large-scale comparison of equations based on BIA or skinfolds and anthropometric data and indices with ADP, as such a large-scale use of ADP is not always feasible. Consequently, we could formulate recommendations for anthropometric measurements in future field studies with Caucasian children. Furthermore, we used elaborated statistics with analyses stratified by sex, as sex differences were noticed. As such, Bland–Altman trend and age effects were given independently for sex. In addition, age correction was done for the Bland–Altman trend. Finally, the routine anthropometric measurements were highly standardised and conducted by two trained researchers to minimise inter- and intra-observer variability.
Nevertheless, some limitations remain. We could not use the highly recommended four-compartment model as a reference. As we have stated in the introduction, this is almost not feasible in such a large child population due to time, budgetary and participation-rate constraints. Consequently, ADP was used as the criterion method. Nevertheless, the results of this validity study can be confounded by some methodological aspects. First of all, BOD POD® and anthropometrics were not systematically measured on the same day, as BOD POD® measurements were optional and were not performed at school where the field work took place, although we tried to make the appointment in the same week. This could have biased the differences found between the methods for some individuals. Second, thoracic gas volume was estimated rather than measured. Although a child-specific formula was used, measuring it with the breathing tubes delivered with the device will lead to higher accuracy of the measurement. In the validation of the child-specific equation, no significant difference was found with the measured gas volume and a low SEE (0·369) was found, even though this could result in a body fat percentage error up to 2 % fat units(Reference Fields, Hull and Cheline22). Nevertheless, this protocol is difficult and time consuming (because of failure) and could decrease participation rate by anxiety feelings in children. In a previous study, 75 % of all children and adolescents needed at least three trials for estimation(Reference Fields, Hull and Cheline22). Third, the ratio of chamber volume to subject volume is quite large in children and, as such, the BOD POD error might be greater in the smaller than in the older children(Reference Fields and Goran2). Another limitation is that the selection of published equations was restricted by measuring only two skinfolds and by using the foot-to-foot BIA, as many equations use four skinfolds or are based on whole-body BIA. However, the foot-to-foot BIA device is being increasingly used on the field due to its simplicity, and a recent review claimed its non-inferiority to the more complicated whole-body BIA devices(Reference Jaffrin36). Finally, the present relatively low FM% range (6·7 % overweight) restricts the generalisation of the present results to populations with higher FM% and restricts the detection of a Bland–Altman trend across higher FM%.
Conclusion
The present results support the use of the sum of TSF and SSF thicknesses as markers of FM% in Caucasian children when specialised technology like ADP is not feasible. Nevertheless, trained staff is needed for skinfold measurements to reduce inter- and intra-observer variability. Although the Deurenberg equation gave the best results of all skinfold equations, the use of equations should be limited for several reasons: (1) no excellent interchangeability with FMADP% could be detected; (2) equations validated in a different population or with slightly different methodology will result in higher prediction errors; and (3) the magnitude and direction of the error are dependent on the FM%, age and sex of the population. If skinfolds are not feasible due to untrained staff, BIA with the built-in Tanita® equation can be used in Caucasian children. Furthermore, BMI, arm circumference, WHtR and ‘weight minus impedance index’ can be used as parameters for FM% of only intermediary quality. Nevertheless, the higher workload, cost and more complicated survey management of an immobile device like the BOD POD remains justified in large-scale child studies.
The present work was done as part of the IDEFICS Study (http://www.idefics.eu). We gratefully acknowledge the financial support from the European Community within the Sixth RTD Framework Programme Contract no. 016181 (FOOD). N. M. is financially supported by the research council of Ghent University (Bijzonder Onderzoeksfonds). I. S., B. V., K. V. and M. P. are financially supported by the Research Foundation – Flanders. There are no conflicts of interest. All authors made a substantial contribution to this paper based on the three conditions: interpretation of data, manuscript editing and final approval. Furthermore, N. M. did the data collection for BOD POD and anthropometric measurements, the statistical analyses, the literature research and wrote the first manuscript draft. M. P. and K. B. were consulted for their expertise in BOD POD and anthropometric measurements. B. V. and K. V. helped in the collection of the anthropometric measurements. I. S., I. H., S. D. H., K. B., L. L. and L. M. designed the study protocol of both the European and national survey. The authors want to thank the participating children and their parents for their voluntary participation.


