Introduction
Tuberculosis (TB) is among the ten primary causes of mortality from infectious diseases in the world and accounts for the death of approximately 1.3 million people, despite the existence of effective treatment [1]. The World Health Organisation (WHO) launched the End TB strategy aiming to decrease mortality by 95% by 2035, considering mortality rates (MR) from 2015 [2].
Six countries in Latin America concentrate 53.2% of the cases, including Brazil, which has a high MR. Even though the rate of detection of cases in Brazil is greater than 70%, the challenge lies in the conclusion of treatment, which currently reaches 71% [3], therefore, below the recommended rate from the WHO. Such an epidemiological situation worsens mortality caused by TB [Reference Hannah, Miramontes and Gandhi4].
The complexity involving TB control has been influenced by a set of determinants and factors that need to be better understood [Reference Siroka, Ponce and Lönnroth5]. In the literature, a set of biological, behavioral and social determinants [Reference Hannah, Miramontes and Gandhi4, Reference Siroka, Ponce and Lönnroth5], such as poverty, population density and low income [Reference Adamu6], has been associated with TB [Reference Raviglione and Krech7].
Social determinants of health can be used to understand the dynamics of TB [Reference Raviglione and Krech7–Reference Wingfield10]. The human development index (HDI) being interesting because, in addition to revealing the economic dimension, it expresses social conditions by measuring the quality of life in populations [11].
There are suggestions in the literature that the HDI is an explanatory variable of TB [11–Reference Bozorgmehr and San Sebastian14], but few studies have investigated its association with mortality [Reference Hannah, Miramontes and Gandhi4, Reference Rodríguez-Morales and Castañeda-Hernández15]. We question whether risk regions for mortality are associated with regions of poorer human development and the role of space. Therefore, in addition to social conditions, there seems to be an explanation related to the area or environment where TB patients live [Reference Ximenes16]. There are areas in which people are more resilient than in others, which can also explain variations in mortality risks.
Hence, we attempt to evaluate whether geographic regions with underprivileged human development were also associated with elevated risk of TB mortality and whether there are any spatial outliers. Therefore, the main goal of this study was to analyse the spatial pattern of TB mortality, through the estimation of MR, spatial relative risks (RR) and Bayesian rates (Global and Local, GBR and LBR) of mortality, as well as its association with the HDI (HDI Global and its three dimensions: education, longevity and income). The rationale for the use of RR, GBR and LBR, compared with the use of classical and crude MR, is that RR Prates et al. [Reference Prates, Kulldorff and Assunção17] and GBR and LBR Best et al. [Reference Best, Richardson and Thomson18], Marshal [Reference Marshall19], Tsutakawa [Reference Tsutakawa20] take into account neighbouring values, using different approaches. These can potentially reduce the effect of high rates in small populations [Reference Marshall19, Reference Tsutakawa20], better discriminating local spatial risks.
Materials and methods
Study design and setting
This was an ecological study [Reference Rothman, Greenland and Lash21], conducted in Curitiba, in southern Brazil (Fig. 1). Curitiba has a territory of 43 742 km2, a population of 1 751 907 inhabitants, a population density of 4027.04 inhabitants/km2 and an HDI of 0.823, ranking tenth among the 5565 Brazilian municipalities [22]. The TB incident rate was 20.9/100 000 inhabitants and mortality was 0.8/100 000 [23], with a coverage of Directly Observed Treatment at around 67%, a cure rate of 67.4% and an abandonment rate of 12.8% [24].

Fig. 1. Spatial units and geographical location of Curitiba, South of Brazil.
Geographical unit for spatial approach
All 138 Human Development Units [22], in this study named spatial units (SU), in the city were taken into account. These geographical areas, developed by United Nations Development Program (UNDP), gather households with greater homogeneity from a socioeconomic point of view, defining SU that better capture the diversity of situations related to human development (Fig. 1).
Study population
Deaths caused by TB (A15.0 to A19.9, CID-10), recorded in the Mortality Information System between 2008 and 2014.
Study variables
As already stated, MR, RR and GBR and LBR, respectively of TB mortality were considered as dependents variables (DV) and as alternative approaches.
For each space unit, MR was computed considering the ratio between the number of TB deaths and population.
For each space unit, RR was computed based on spatial scan statistics, considering TB deaths and population size, in accordance with Kulldorff [Reference Kulldorff25, Reference Miranda26]. This RR is based on a comparison between inside distribution in each SU and outside (all domain), both assuming Poisson distributions [Reference Kulldorff25].
The Bayesian rate is a method that can be used to create spatially smoothed estimates, which are especially useful in the presence of sparsely populated areas with few (or zero) cases (which often generate extreme rate values). It can be adopted when the frequency of deaths is assumed to have a Poisson distribution with a mean proportional to population size [Reference Marshall19, Reference Tsutakawa20].
As this methodological subject is very sensitive (spatial estimation in small areas problems), these different methods were used, frequentist and Bayesian methods, privileging local or global neighbours. RR, as defined by Kulldorff [Reference Kulldorff25], will allow to obtain a ratio of observed/expect considering all domain. On the other side, Bayesian rates ‘correct’ each rate by doing a weighted average of internal rate and external rate. This external rate can be globally defined – global mean (GBR) or locally defined (the mean of the direct neighbours) and the weights are proportional to population sizes (internal and external) [Reference Best, Richardson and Thomson18–Reference Tsutakawa20]. The comparison of different approaches will allow to better discuss the obtained results (in a TB perspective).
The HDI and its dimensions were obtained from the Atlas of Human Development [22], developed by the UNDP. HDI presents values ranging from 0 to 1: very low (0–0.499), low (0.500–0.599), moderate (0.600–0.699), high (0.700–0.799) and very high (0.800–1), higher values being associated with better conditions of social development. The definition of HDI and its dimensions are presented in Table 1 [22].
Table 1. Human Development Index and its dimensions

Source: Adapted from the Atlas of Human Development- PNUD (2013).
Human Development Index-Education (HDI-E); Human Development Index-Longevity (HDI-L); Human Development Index-Income (HDI-I); Human Development Index-Global (HDI-G), R$: reais, Brazilian currency (R$).
Plan of analysis
Firstly, the addresses were georeferenced in the projections SIRGAS 2000 UTM 22, in the south, after obtaining the geographic coordinates (latitude and longitude) in the freely accessible software Google Earth. Cases with incomplete addresses were excluded.
As a first approach, descriptive analyses were carried out, complemented by thematic maps to visualise the spatial distribution of the independent variables (HDI-G, HDI-E, HDI-L and HDI-I). Quintiles were used to define the classes. Spearman correlation coefficients [Reference Rothman, Greenland and Lash21] between DV (MR, RR, GBR and LBR) were computed.
Purely spatial scan statistic was used to identify high-risk clusters, which was used considering the null hypothesis that there is no cluster in a region and the alternative hypothesis is that there is an elevated statistically significant risk inside a region as compared with outside. The maximum likelihood is the most likely cluster [Reference Kulldorff25]. The following parameters were adopted: 50% of the risk population [Reference Kulldorff25, Reference Miranda26], 999 replications and the discrete Poisson model. Similar parameters were used to identify the risk cluster for GBR, LBR, HDI-G and its dimensions, but assuming a Normal Distribution (continuous variables).
To calculate Moran's Indexes, a spatially-weighted matrix was created by contiguity (W ij), ‘queen contiguity weights’, considering those having common borders [Reference Druck and Camara27] as neighbours and adopting a second-order contiguity criteria.
Moran's Global [Reference Anselin28, Reference Anselin29] bivariate Index [Reference Anselin29, Reference Anselin, Syabri, Smirnov and Anselin30] was used to ascertain the spatial autocorrelation between DVs (MR, RR, GBR, LBR) and independent variables (HDI-G, HDI-E, HDI-L and HDI-I). This index shows the degree of autocorrelation with values that range from −1 to 1, in which a positive result indicates a direct correlation and a negative result indicates an inverse correlation [Reference Anselin28, Reference Anselin29]. No spatial dependence assumes value zero [Reference Anselin28–Reference Anselin, Syabri, Smirnov and Anselin30].
The Moran Local Indicator Spatial bivariate (LISA-B) was used to check intra-area spatial autocorrelation [Reference Anselin28–Reference Anselin, Syabri, Smirnov and Anselin30]. This analysis can be considered a decomposition of Moran's I Global bivariate and ‘gives an indication of the degree of linear association (positive or negative) between the value for one variable at a given location and the average of another variable at neighboring locations’ [Reference Anselin, Syabri, Smirnov and Anselin30]. This method allows the identification of high-high, low-low, low-high and high-low [Reference Anselin28–Reference Anselin, Syabri, Smirnov and Anselin30] clusters, showing correlations between DV of each space units and the neighbours HDI as well as their dimensions.
Type I error was established at 5% (P < 0.05) for all the tests. The analyses were performed using the Terraview 4.2.2, SaTScan 9.4.2 and Geoda 1.0.1. Thematic maps were developed using Arcgis 10.2.2 [23].
The study was approved by the Institutional Review Board at the University of Sao Paulo under CAAE No. 64515717.93001.5225.
Results
There were 112 deaths caused by TB, 109 (97.3%) of which were georeferenced and three were excluded because the addresses were incomplete. Four cases (3.6%) were addressed in a home shelter for homeless in the central region. The MR varied significantly among the space units (minimum–maximum: 0-25.24/100 000 inhabitants), with a mean of 1.07 (standard deviation 2.66). Twenty-seven (19.56%) space units had no deaths recorded. The corresponding values for RR were 0–27.46, 1.20 (2.99), for GBR were 0.49–1.66/100 000, 0.90, (0.19) and for LBR were 0–6.59, 0.98 (0.80) (Fig. 2). Spearman correlation coefficients between the DV were MR × RR = 0.999, MR × GBR = 0.663, RR × GBR = 0.661, LBR × MR = 0.588, LBR × RR = 0.591, LBR × GBR = 0.567 (P < 0.001 for all).

Fig. 2. Distribution of mortality rates (MR), spatial relative risks (RR), global Bayesian Rates (GBR) and local Bayesian Rates (LBR) due to tuberculosis in space units of Curitiba, Brazil.
The distribution of the HDI and its dimensions in the city is presented in Fig. 3, where the darker areas are related to critical conditions and lighter areas indicate high HDIs. Lower levels of human development were found clearly concentrated in the south and in the peripheral areas of the city bordering rural areas.

Fig. 3. Distribution of the human development index- HDI and its dimensions in Curitiba, Brazil.
Considering RR, one high-risk cluster of TB mortality was identified in the south of the city (RR = 2.64, P < 0.05). This cluster (same area) was also identified using the LBR. GBR and HDI-I did not present significant high-risk clusters. Areas of higher risk were situated in peripheral areas of the city, concentrated in the south and some in central areas, four deaths occurred in the central area among homeless living in public shelters, which increased the rates and RR of two SU (Fig. 4, Table 2).

Fig. 4. High-risk clusters of mortality due to tuberculosis and for Human Development Indexes: HDI-Global, HDI-Education and HDI-Longevity, in Curitiba, Brazil.
Table 2. Characteristics of high-risk cluster of mortality due to tuberculosis and of Human Development Indexes: HDI-G, HDI-E, HDI-L and HDI-I
a (35 cases inside); Mortality Rates (MR); Local Bayesian rates (LBR); Human Development Index-Global (HDI-G); Human Development Index-Education (HDI-E); Human Development Index-Longevity (HDI-L); Human Development Index-Income (HDI-E); Relative Risk of mortality (RR).
High-risk clusters of HDIs are presented in Fig. 4, characteristic information about the clusters are presented in Table 2. Higher values of HDI (associated with better conditions) under indexes were located in the central region of the municipality, while the southern region presented two risks clusters, one for both HDI-E and HDI-L. For HDI-I, no cluster was identified and HDI-G presented a risk cluster in a different region, near the central area, where better and worse life conditions coexist nearby.
We have found by the Bivariate Moran's I Global, that MR, RR, GBR and LBR were negatively correlated with HDIs in Curitiba (Table 3). Although not strong, these coefficients were statistically significant in the case of MR (HDI-I; P = 0.04). In the case of RR, these correlations were statically significant in HDI-G, HDI-L and HDI-I, just one (HDI-E) was not significant. While all variables were significantly correlated with GBR and LBR.
Table 3. Moran Global bivariate between MR, RR, GBR and LBR of mortality and the indexes: HDI-G, HDI-E, HDI-L and HDI-I in Curitiba, Brazil
Mortality rates (MR); Relative risk (RR); Global Bayesian rates (GBR), Local Bayesian rates (LBR) of mortality; Human Development Index-Global (HDI-G); Human Development Index-Education (HDI-E); Human Development Index-Longevity (HDI-L); Human Development Index-Income (HDI-E).
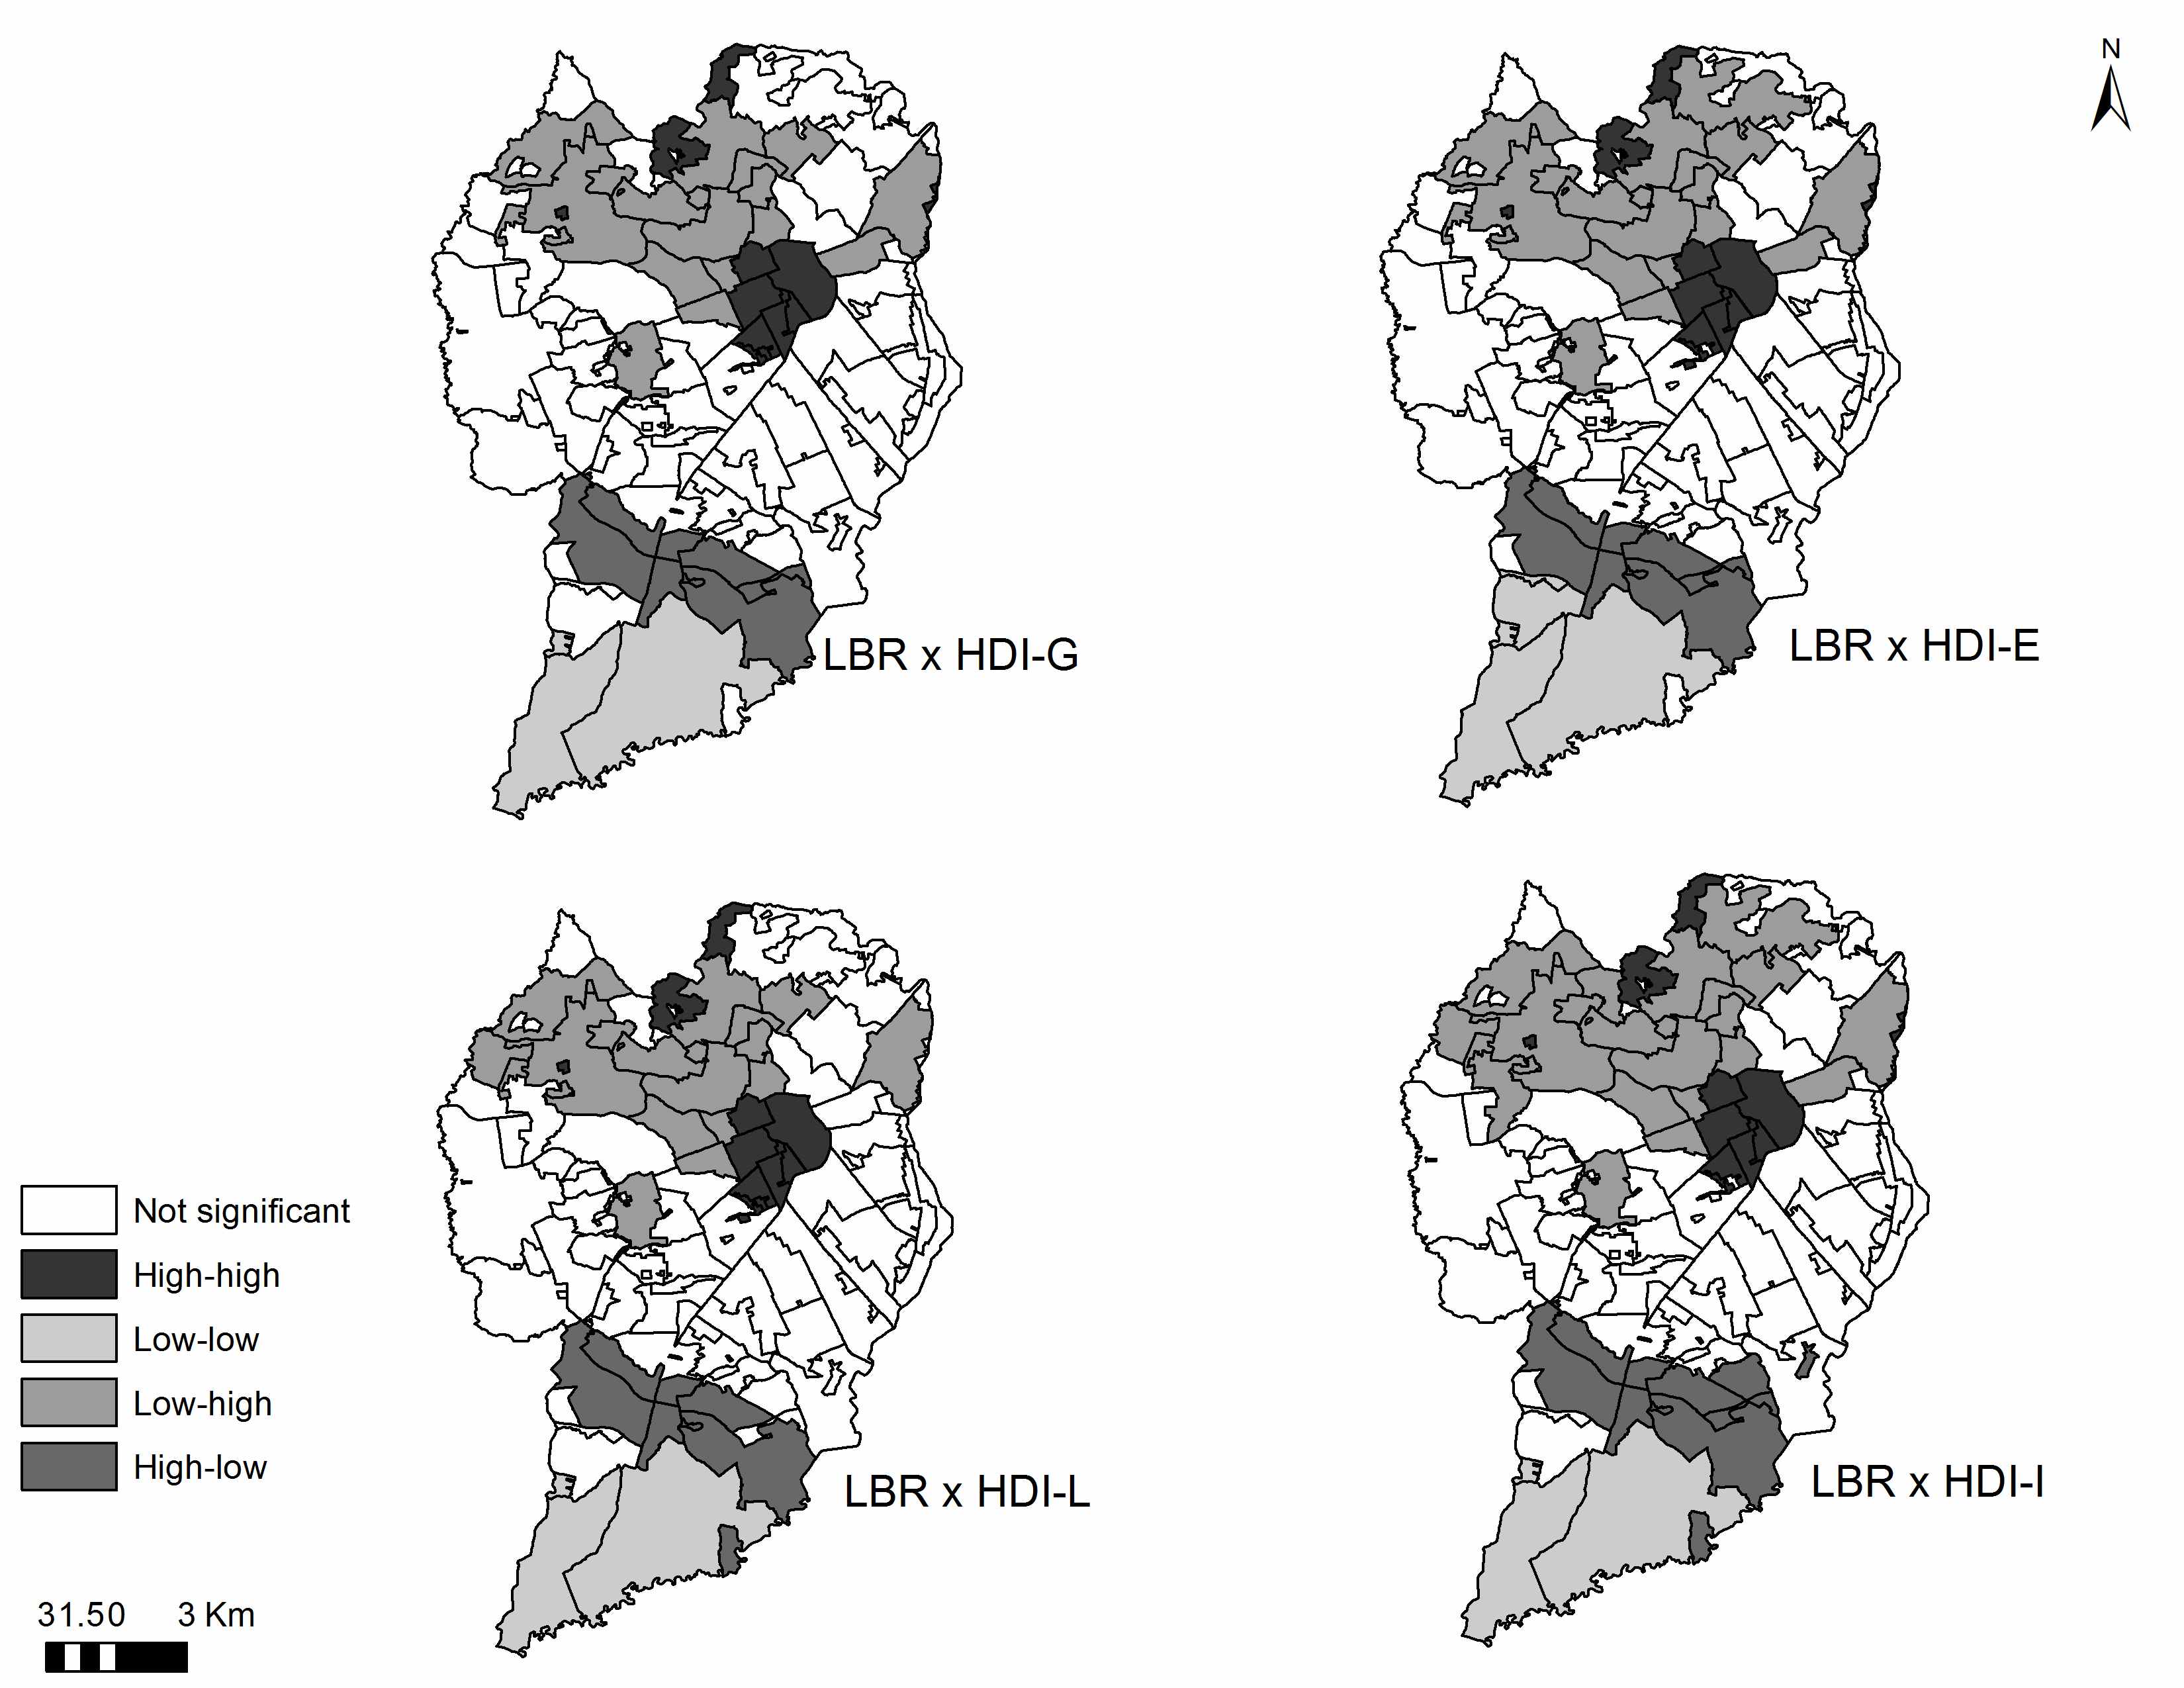
Figure 5 presents the results of the LISA-B of MR with HDIs and their dimensions. The areas in dark grey in the map correspond to a high-high cluster, meaning that areas from this cluster present regions with a high risk for TB mortality, surrounded by areas that present high HDIs.

Fig. 5. Map of Moran Local Indicators of Spatial Association bivariate (LISA-B) of mortality rates (MR) of TB mortality and human development index (HDI), HDI-Education, HDI-Longevity, HDI-Income, Curitiba, Brazil.
The cluster classified as low-low corresponds to geographical areas (light grey), in which a low risk of TB mortality is observed, surrounded by space units that present low HDIs.
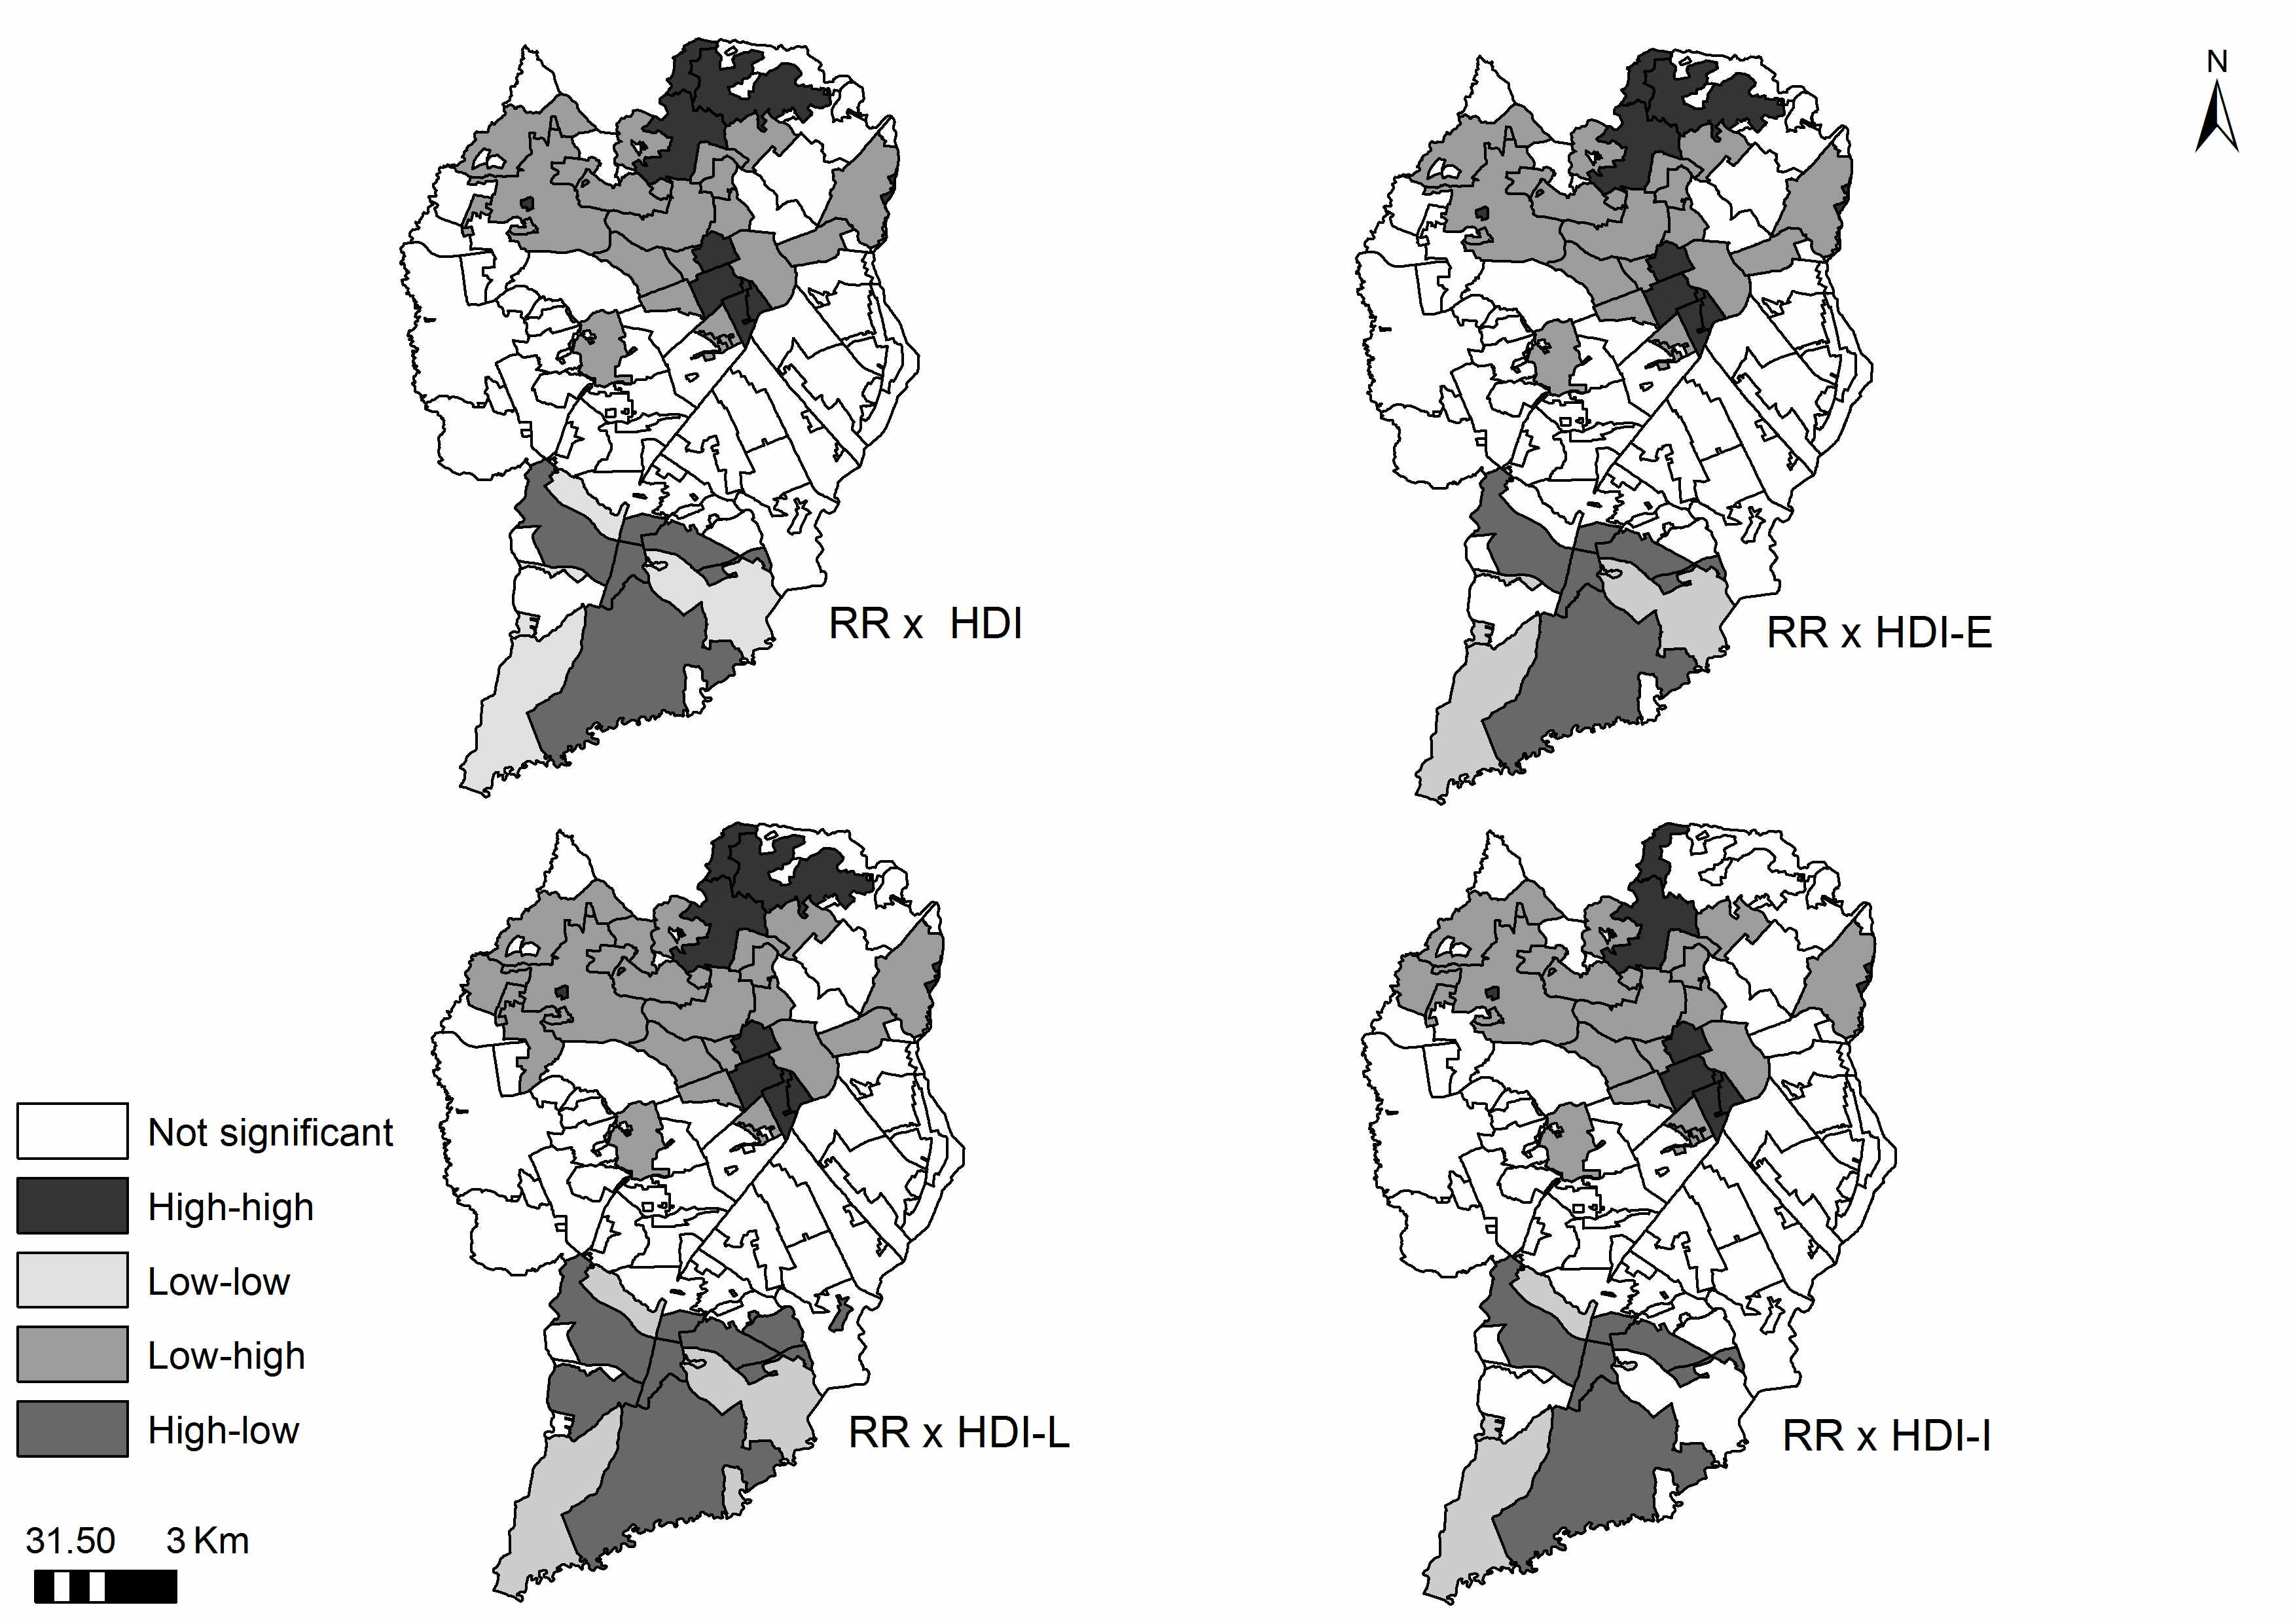
The areas with low-high and high-low clusters present an inverse relationship, in which a low-high cluster presents a low TB mortality risk, surrounded by space units with high HDIs. In this case, the high-low risk of mortality with neighbours with low HDIs, in agreement with Moran's I Global Bivariate results. Similar results were obtained using RR and BR (results not show here and are available in an additional online file).
Discussion
The main goal of this study was to analyse the spatial pattern of TB mortality, through the estimation of MR, RR and BR (Global and Local) and their association with the HDI (HDI-G, HDI-E, HDI-L and HDI-I), in a city of high global human development in Brazil. This can build on previous findings that larger risks of mortality are associated with lower levels of human development in terms of longevity and income.
Globally (considering the different applied approaches), the main conclusion is that there is a negative correlation between human development and mortality from TB, although not strong (globally values range between −0.136 and −0.034). The agreement between these results validates this conclusion. Other studies have reported that higher HDIs decrease the likelihood of TB [Reference Hannah, Miramontes and Gandhi4, Reference Siroka, Ponce and Lönnroth5, Reference Rodríguez-Morales and Castañeda-Hernández15]. It can be expected that improved quality of life and development of regions can decrease mortality risk [Reference Apolinario9, Reference Ximenes16]. The different approaches used have identified income as the most important component (except using GBR).
We also aimed to identify possible high-risk clusters of mortality and of Indexes of Human Development. The south area was the region where the main risk clusters were identified, except for income (no clusters) and HDI-Global (a different area in the middle). It can be explained by one study which stated that there is no simple rule of socio-economic groupings in today's big cities, where there coexist life's better and worse conditions [Reference Cabrera-Barona31]. Thus, it can be seen that for instance in the central region with higher HDIs there occurrences some deaths and high-risk mortality areas (mixed patterns).
Other important observation was regions with low risk of TB mortality surrounded by regions with a low HDI. A potential explanation for such a result in the low-low cluster is based on the study conducted by Curtis (2004) [Reference Curtis32], who analysed inequalities regarding health and TB from a geographical perspective. This study concluded that even areas with poor social conditions may present improved health conditions, depending on social cohesion or solidarity among people, in which case people tend to be more protected. The places where the expected relationship is not seen (the high/high and low/low areas) offer an opportunity to identify other important drivers of mortality.
Another explanation involves the quality of services provided in the regions with important social problems (low HDI): improved services lead to a low mortality risk. The logic of the universal system involves a social protection system and intersectoral policies, operates from a perspective of equality and tends to promote care delivery among individuals according to their needs, providing more intense care to those who need it most and less intense care for those who require less [Reference Gadelha and Costa33, Reference Arcêncio34].
Therefore, through a system of social protection and equality, we seek to recognise the differences in life and health conditions and in regard to the needs of people in order to promote an inclusive process, conferring different levels of health protection in diversified and complex contexts [Reference Siroka, Ponce and Lönnroth5, Reference Miranda26, Reference Arcêncio34]. These aspects have guided the social and health policies in Brazil, acknowledging the needs of more vulnerable groups and working to decrease the impact of social determinants of health that affect such groups [Reference Gadelha and Costa33, Reference Paim35].
Analysis of the region characterised by the high-high cluster (Fig. 4), shows that this area hosts temporary shelters in which homeless individuals have died of TB, which also increased risk in terms of the study. Homeless populations tend to concentrate in the central region of the city and are considered hard to reach [Reference Heuvelings36] and a priority for TB control, as they can affect the distribution of the disease in a region, as observed in this cluster.
Another interesting finding was the comparison of the results using the four DV: with MR only HDI-I was statistically significant, with RR three were significant (all except HDI-E) and BR (local and Global) were correlated with all HDI dimensions. It is worthwhile to notice that all values the Moran Indexes were small and these p-values were all near the significance cutoff value (0.05, maximum of 0.111). In methodological terms, it is interesting to observe that the use of more, smoother estimates increased Moran values and the statistical significance. Other important result is fact that high-risk clusters were precisely the same using MR and LBR. The agreement between these results, take into account the differences between methods, reinforces the relevance of this study.
Note that, in general, studies addressing TB mortality have sought to test its relationship with social determinants while disregarding the spatial dimension [Reference Hannah, Miramontes and Gandhi4, Reference Zürcher8, Reference Wingfield10]. This study shows there is a spatial risk in mortality, i.e. it is not a random process. Rather, it is determined by the risk presented by neighbouring regions. Epidemiological studies have traditionally given little attention to this effect or treated it as a study limitation.
The need to quantify spatial dependency has led to the introduction of interesting methodologies, such as the Moran Global and LISA-B, which enable deeper analysis of mortality. Another contribution of this study is that the SaTScan was used to calculate RR in the areas where the patients lived, being used like a dependent variable, which was very interesting and can be replicated in other studies. RR show a strong relation with MR but with higher Moran values and statistical significance.
The study has confirmed the relation between human development and TB mortality, which contribute to define actions addressed to face the problems. There were divergences in the scientific literature whether social dimension would be related to TB mortality and this study confirmed this hypothesis using different approaches. Additionally, this study revealed an important variation in terms of human development in urban areas in the same city, representing important differences in terms of social opportunities.
Since Brazil has signed with WHO the Strategy End TB, which aims to reduce TB mortality by 95% it is important to promote better levels of education and income, particularly in the problematic areas under study. Recognition that TB mortality is influenced by human development is a large step to advance into this goal.
Additionally, in order to better understand the spatial variation of MR, other variables should be considered in further studies (at individual and at ecological level), namely TB incidence, comorbidities or health service performance
In ecological studies, the definition of the SU is a challenge with implications in results. In this study, this specific SU has two important characteristics: it is the finest scale available - more sensitive to detect local heterogeneities [Reference Veras37] and represent homogeneous social areas. Therefore, although it is impossible to avoid the ecological bias, this SU seems to be able to minimise it.
Conclusion
This study addressed the relationship of the HDI with TB mortality risk. It also shows that, in addition to assessing the HDI, one has to consider the areas in which patients live, because some areas present a low risk despite a low HDI, suggesting the existence of social protective factors not identified in this study. This result reinforces the study's initial hypothesis, that there are risk areas and, in general, they correlate with human development.
The possibility of achieving the End TB goal requires improved social and human development. Unfortunately, there are inequalities within the same city in terms of access to income, education and longevity; thus, one must also consider that the possibility of fulfilling the End TB goal requires one to take into account the possibility of decreasing disparities. Thus, studies addressing TB mortality should not only take a global overview of the phenomenon but also look at areas or localities. Furthermore, the use of LISA bivariate is appropriate to meet this objective.
This study advances knowledge, as it shows the impact of mortality from TB in a Brazilian city, presenting relevant results concerning the determinants of TB mortality.
Supplementary material
The supplementary material for this article can be found at https://doi.org/10.1017/S0950268818001929.