


The prevalence of obesity has tripled in many countries in the European region since the 1980s, and the number of those affected continues to increase at an alarming rate(1). Spain is among the European countries with the highest prevalence in adults(Reference Gallus, Lugo and Murisic2,Reference Rodríguez-Rodríguez, López-Plaza and López-Sobaler3) .
Although an energy imbalance over a long period seems to be the main cause of overweight/obesity, this factor is included in a complex biological system that is set within a complex societal framework in which no single influence dominates(Reference McPherson, Marsh and Brown4). The combination of physiological factors, eating habits, activity levels and psychosocial influences drives excess weight gain in an increasing proportion of the population(Reference Vandenbroeck, Goossens and Clemens5,Reference Vandenbroeck, Goossens and Clemens6) . However, the interactions among the variables related to obesity are poorly understood, and due to this lack of information, designing comprehensive, long-term strategies to fight obesity is challenging.
The EHU12/24 (code of a survey from the University of the Basque Country/Euskal Herriko Unibertsitatea) study addresses these research needs using a university community-based approach. This approach allows us to analyse the aetiology of obesity in a population whose life is governed by a large number of similar patterns, allowing for the more effective control of these variables. The general objective of this research is to investigate the risk factors of overweight/obesity related to lifestyles, particularly those associated with diet, their possible psychosocial influences and the interaction among these factors at different levels to untangle the causal pathways underlying this disease state.
This observational cohort study assesses the prevalence of body fat (BF) excess and major risk of developing overweight/obesity according to a standardised protocol and involved a representative sample of the University of the Basque Country (UPV/EHU) student population. Anthropometric measurements, direct behavioural determinants, such as physical activity (PA) and diet (from a health and environmental point of view), and indirect determinants, such as social/psychological factors, are considered. In particular, in this paper, we present the survey design, instruments, measurements and related quality management. We describe the study sample in terms of its socio-economic and demographic factors and knowledge area and summarise the methodology used to collect the data and obtain the anthropometric measurements.
According to other studies, the prevalence of obesity in the university student population ranges from 17·5 to 37·5 %(Reference Peltzer, Pengpid and Samuels7–Reference Arroyo, Rocandio and Ansotegui10). In addition, obesity appears to be associated with demographic factors (mainly the male sex and an older age), risk behaviours (an unhealthy diet, physical inactivity and alcohol and tobacco consumption), etc.(Reference Peltzer, Pengpid and Samuels7–Reference Cutillas, Herrero and de San Eustaqui9). Nevertheless, to the best of our knowledge, very few studies(Reference Wan Mohamed Radzi, Salarzadeh Jenatabadi and Alanzi11) have assessed the aetiology of obesity in university student populations from a broad perspective (that includes different determinants and their possible interactions), even though this population is particularly vulnerable to inadequate lifestyles, which have consequences on their health status(Reference Downes12,Reference Lorenzini, Betancur-Ancona and Chel-Guerrero13) .
However, as is well known, the specific causes of the accumulation of excess fat differ across population groups and a person’s life course(Reference McPherson, Marsh and Brown4). This variability is an important feature and highlights a range of different solutions. A rigorous analysis of evidence regarding the causation of obesity in the university student population of the EHU12/24 study could permit the identification of several key issues critical for designing strategies for the prevention and control of overweight/obesity. These strategies could take advantage of the naturally occurring opportunities offered by this stage of life (i.e. young adult) to induce behaviour changes. In this sense, taking into account the health benefits(Reference Perignon, Masset and Ferrari14,Reference Springmann, Wiebe and Mason-D’Croz15) of sustainable diets and the high sensitivity of young adults to issues related to the environment(16), we considered studying the dietary habits from the sustainability point of view to acquire knowledge that could allow us to design nutritional interventions that target increasing sustainable eating behaviours. Moreover, university students are likely to constitute a significant proportion of the socio-economic elite of the future; thus, their habits and behaviours are most likely to become the norm(Reference Monneuse, Bellisle and Koppert17), rendering this population interesting to investigate.
Design, subjects and methods
Overall, the EHU12/24 study is an observational cohort study designed to address aetiological questions regarding overweight/obesity and related morbidities in students from UPV/EHU.
Sampling
The present study was intended to generate a representative sample of the UPV/EHU student population(18). The sample was drawn from a list of students enrolled at the UPV/EHU in 2012/2013(18). Assuming that the prevalence of overweight/obesity is 20·6 %(Reference Ruiz, del Pozo and Valero19), the sample size was estimated to be 500 for an absolute precision of 3·5 and 95 % confidence using the EPIDAT 3.1 programme (Dirección Xeral de Saúde Pública, Xunta de Galicia & Organización Panamericana de la Salud. Santiago de Compostela, Coruña, Spain, 2003). Random sampling was used via the following two-stage process: first, a computer randomly selects the subjects according to their knowledge areas and age, and then the subjects are distributed by sex in each knowledge area. In this research, we assigned a weight to each participant such that the computed statistics based on the gathered data could be more representative of the population from which the data are retrieved(Reference West20).
Timeline
The students were assessed according to a standardised protocol between February 2014 and May 2017. The data registration process was planned to avoid data collection during exams to control for external factors that could generate stress or anxiety and affect behaviours, attitudes and weight status.
Study subjects
The present study was conducted according to the guidelines of the Declaration of Helsinki, and all procedures were approved by the Ethical Committee on Human Research of the UPV/EHU (CEISH/193/2013/ARROYO IZAGA). Written informed consent was obtained from all subjects. The students received compensation for undergoing nutritional assessments, including eating habits, body composition and PA assessments, after participating in the study.
The following eligibility criteria for inclusion were established to recruit a healthy population: (1) Caucasian adults (majority ethnic group in this population) aged between 18 and 28 years; (2) no current reported diseases, except for overweight/obesity (the participants could have excess BF), or conditions (such as being an athlete) that may affect the weight, height, frame size and/or body composition; (3) no relation to other participants and (4) in the case of female students, no pregnancy or breast-feeding.
Procedures and survey modules
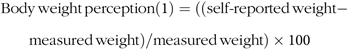
The modules in the present study were selected to cover the assessment of the body composition, including overweight/obesity and co-morbid conditions as the outcome variables and the putative key risk factors. Fig. 1 provides an overview of the major study components. Only instruments suitable for large-scale population-based surveys were eligible, and preference was given to well-proven or validated methods. Questionnaires designed in English were translated into Spanish using the back-translation method (i.e. the questionnaires were translated into Spanish and then translated back into English by a native English-speaker)(Reference Speber21).
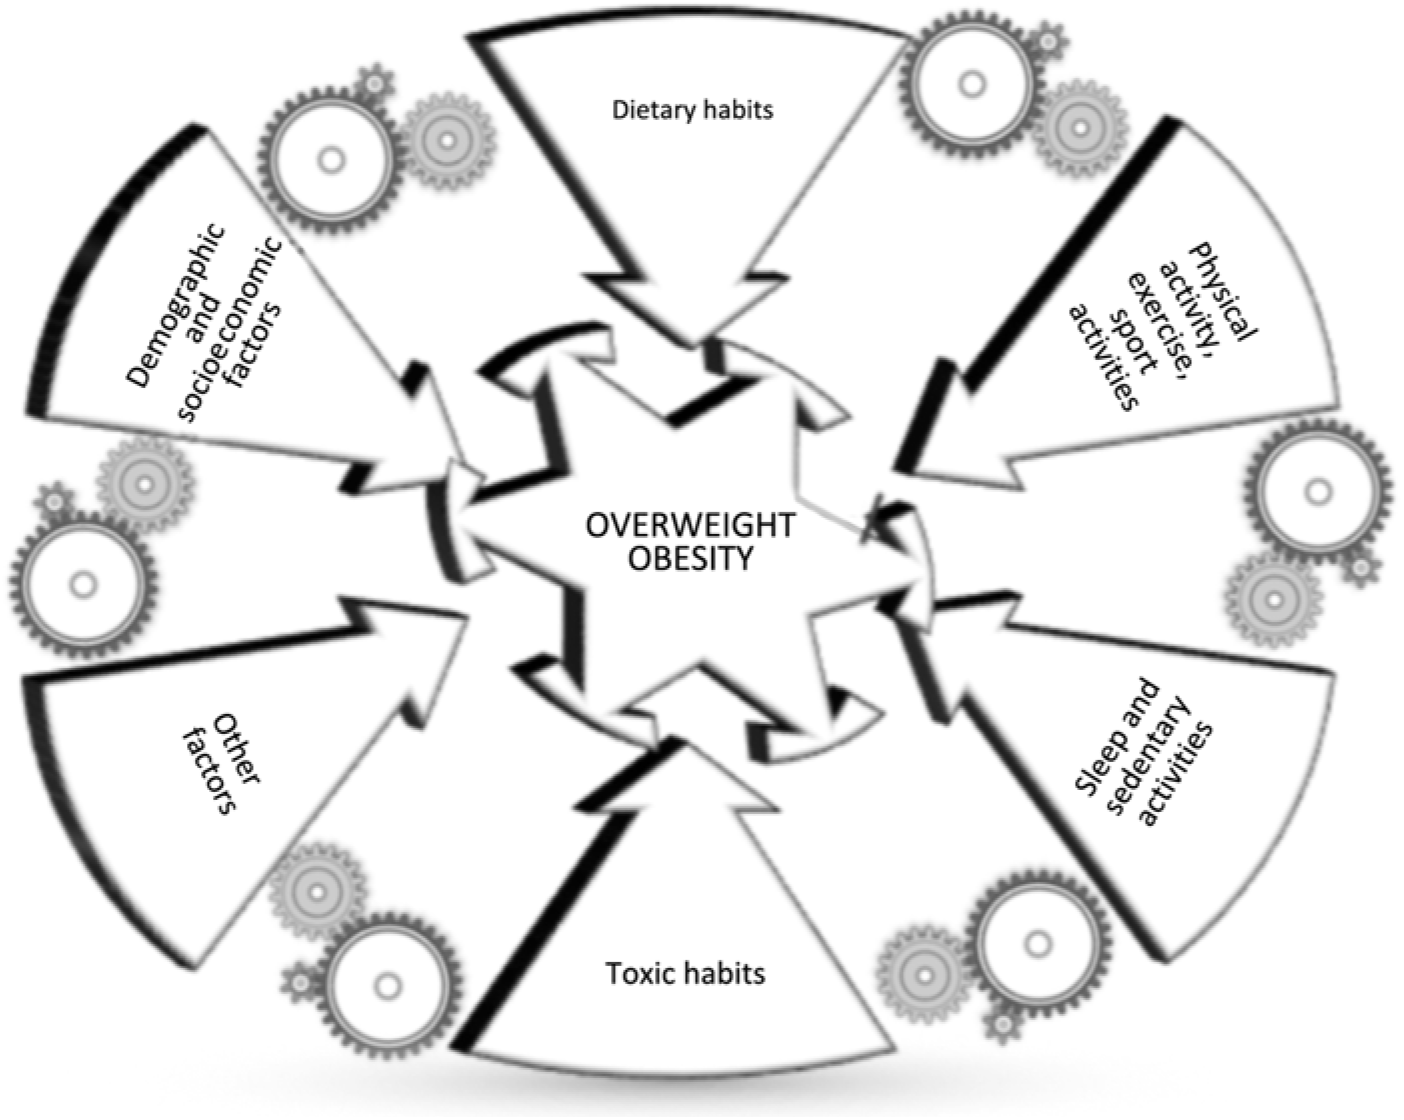
Fig. 1. Design and major components of the EHU12/24 study.
Moreover, each instrument and measurement had to be suitable and ethically acceptable for use in this population and time efficient. The average duration of each assessment was approximately 1 h, and the assessments were preferably divided into 2 d to ensure adequate concentration while answering the questions. The study team established a mobile examination site that moved from faculty/university to faculty/university.
Questionnaires and measurements
The survey modules listed in Table 1 included a face-to-face interview to assess the demographic and socio-economic factors, family and personal history of diseases, academic data, lifestyles, body image and weight assessment, attitudinal factors related to the adoption of a low-fat, low-cholesterol diet, weight control behaviours and nutrition knowledge and perform the anthropometric measurements.
Table 1. Overview of the measurements and variables collected in the EHU12/24 study

PA, physical activity; MET, metabolic equivalents; SDU, standard drink units; CBS, current body size; IBS, ideal body size; RBS, reasonable body size; ABS, attractive body size; CBI, current body image; IBI, ideal body image; FBI, father’s body image; MBI, mother’s body image; ABI, attractive body image; BF, body fat; FMI, fat mass index; FFM, fat-free mass; FFMI, fat-free mass index; WHR, waist:hip ratio.
* Text in italics corresponds to data derived from direct measurements.
Demographic and socio-economic data
This component of the questionnaire included questions related to the age, sex, place of birth of the participants, their parents’ educational level, economic activity and occupation, their parents’ professional category, the number of household members and the number of rooms used for sleeping. All these aspects were registered retrospectively with the National Health Survey(22).
To facilitate the data analysis, the parents’ economic activity and professional category were recategorised as follows: parents’ economic activity (working, retired or pensioner, or other (studying or unpaid leave)) and parents’ professional category (service sector (professionals and technicians, executives and managers, administrative services, hotel industry, services or security); primary sector (agriculture and ranching industry, naval or fishermen); industry sector (qualified industry, construction and transport workers, non-qualified workers or cleaners) and other (housewives, unemployed or retired)).
Based on the number of household members and number of rooms used for sleeping, an indicator of social status, that is, crowding index (number of household members/number of rooms used for sleeping), was estimated. This index was categorised as proposed by Cabrera de León et al.(Reference Cabrera de León, Rodríguez Pérez and Domínguez Coello23) by assigning a value of 0 if the index was higher than 2, 1 if the index was between 1 and 2 and 2 if the index was lower than 1; thus, the lower the score, the higher the social status.
Academic data
In addition to the school year, we recorded information regarding the bachelor’s or postgraduate degree towards which the students were studying. The participants were classified according to the knowledge area of the degree for which they were studying based on the criteria proposed by the Spanish Ministry of Education, Culture and Sport(24) (Arts and Humanities, Sciences, Health Sciences, Social and Legal Sciences, and Engineering and Architecture). The knowledge area was dichotomised into Health Sciences and Non-Health Sciences.
Medical history
The students were asked about their perceived health(22), life quality and stress level(Reference Bennassar25). Their history of personal and family diseases was recorded using the list of the National Health Survey(22,Reference Blackham, Wilson and Sachiko26) . In addition, we recorded the age of menarche because it is related to adiposity(Reference Trikudanathan, Pedley and Massaro27).
Who he/she resides with and sentimental status
Data related to the respondents’ habitual place of residence and sentimental status were recorded using the questionnaire developed by Bennassar(Reference Bennassar25). Sentimental status can be defined as the status of each individual in terms of partner relationships regardless of that person’s legal marital status. Persons who have the sentimental status of a ‘partner’ can live with or without a spouse or partner, while all other persons who have the sentimental status of ‘no partner’ are not a part of a couple.
Dietary intake
Diet was assessed using a short FFQ (SFFQ), which is a modified and validated version of the Rodríguez et al. questionnaire(Reference Rodríguez, Fernández-Ballart and Cucó-Pastor28). The validity and reproducibility of the SFFQ were assessed by comparing energy, nutrients and food intake, the correlations between the intakes derived from two different dietary survey methods (SFFQ and 24-h dietary recall) and the correlations between two different surveys (baseline and second FFQ) (article under revision).
Using this questionnaire, the students were first asked whether they consume each specific item. If the participants affirmed consumption, they were asked about the usual frequency of consumption (daily, weekly or monthly) of one standard serving(Reference Carbajal, Sánchez-Muniz, García-Arias and García-Fernández29). The daily intakes of each food item were determined based on the average consumption frequency and the amount of each food item consumed. For items that included several foods, each food’s contribution was estimated with weighting coefficients obtained from the usual consumption data(30). Then, to estimate the energy and nutrient intake, all food items consumed were entered into DIAL 2.12(Reference Ortega, López-Sobaler and Andrés31), which is a dietary assessment programme. The food intake results are expressed as the daily consumption (g) per 4184 kJ. Moreover, the participants were asked an open question allowing them to report if they had eaten any food or drink not included in the questionnaire during the last month and the frequency. The participants were also asked if they were on a diet and to describe the reasons(Reference Scott and Sachiko32).
To check if the study participants under- or overestimated their dietary intake, we used the method proposed by Goldberg et al.(Reference Goldberg, Black and Jebb33) and updated by Black(Reference Black34), which uses predicted BMR (calculated from age- and sex-specific equations, such as those derived by Schofield, which are most frequently used in dietary studies(Reference Schofield35)) and the ratio of the reported energy intake to BMR to estimate the amount of energy available for activity.
Macronutrients are expressed as a percentage of the total energy intake and were compared with the acceptable macronutrient distribution ranges, that is, ranges associated with a reduced risk of chronic disease that provide an adequate intake of essential nutrients(Reference Serra and Aranceta36). Lipid consumption was evaluated using the nutritional objectives for the Spanish population(Reference Serra and Aranceta36). The method used to evaluate the nutrient adequacy was the estimated average requirements, that is, the average daily nutrient intake level estimated to meet the requirement of half of the healthy individuals in a particular life stage or sex group(Reference Otten, Hellwig and Meyers37,38) . The results are expressed as percentages of the estimated average requirements.
In addition to the adequacy of energy and nutrient intake, adherence to food-based dietary guidelines was evaluated using the Healthy Eating Index(Reference Guenther, Casavale and Reedy39) and the MedDietScore(Reference Panagiotakos, Milias and Pitsavos40). Although specific to US dietary guidelines, the Healthy Eating Index has been widely used in European populations and even in studies involving European university students(Reference Navarro-Prado, González-Jiménez and Perona41,Reference García-Meseguer, Cervera Burriel and Vico García42) which allows us to establish results comparisons.
Moreover, information about meal patterns was recorded using a questionnaire based on validated forms(Reference Bennassar25,Reference Scott and Sachiko32) that included the following: meal frequency, the location where the participants eat on weekdays, whether the participants eat alone or accompanied by others and changes in dietary habits over the weekends.
Furthermore, the participants were asked to describe how they usually ate on an ‘ordinary’ day by specifying the time of meals and choosing the type of meal that best corresponds to their own meal (main meal and snack meal). The aim was to identify all intake occasions, even those consisting of only a drink. Breakfast was identified as a main meal despite usually being a light meal according to the Sociedad Española de Nutrición Comunitaria(43) guidelines, which is similar to the 40-year trends observed in meal and snack eating behaviours in American adults(Reference Kant and Graubard44). Based on the recorded data, the mean time between main meals and between all meals was estimated. Information regarding the person responsible for food shopping and cooking(Reference Bennassar25); the students’ perception of their eating habits, diet quality and daily energy intake; their nutrition knowledge and changes in consumption of twenty specific food groups over the past 5 years was assessed. These last five items were registered using the questions developed by Scott(Reference Scott and Sachiko32).
Furthermore, dietary habits were assessed from the sustainability point of view because according to the scientific literature, sustainable diets can reduce global greenhouse gas emissions (GHGE) and have simultaneous public health benefits, such as reductions in overweight and obesity levels(Reference Perignon, Masset and Ferrari14,Reference Springmann, Wiebe and Mason-D’Croz15) . A literature review was performed using PubMed to identify articles from 2000 to 2015 to identify the quantity of GHGE expressed as kg eCO2/kg in response to each type of food product. The key words used were ‘greenhouse gas emissions’, ‘food consumption’, ‘sustainable diet’, ‘life cycle’, ‘carbon footprint’, ‘cultivated planet’ and ‘environmental impact’. The data were selected by considering the geographical proximity to our environment and were verified by comparing different sources when possible.
To unify the data regarding the life cycle of all products, correction factors were applied to those that did not include the GHGE, corresponding to home transport and/or to waste. Moreover, the food groups were classified according to the same criteria used in other studies investigating the GHGE of diets(Reference Vieux, Darmon and Touazi45), and the food items in each group were selected from the most frequently consumed items listed in the quantitative study of food consumption in the Basque Autonomous Community(30). Therefore, we estimated the kg eCO2 per person and day by considering their dietary intake from the SFFQ and where they eat (at home, in the canteen, etc.), using GHGE data from the literature review.
Regarding the dietary intake, in a subsample of 237 students (44·3 % female), the environmental motives for choosing foods were analysed with a short version of the questionnaire developed by Sautron et al.(Reference Sautron, Péneau and Camilleri46). The original questionnaire included 104 questions divided into four categories (environmental, health and well-being, economical and miscellaneous) predefined by experts and using extensive literature reviews. In the short version, we selected fifteen items related to the general aspects of food purchasing and fifteen questions focusing on the motives for choosing specific food groups (meat, fish, fruit and vegetables and dairy products) from the original items related to environmental questions. The reliability of the short version of the questionnaire was verified using Cronbach’s α. The result was 0·905, indicating strong internal consistency.
Sleep, sedentary behaviour, physical activity, exercise and sport activity
The self-reported sleep duration was ascertained by the following question: ‘On an average school night, how many hours of sleep do you get?’(22). The PA (type of activity, days per week, time per day, main activity during the day and frequency of activity during free time) and sedentary behaviour (SB) (time spent sitting) related data were registered through the International Physical Activity Questionnaire in its short-form version (IPAQ short version)(Reference Gonzalez47).
Furthermore, the current self-reported levels of PA (‘Compared with other people your age, would you say you are physically more active, less active or about as active?’), practice of physical exercise or sport activities, exercise and competitive sports, and type of exercise/sport activity (individual or team sport) were also registered. These data were collected with a survey developed and validated by the Adult Physical Activity Questions on the National Health Interview Survey: 1975–2012(48), and the question reasons why they do not practice any exercise/sport activity was registered following Romaguera’s questionnaire(Reference Romaguera, Tauler and Bennasar49).
Toxic habits
Smoking habit (yes or no, age at start and number of cigarettes per day) and alcohol consumption (yes or no, frequency of consumption and type of alcohol) were registered using the questions from the National Health Survey(22). Moreover, the SFFQ included specific questions about the frequency of intake of the following five major types of alcoholic beverages: beer, wine, cider, aperitif with alcohol and liquor. The alcohol consumption data are expressed as grams of alcohol and standard drink units (SDU) per week(50), weekdays (from Monday to Thursday) and weekends (from Friday to Sunday). In the present study, we used the SDU defined for Spain (one SDU is the equivalent to 10 g of alcohol). With this information, the participants were categorised into non-drinker/moderate consumption and risk consumption categories according to the Sociedad Española de Nutrición Comunitaria criteria, which considers moderate drinking up to one SDU per d for women and up to two SDU per d for men(43). Based on the tobacco consumption, the following subgroups were established: non-smoker, smoker of less than 10 cigarettes/d, smoker of 10–20 cigarettes/d and smoker of more than 20 cigarettes/d(22).
Body image assessment
Body image was evaluated using the figural stimulus method developed by Williamson et al.(Reference Williamson, Womble and Zucker51) and the scale developed by Brownell(Reference Brownell and Sachiko52). The first assessment was developed for estimating body image in studies of obesity. This methodology was based on self-discrepancy theory(Reference Higgins53) and measures a person’s estimate of his/her actual or current body size, ideal body size and reasonable body size.
The second assessment, that is, Brownell’s method(Reference Brownell and Sachiko52), involves a set of eight human figures for the upper part of the body and eight for the lower part developed for each sex. The subjects indicate the figures that best represent how they currently look (current body image), how they ideally wish to look (ideal body image), how their parents currently look (father’s body image and mother’s body image) and how their ideal opposite or same sex person would look depending on their sexual orientation (attractive body image). The discrepancy between the current body image and ideal body image (current body image − ideal body image) was used as a measure of body image dissatisfaction. In addition, the body image dissatisfaction was measured with a Likert scale ranging from 1 (not satisfied) to 7 (extremely satisfied).
Attitudinal factors related to the adoption of a low-fat, low-cholesterol diet
Nutrition attitudes were assessed using a translation of the questionnaire developed by Hollis et al.(Reference Hollis, Carmody and Connor54). This method measures cognitions and behaviours pertaining to the adoption of a low-fat, low-cholesterol diet, and the items load on the following four primary factors: (a) helpless and unhealthy, (b) food exploration, (c) meat preference and (d) health consciousness.
Weight control
Weight control refers to whether effort is exerted to control weight. This aspect was assessed through the Weight Cycling Survey(Reference Brownell and Sachiko52,Reference Pattishall, Hayes and Sachiko55,Reference Wheaton, Perry and Chapman56) , which includes fifteen questions grouped into the following four primary factors: changes in and maintenance of weight, place and frequency of weigh-ins, weight perception and social attitudes, and weight control behaviours.
Nutrition knowledge
The participants completed the Consumer Nutrition Knowledge Scale(Reference Dickson-Spillman, Siegrist and Keller57). The Consumer Nutrition Knowledge Scale provides consumers a chance to show their nutrition knowledge (rather than their lack of knowledge), particularly for those unfamiliar with scientific nutrition terms. We used a translated version of the original questionnaire, and the only adaptation was the use of a usual cheese in this region instead of mozzarella and Gruyère in the following sentence: ‘A sandwich with mozzarella contains as many energy intakes as the same sandwich with Gruyère cheese’.
Anthropometric measurements
A well-trained anthropometrist performed all measurements following the ISAK protocols(Reference Marfell-Jones, Olds and Stewart58). The anthropometrical measurements analysed included the following: weight (kg), height (cm), ileoespinal height (cm), sitting height (cm), circumferences (arm, front thigh, medial calf, waist and hip; cm), breadths (biacromial, biiliac, elbow and knee; cm) and skinfold thicknesses (bicipital, tricipital, subscapular, suprailiac, abdominal, front thigh and medial calf; mm).
Based on the body weight and height data, we calculated the BMI using the formula weight (kg)/height2 (m2). The weight status of the subjects was classified according to their BMI using the criterion of the World Health Organization(59). The percentage of body fat (%BF) was calculated with skinfold data using the Siri-age-sex equation(Reference Siri, Brozeck and Henschel60) as recommended by the Spanish Society of Obesity Research(61), and the density was estimated using the Durnin & Womersley formula(Reference Durnin and Womersley62). The fat mass index (BF (kg)/m2) was estimated from the BF (kg) and height (m). The fat-free mass was derived from the BF% (100-BF%), and the fat-free mass index was obtained as follows: fat-free mass divided by height (m) squared (kg/m2).
The subjects’ %BF was classified using the criteria proposed by Bray et al.(Reference Bray, Bouchard, James, Bray, Bouchard and James63). The regional BF distribution was assessed by the waist circumference, waist:hip ratio and sum of skinfold thicknesses(Reference Tanaka, Itoh and Hattori64). The waist circumference was interpreted using the SEEDO’s criteria(65), and the waist:hip ratio results were interpreted based on the cut-offs proposed by Heymsfield et al.(Reference Heymsfield, Shen, Wang, Bray, Bouchard and James66), which were applied in cases in which the %BF was higher than normal.
The sum of the subscapular, abdominal and suprailiac skinfold was used as an indicator of trunk subcutaneous fat. The sum of the biceps and triceps skinfold thicknesses was used as an indicator of arm subcutaneous fat, and front thigh and medial calf skinfold thicknesses were used as an indicator of leg subcutaneous fat. The skeletal frame size was determined using the measured breadth, that is, biacromial and biiliac breadth for the trunk-frame and elbow and knee breadth for the extremity-frame size(Reference Tanaka, Itoh and Hattori64).
Body weight assessment
The self-report form asked for height (without shoes) in centimetres and weight in kg (without clothes). The self-reported and measured data were obtained on the same day, but the self-reported values were obtained without the participants knowing that they would be subsequently measured. Therefore, the self-reported values are similar to those obtained in an epidemiological study based only on self-reported measures. The individuals were also asked about their desired weight (‘What would you say is your ideal weight?’) and healthy weight (‘What would your doctor say is your ideal weight according to the standard height–weight charts?’)(Reference Pattishall, Hayes and Sachiko55).
The body weight perception and the BMI perception were assessed using the differences between the self-reported and measured weight and BMI(Reference Kuk, Ardern and Church67) as follows:
 $${\rm{Body\, weight\, perception}}\left( 1 \right) = \left( {\left( {{\rm{self-reported\, weight }} - {\rm{ measured\, weight}}} \right){\rm{/measured\, weight}}} \right) \times 100$$
 $${\rm{BMI\, perception = }}\, \left( {\left( {{\rm{self-reported\, BMI }} - {\rm{ measured\, BMI}}} \right){\rm{/\rm measured\, weight}}} \right){\rm{ }} \times {\rm{ 100}}$$
The variables arising from the desired weight and healthy weight were also operationalised as the ‘weight difference percentage’(Reference Kuk, Ardern and Church67).
 $${\rm{Body\, weight\, dissatisfaction \,=\, }}\left( {\left( {{\rm{desired\, weight }} - {\rm{ self-\rm reported\, weight}}} \right){\rm{/self-reported\, weight}}} \right){\rm{ }} \times {\rm{ 100}}$$
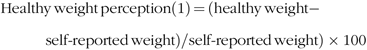 $${\rm{Healthy}}{\mkern 1mu} {\rm{weight}}{\mkern 1mu} {\rm{perception}}\left( {\rm{1}} \right){\mkern 1mu} {\rm{ = }}{\mkern 1mu} {\rm{( healthy}}{\mkern 1mu} {\rm{weight}} - {\rm{self - reported}}{\mkern 1mu} {\rm{weight /self - reported}}{\mkern 1mu} {\rm{weight}}) \times {\rm{100}}$$
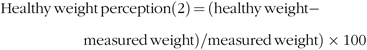 $${\rm{Healthy\, weight\, perception}}\left( {\rm{2}} \right){\rm{ \,=\, }}\left( {{\rm{healthy\, weight }} - {\rm{ measured\, weight}}} \right){\rm{/measured\, weight) }} \times {\rm{ 100}}$$
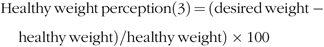 $${\rm{Healthy\, weight\, perception}}\left( {\rm{3}} \right){\rm{ \,=\, }}\left( {{\rm{desired\, weight }} - {\rm{\rm healthy\, weight}}} \right){\rm{/healthy\, weight) }} \times {\rm{ 100}}$$
A ‘weight difference percentage’ greater than or equal to 5 % was considered a meaningful difference. The 5 % cut-off was used in a previous study(Reference Jackson, Wardle and Johnson68) to assess the desire to weigh less using the discrepancy between the desired and actual weight. This method was preferred due to its simplicity and utility(Reference Nianogo, Kuo and Smith69).
Quality management
All measurements followed detailed standard operation procedures that were described in the survey manual and finalised after the pilot study of all modules. All subjects who participated in the study interviews received training sessions. All measurements were performed with the same technical equipment.
We used unique subject identification numbers that were attached to each recording sheet. To check for quality data, subsamples of study subjects were repeatedly examined to calculate the intra-observer reliability of the anthropometric measurements. In addition, the reliability of the questionnaires was checked by re-administering the questionnaires to a convenient sample of study participants. The data set was made available for analysis on a protected central data server. Access to the data is restricted to authorised members of the study.
Statistical analysis
The data were analysed utilising SPSS version 22.0 (SPSS Inc.) and are reported as the mean values and standard deviation and frequencies. The survey results were weighted using weighting coefficients provided by the list of students enrolled in 2012/2013(18). The symmetry of the distribution of the continuous variables was determined by a Kolmogorov–Smirnov–Lilliefors test. The differences between the variables were calculated with the Kruskal–Wallis H test (the variables were not normally distributed due to weighting the data and the large sampling size, thus the small deviations rendered the variables not normally distributed). The categorical variables were analysed using the χ 2 test. The analyses were conducted separately for male and female students because of their differences in dietary intake(Reference Touvier, Méjean and Kesse-Guyot70), other lifestyles(Reference Moreno-Gómez, Romaguera-Bosch and Tauler-Riera71,Reference Alcácera, Marques-Lopes and Fajó-Pascual72) , knowledge area (Health Sciences and Non-Health Sciences) and age variables. This final variable was re-categorised into four subcategories (18, 19, 20 and ≥21 years). The age differences were calculated with respect to the chronological age to analyse the possible differences due to physiological changes (anthropometry and body image) and environment adaptation. All tests were two-sided, and P values <0·05 were considered statistically significant.
Results
Participation
Table 2 provides information regarding the UPV/EHU population, the theoretical sample we achieved, the real sample we obtained, the participation rate by knowledge area and age, the weighting coefficient assigned to each participant, and these data stratified by sex. In total, 696 of the 1300 students who were invited to participate in the study gave their consent and participated, resulting in a response rate of 53·5 % (Table 2).
Table 2. Population and sample of students of the University of the Basque Country (UPV/EHU) by knowledge area, age and sex
(Numbers and percentages)
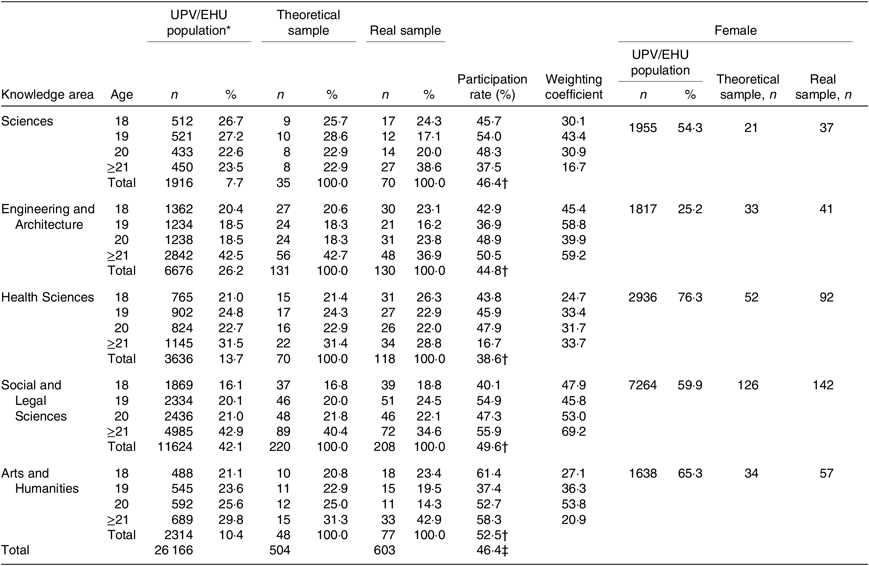
* The sample was drawn from the matriculation list of the UPV/EHU in 2012/2013(18).
† Participation rate by each knowledge area.
‡ Participation rate in the total sample.
To be valid for inclusion in the data analysis, the questionnaire (face-to-face) and anthropometry measurements were required. This requirement was met by 603 study participants, accounting for 46·4 % of all participants invited to participate in the research. In Fig. 2, the number and reasons for participant exclusion are shown.
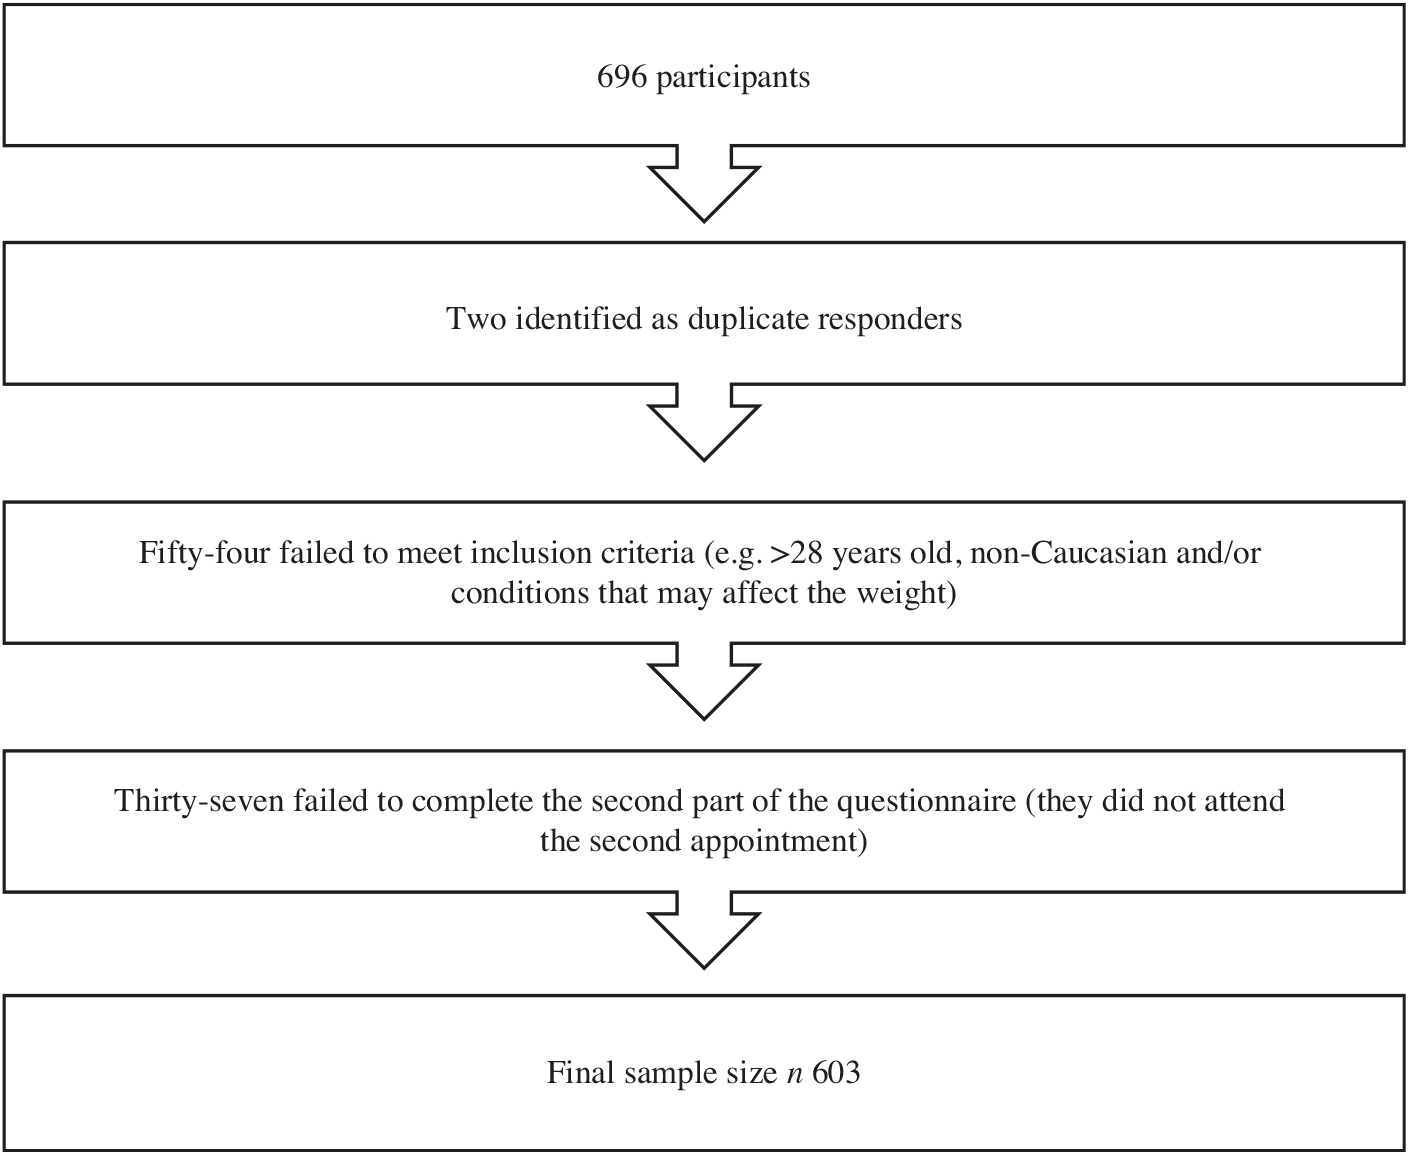
Fig. 2. Number of students excluded based on the fulfilment of various eligibility criteria.
Regarding the knowledge area, the lowest response proportions were in the Health Sciences (38·6 %) and the highest proportions were in the Arts and Humanities (52·5 %) (P < 0·001); this tendency continued when we compared the participation of the Health Sciences and Non-Health Sciences students (38·6 % v. 48·3 %; P = 0·003). Regarding age, the 19-year-old participants were the least represented (20·9 %) and the oldest students were the most represented (35·5 %) (P < 0·001).
Demographic and socio-economic characteristics
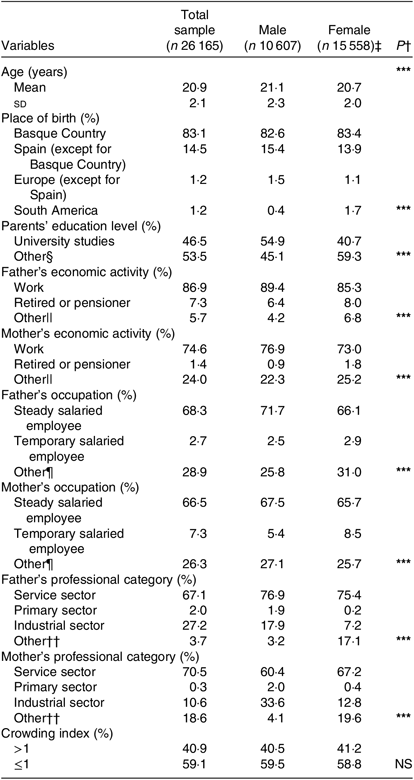
Some demographic and socio-economic characteristics of the study participants are displayed in Table 3. The mean age of the students was 20·9 years, and 59·5 % of the participants were girls. Overall, 83·1 % of the sample were from the autonomous community of the Basque Country, 2·4 % of the participants were from a foreign country and the remaining participants were from other autonomous communities in Spain. There were sex differences (P < 0·001) in all variables (age, place of birth, parents’ education level, economic activity, occupation and professional category), except for the crowding index.
Table 3. Demographic and socio-economic characteristics of the sample: students of the University of the Basque Country (UPV/EHU) by sex
(Mean values and standard deviations; percentages)
*P < 0·05; ** P < 0·01; *** P < 0·001; NS, P > 0·05.
† Sex differences.
‡ Survey results were weighted using the weighting coefficients provided by the UPV/EHU.
§ None of both has university degrees.
|| Being sick for 3 months or more, unemployed, studying, unpaid leave or housewife.
¶ Studying, unpaid leave or housewife.
†† Housewife, unemployed and retired.
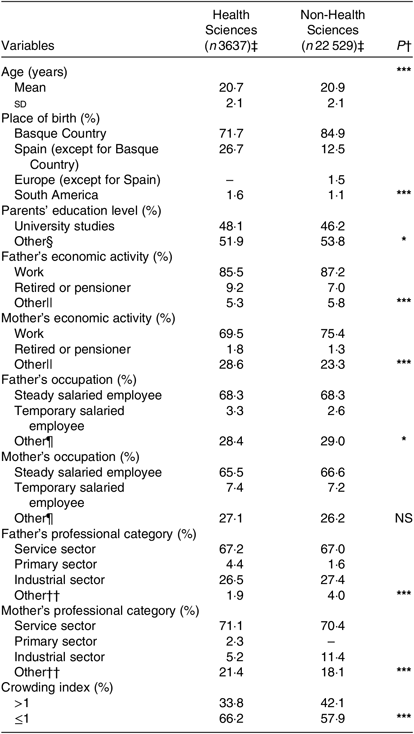
Regarding the demographic and socio-economic characteristics of the students by knowledge area (Table 4), compared with the other students, the Health Sciences students were more likely younger, from outside the Basque Country, to have parents with university degrees and to have a higher social status. Relative to the sex distribution by knowledge area, there were more female students than male students pursuing Health Sciences degrees (18·2 % v. 7·5 %; P < 0·001).
Table 4. Demographic and socio-economic characteristics of the sample: students of the University of the Basque Country (UPV/EHU) by knowledge area
(Mean values and standard deviations; percentages)
* P < 0·05; ** P < 0·01; *** P < 0·001; NS, P > 0·05.
† Knowledge area differences.
‡ Survey results were weighted using the weighting coefficients provided by the UPV/EHU.
§ None of both has university degrees.
|| Studying, unpaid leave.
¶ Studying, unpaid leave or housewife.
†† Housewife, unemployed and retired.
Discussion
The EHU12/24 study was successful in obtaining a large sample of 603 participants, all of whom agreed to participate in the full study protocol (face-to-face interview and anthropometric measurements). The crude participation rate of 53·5 % may seem low compared with some studies involving university students(Reference Moreno-Gómez, Romaguera-Bosch and Tauler-Riera71). However, in our research, this rate is justified because the interview required 1 h of their leisure time and included direct anthropometric measurements without any economic incentives offered to the students. Consideration of this requirement, the proportion of participation may be considered quite good and is similar to that in other studies(Reference Mueller, Blondin and Korn73) involving university students.
Relative to the distribution of the participants by knowledge area, the data are similar to those obtained in a study involving university students in Balearic Islands(Reference Bennassar25), except for data related to students in the Social and Legal Sciences and Engineering and Architecture, because fewer students in the first area and more students in the second area were enrolled in the present study compared with other studies. In the present study, random sampling was stratified by the distribution of knowledge area in the UPV/EHU. In addition, these discrepancies should not affect the comparison of studies because in our research, the knowledge area variable was re-categorised as Health Sciences and Non-Health Sciences, and the two areas mentioned above are included in the same category (Non-Health Sciences). In our study, the Health Sciences students were the least represented, which could be because the object of the study and the type of reward offered are related to the Health Sciences, and studentsof this knowledge area are frequently invited to participate in research studies.
The mean age of our subjects was similar to that in other studies conducted in the UK(Reference Sprake, Russell and Cecil74) and Greece(Reference Chourdakis, Tzellos and Pourzitaki75) but was lower than that in another study with similar characteristics to ours involving university students in different regions of Spain(Reference Ruiz, del Pozo and Valero19). This final result could be due to the exclusion of students older than 28 years in our study given that these students represented 3·0 % of the total sample (and 2·5 % of the UPV/EHU’s population). The age differences by knowledge area found in the present study are due to the weighted sample because small deviations in large samples led to significant differences and the fact that a decimal age was used in this research. In the case of female participation, our data were representative of the UPV/EHU population and slightly higher than those of studies involving representative samples from the Balearic Islands(Reference Moreno-Gómez, Romaguera-Bosch and Tauler-Riera71) and of Almería(Reference Gómez-López, Gallegos and Extremera76).
The place of birth of more than three quarters of the participants was the same community in which the University is located (the Basque Country), which is similar to other studies involving Spanish students(Reference Pastor, Bibiloni and Tur Mari77,Reference Ortiz-Moncada, Norte Navarro and Zaragoza Marti78) , and these data are consistent with annual reports titled ‘The Spanish University in numbers’ published by the Conferencia de Rectores de las Universidades Españolas(Reference Hernández Armenteros and Pérez García79). There are many reasons that could explain the reduced mobility of students in our country as follows: (a) Spanish universities have configured a model of diversified and territorial proximity to students; (b) there are also few scholarships, especially for mobility(Reference Hernández Armenteros and Pérez García79); (c) in the UPV/EHU, it is possible to study all subjects of a bachelor’s degree in Basque and (d) family attachment. The number of scholarships is limited, with fewer scholarships available in Basque than in other European countries with a similar development level(Reference Hernández Armenteros and Pérez García79). The percentage of students from outside Basque Country pursuing Health Sciences degrees was higher than that of students pursuing Non-Health Sciences degrees, which may be because more Health degrees are offered at this university than at the nearest public universities, such as University of Cantabria, La Rioja or Navarra.
Regarding the socio-economic data, the percentage of students’ parents with university education is lower than that observed in data obtained in studies carried out in Sweden(Reference Schmidt80) and northern Greece(Reference Chourdakis, Tzellos and Papazisis81). However, notably, the General Education Law in Spain(Reference Pérez Rúa82) was approved in 1970, and among its fundamental characteristics, compulsory education was provided to the Spanish population between the ages of 6 and 14 years, demonstrating concern for quality education for all; subsequently, the rate of university students has gradually increased. However, our data showed a higher proportion of parents with a university education than that in other research carried out in Spain(Reference Romaguera, Tauler and Bennasar49). Despite both being communities of Spain, Romaguera’s study is performed in the Balearic Islands and currently, the Basque Autonomous Community is a Spanish community with the highest rates of university students, while the Balearic Islands has the lowest(83); therefore, it is likely that the trend was similar 30 years ago. Our parents’ economic activity data were similar to those of the public University of Santiago de Compostela (Spain)(Reference Páramo, Araújo and Tinajero84). These final data could be interesting because some researchers have suggested that the economic level and mother’s studies modulate health behaviours(Reference Ulla Diez and Perez-Fortis85,Reference Gordon-Larsen, McMurray and Popkin86) .
Strengths and limitations
The fact that the present study provides updates regarding a topic with only a few previous studies focusing on the risk factors of overweight/obesity related to lifestyles, especially those associated with diet, in students of the University of the Basque Country could be considered the most important strength.
The main limitations of the present research are as follows: First, the cross-sectional design limits the assessment of causality in the observed associations, and the dietary habits, PA, sport practice, leisure time activity and sedentary behaviour data were self-reported by the students and may be subject to respondent bias. In the case of food intake, these data were self-reported, which could imply under- or overestimation, especially in certain groups characterised by weight status or sex(Reference Gunnare, Silliman and Morris87). However, the SFFQ can provide valid information regarding intake for a large number of nutrients(Reference Fayet, Flood and Petocz88).
Second, the data were collected through face-to-face interviews and, thus, they could be imprecise and prone to bias. However, to reduce the variability due to different interpretations of the questionnaires, all questions were administered by the research team and some guidance was given to avoid misinterpretations. In epidemiological research, participants’ answers are dependent on social desirability, but few databases have extended information about lifestyle in a manner similar to the present study.
Third, all anthropometric measurements were performed by the same person, which considerably reduces the total measurement error. Fourth, although we adjusted for several variables considered important in the analysis of possible associations between variables, we cannot exclude the possibility that other sociocultural and environmental factors that were not considered may have attenuated the associations investigated.
Fifth, regarding the selection of the methodology used to analyse the GHGE related to dietary habits, we did not consider several steps in the life cycles of products, such as cooking the products at home, because of the lack of data regarding this item in many foods studied. Finally, sixth, the findings are based on a sample of university students; the educational level could affect the participants’ lifestyles. Thus, the results may not be generalisable to all people of the same age group. Replicating the present study beyond the university setting is recommended.
Conclusions
In summary, using a set of protocolised measurements, for the first time, the EHU12/24 study generated a large amount of data regarding the determinants of obesity in a community of university students. These data include not only basic indicators of obesity, such as weight, height and other anthropometric measurements, but also healthy and unhealthy behaviours related to this disease, psychosocial influences and possible interactions among these factors. Thus, the EHU12/24 cohort provides valuable data for analyses of the complexity of obesity and the inter-relationships among the determinants of this disease state in university students. Because the period of university studies is an ideal period to promote healthy living, the data collected in the present study could provide further insight into the causal mechanisms and help identify the main driving factors amenable to primary prevention. The authors hope that this report could help other researchers replicate this survey in other student communities in order to easily and accurately compare their results. However, notably, some questionnaires include culturally sensitive topics, such as dietary habits and should be adapted and validated in the population of interest.
Acknowledgements
The authors thank the collaboration of the participants and of the students pursuing bachelor’s and master’s degrees who collaborated by performing their internships in the context of this project.
This work was supported by grants from the UPV/EHU (EHU12/24), the Vice Rector for Innovation, Social Outreach and Cultural Activities of the UPV/EHU, funding by the contract-program formalised with the Basque Government (code of the Campus Bizia Lab project: 17ARRO), the Vice Rector for Students and Employability of the UPV/EHU and Basque Government (2016); and a pre-doctoral scholarship from the Basque Language Vice-chancellor of the UPV/EHU. Neither the UPV/EHU nor the Basque Government played a role in the design, analysis or writing of this article.
The author contributions are as follows: M. A.-I., A. M. R., E. R. and N. T.-A. contributed to the conception and design of the research; M. A.-I. and N. T.-A. acquired and analysed the data, interpreted the results and finally drafted the manuscript. All authors revised the paper and approved the final version of the manuscript.
There are no conflicts of interest.


