Introduction
A significant body of research has been conducted in the past two decades to understand how consumers decide where to shop and the types of foods they purchase. Even though low-income (LI) households' choices are constrained by financial barriers, their decisions about where to shop for food are similar to those of non-low-income (NLI) households. Findings on purchasing patterns of LI households are heterogeneous and difficult to compare and reconcile because of differences in the studies' scope and scale. Understanding the specific factors related to where people shop and what they purchase provides policymakers and practitioners opportunities to understand and appreciate the complexity of consumer behaviors and commensurately consider resource allocation related to changing behaviors.
This study contributes to the literature by exploring where people buy food, and their purchases of specific foods/food categories using three datasets varying in scope and detail. The analysis is focused on a major US region, the Northeast (NE). Results from shoppers' intercept survey data collected at 13 stores in LI areas in nine Northeastern locations were compared with those obtained using secondary household food purchasing data from the Information Resource Incorporated (IRI) Consumer Network Panel (CNP) courtesy of the USDA Economic Research Service (ERS), and food expenditures from the Consumer Expenditure Survey (CES) of the US Bureau of Labor Statistics.
The origin of the work presented here is a 7-year project conducted in the NE, with a long-term goal of determining whether greater reliance on regionally produced food might improve the food security of the region, and the community food security of LI communities throughout the region. In the nine project locations, one or two sites were selected, with a supermarket as the focal point of each site. To assess the type of food outlets chosen by households, we used a shopper intercept survey to identify both the primary and secondary stores patronized by respondents participating in federal food assistance programs (the survey's proxy for LI status) in urban and rural locations. The IRI data were used to measure the frequency of purchases, and the share of food expenditures at different types of food stores by households above and below 200% of the poverty threshold level.
To gain insights on the types of food purchased, we compared the results of the analysis performed on the intercept surveys with those of the two secondary datasets with respect to specific market basket items (MBIs). In particular, we looked at purchasing patterns across demographic characteristics such as education level, income, usage of federal nutrition programs, race/ethnicity, urban and rural residency and presence of children in the household. The MBIs used in the intercept survey encompassed eight food products (bread, milk, ground beef, apples, fresh potatoes, frozen broccoli, canned peaches and cabbage). The purchasing patterns of six products were analyzed in detail using the IRI data. The analysis of the CES data utilized food categories. The results obtained using different data sources are reviewed and analyzed with regard to other findings in the literature.
Literature review
We reviewed the literature that explored retail trends and where people shop as related to household income and rural/urban residency. We also reviewed studies of food purchasing patterns that included any analyses from primary and secondary data sources that were focused on the role of income, education, dietary disparities, children's presence in the household, rural/urban food patterns or race/ethnicity.
Food shopping patterns: where do people shop?
Diversification in the food retail sector offers consumers multiple food-shopping venues, and all income groups employ a multiple store strategy, that is shopping at several stores on a regular basis (Stern et al., Reference Stern, Robinson, Ng, Gordon-Larsen and Popkin2015). Using secondary data from the 2010 Nielsen Homescan Survey, Rahkovsky and Snyder (Reference Rahkovsky and Snyder2015) reported that regardless of income, consumers shop at 11 different food stores over a year's time. Even people with household incomes less than $25,000 travel about 4.8 miles to shop—about the same average miles (5.2) as all households in their sample (Allcott et al., Reference Allcott, Diamond and Dubé2017). A recent industry report also found that on average, consumers shop at 5.4 different formats of grocery retailers (Gabbett, Reference Gabbett2017). Despite these alternative shopping venues, studies consistently find that supermarkets (Broda et al., Reference Broda, Leibtag and Weinstein2009; Alkon et al., Reference Alkon, Block, Moore, Gillis, DiNuccio and Chavez2013; Cannuscio et al., Reference Cannuscio, Tappe, Hillier, Buttenheim, Karpyn and Glanz2013; Ma et al., Reference Ma, Liese, Hibbert, Bell, Wilcox and Sharpe2017; Ver Ploeg et al., Reference Ver Ploeg, Larimore and Wilde2017) or superstores (Taylor and Villas-Boas, Reference Taylor and Villas-Boas2016; Ver Ploeg et al., Reference Ver Ploeg, Larimore and Wilde2017) remain the top choice for food shopping, regardless of household income level, with the latter gaining market share (Stern et al., Reference Stern, Robinson, Ng, Gordon-Larsen and Popkin2015).
Studies reveal a variety of food shopping patterns with moderate variations across different income groups. A small study conducted in Philadelphia found that LI African American women spent a larger percentage of their food budget at limited assortment stores (e.g., Sav-A-Lot, Aldi's) (Chrisinger et al., Reference Chrisinger, DiSantis, Hillier and Kumanyika2018). Using 2005 Nielsen Homescan data, Broda et al. (Reference Broda, Leibtag and Weinstein2009) found that LI and middle-income households are more likely to shop at supercenters than high-income households, and high-income households are more likely to shop at club stores than LI and middle-income households. A more recent report from Ver Ploeg et al. (Reference Ver Ploeg, Larimore and Wilde2017), however, found that supercenters are increasingly popular among all income groups with 44% of households using them for primary shopping compared to 45% using supermarkets.
SNAP and food insecure households report similar shopping patterns as other households (Ver Ploeg et al., Reference Ver Ploeg, Mancino, Todd, Clay and Scharadin2015). Rahkovsky and Snyder (Reference Rahkovsky and Snyder2015) also found similar shopping patterns for low-income/low-access (LILA) and non-LILA households. This finding is not surprising given that nearly 40% of LI people in the USA live in neighborhoods that are not high-poverty neighborhoods (Wilde et al., Reference Wilde, Llobrera and Ver Ploeg2014). Using Homescan and CES datasets, Damon et al. (Reference Damon, King and Leibtag2013) did find that SNAP households varied their food shopping locations once SNAP benefits were depleted; then relied on convenience and drug stores.
Few studies report rural residents' shopping patterns. Using the national dataset FoodAPS, which tracks weekly shopping, Todd and Scharadin (Reference Todd and Scharadin2016) found insignificant differences in shopping locations and frequency between urban and rural households.
A recent case study of five rural grocery stores found that residents spend nearly half of their food dollars at their locally owned store (Peterson and Proctor, Reference Peterson and Proctor2018). Rural areas experience a scarcity of all food store types, with stores that carry the least healthful options the most prolific. Chain supermarkets are far more likely to be located in urban than rural areas, affecting affordability and availability (Liese et al., Reference Liese, Weis, Pluto, Smith and Lawson2007; Powell et al., Reference Powell, Slater, Mirtcheva, Bao and Chaloupka2007; Bustillos et al., Reference Bustillos, Sharkey, Anding and McIntosh2009; Dean and Sharkey, Reference Dean and Sharkey2011; Campbell et al., Reference Campbell, Sharipo, Welsh, Bleich, Cobb and Gittelsohn2017).
Food shopping patterns: what do people buy?
Many factors, including income, participation in federal assistance programs, education, children in the household, rural/urban status and race/ethnicity, are related to what foods people buy. Since purchasing is a reasonable metric of what people consume (Appelhans et al., Reference Appelhans, French, Tangney, Powell and Wang2017), determining food purchases provides a proxy for food consumption. In our intercept survey, we used SNAP as a proxy for income level. Andreyeva's et al. (Reference Andreyeva, Tripp and Schwartz2015) review of 25 studies on the dietary quality of SNAP participants found that they had a lower quality of diet than both income eligible and higher income participants, although caloric and nutrient intake were comparable. Similar to findings from FoodAPS, a national dataset on weekly shopping, Mancino et al. (Reference Mancino, Guthrie and Just2018) found that the nutritional quality of supermarket purchases was lower for SNAP recipients than other shoppers. Looking at the relationship of household income and food purchasing, Rahkovsky and Snyder (Reference Rahkovsky and Snyder2015) found that over 1 year, households located in LILA areas purchased more foods overall, and specifically purchased more red meats, poultry, fish and sodas, and less fruits, vegetables and low-fat milk than non-LILA households.
Two reports published by the National Bureau of Economic Research (NBER)—Handbury et al. (Reference Handbury, Rahkovsky and Schnell2015) and Allcott et al. (Reference Allcott, Diamond and Dubé2017)—provide important insights into food purchasing in LI areas. The first is that the entry of new supermarkets into an area does not change consumer choices. Secondly, combining several secondary datasets to create composite variables, including the IRI dataset, Handbury et al. (Reference Handbury, Rahkovsky and Schnell2015) concluded that levels of education account for more of the variation in the quality of household food purchases than income. More educated shoppers purchased healthier foods more often than those less educated shopping at the same store (Handbury et al., Reference Handbury, Rahkovsky and Schnell2015), a finding that has been reported by others (Rahkovsky and Snyder, Reference Rahkovsky and Snyder2015; Mancino et al., Reference Mancino, Guthrie and Just2018; Ver Ploeg and Wilde, Reference Ver Ploeg and Wilde2018). Using a structural demand model to understand the relationship between income and demand for healthy foods, Allcott et al. (Reference Allcott, Diamond and Dubé2017) found that education accounts for approximately 21%, nutritional knowledge accounts for 7%, and differences in access to healthy foods account for about 5% of dietary differences. A recent study in two LI neighborhoods in Pittsburgh (Vaughan et al., Reference Vaughan, Collins, Ghosh-Dastidar, Beckman and Dubowitz2017) corroborated some of these findings, reporting that educational achievement and being a SNAP recipient predicted food choices much better than where people shop.
Research on the effect of children in the household and food purchasing is mixed. Using secondary data, Rahkovsky and Snyder (Reference Rahkovsky and Snyder2015) looked at LI households with children under the age of 7 and found that they purchased 23% more fruit, 14% more low-fat red meats and 30% more low-fat milk products than households without children. In a study of 550 parent–child dyads with 40% of them classified as LI, researchers found that households with children that perceived cost as a barrier to purchasing produce did not have significantly different fruit and vegetable consumption patterns, by household income level; at the same time, households that spent the least amount on produce weekly also reported fewer daily servings of produce (Mushi-Brunt et al., Reference Mushi-Brunt, Haire-Joshu and Elliott2007).
Living in a rural area may also affect one's diet quality. Rahkovsky and Snyder (Reference Rahkovsky and Snyder2015) learned that rural residents purchase larger amounts of red meat, less low-fat dairy and less produce than urban residents. Using primary data, another study found a small but statistically significant difference between urban and rural residents' fruit and vegetable consumption, with rural residents consuming less (Dean and Sharkey, Reference Dean and Sharkey2011).
Race and ethnicity are other factors to consider. Nielson's (2017) report on food retail and multicultural households noted that multicultural households (defined as Black, American Indian, Asian, Pacific Islander, other and two or more races and Hispanics of any race) spent a greater portion of their total food budget on fresh food categories, especially produce, seafood and meat. These patterns can be further disaggregated with Hispanic consumers spending more on fresh produce, packaged meat and juices; and Asian Americans spending more on seafood, followed by African Americans and Hispanics (Nielson, 2017). African American consumers bought poultry more frequently than any other group (Nielson, 2017).
Some of the Nielsen findings are corroborated in published research on households and race. Zhen et al. (Reference Zhen, Taylor, Muth and Leibtag2009) observed that African Americans, Hispanics and Asians spent more on fish and seafood than whites. Rahkovsky and Snyder (Reference Rahkovsky and Snyder2015) also found LILA African Americans purchased 60% more fish and poultry than white and Asian consumers as well as 31% more red meat. A small study in Houston found that African Americans allocated a greater proportion of their food budget to meat, fish, poultry and eggs than whites (Cullen et al., Reference Cullen, Baranowski, Watson, Nicklas, Fisher, O'Donnell, Baranowski, Islam and Missaghian2007). Another study conducted in Minnesota found that urban, LI African American women buy more meats like poultry and fish compared with other racial/ethnic groups, who spent more on beef and pork (Dammann and Smith, Reference Dammann and Smith2010).
In the produce category, Hispanics (Nielson, 2017) and Asians spend more on fresh produce than whites and African Americans (Cullen et al., Reference Cullen, Baranowski, Watson, Nicklas, Fisher, O'Donnell, Baranowski, Islam and Missaghian2007; Zhen et al., Reference Zhen, Taylor, Muth and Leibtag2009); African Americans purchase 11% more fruit than whites and Asian consumers (Rahkovsky and Snyder, Reference Rahkovsky and Snyder2015), while another study found no differences in produce purchases among racial groups (Dammann and Smith, Reference Dammann and Smith2010). It should be noted that none of these studies accounts for frozen produce sales.
The findings summarized above indicate that different geographic contexts, racial categories, data sources and methodologies will lead to different results. Aside from the superstore finding, the analysis that follows corroborates much of what is known about shopping patterns and provides additional insights into differences in purchasing patterns particularly for race/ethnicity, and their relationship to income, education and other variables.
Methods
Because each dataset offers specific metrics for certain variables, we created a table that describes each variable and how it is measured (see Table 1).
Table 1. Different metrics used by each dataset

Primary data: customer intercept survey—data collection and analysis
Data collection took place at 13 ‘study stores’ in nine project locations across the region from November 2012 to April 2015. The two eligibility criteria were that the store met the Food Marketing Institute (FMI) definition of a supermarket (a store that sells groceries, meat and produce and has at least $2 million in annual sales) and that it stocked all the MBIs. The MBIs consisted of whole and low-fat milk, white and whole wheat bread, regular and lean ground beef, fresh apples, cabbage, potatoes, frozen broccoli with and without sauce, and canned peaches in syrup and in juice. We selected a small number of MBIs because the foods formed the core of what was studied by all three research teams, including production and distribution. As illustrated in Clancy et al. (Reference Clancy, Bonanno, Canning, Cleary, Conrad, Fleisher, Gomez, Griffin, Lee, Kane, Palmer, Park, Peters and Tichenor2017), we chose the specific items for many reasons, including that they would be staple foods for many LI households in the NE.
The study stores were located in urban and rural locations, in zip codes where the median household income was near or below the median income for the state and county. About half of the stores were in zip codes with poverty rates above 20% and all were in counties with participation in SNAP greater than 10%. In all our study locations, the average food insecurity rate was approximately 13% (or higher), slightly above the regional average in 2013 of 12% (Coleman-Jensen et al., Reference Coleman-Jensen, Rabbitt, Gregory and Singh2017). Summary statistics for the demographic characteristics of the surrounding areas of the 13 study stores are reported in Table 2.
Table 2. Study location demographics
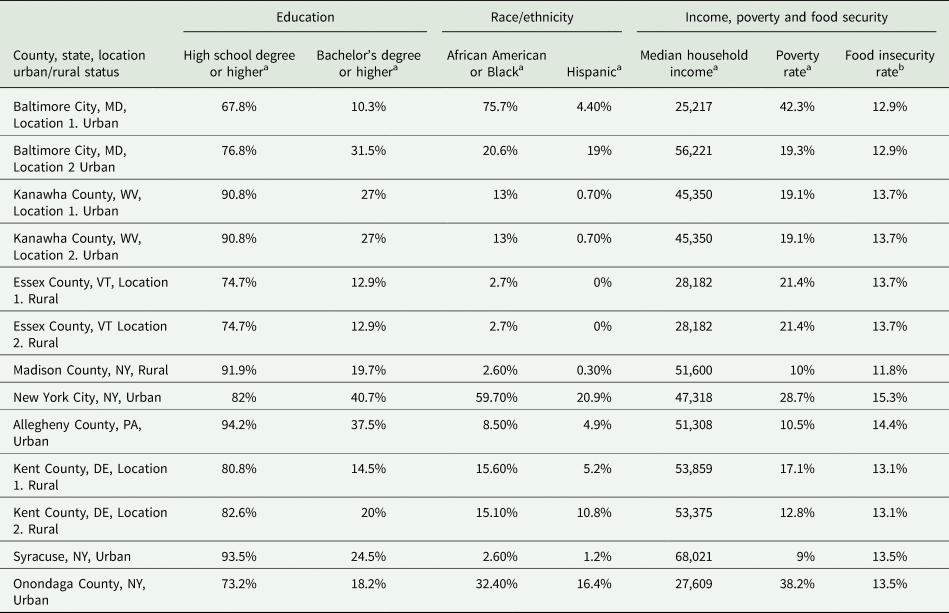
a ZIP-code level data from the American Community Survey 5-Year Estimate, 2010–2014, copied from http://factfinder.census.gov/faces/nav/jsf/pages/community_facts.xhtml on April 27, 2016.
b County-level data From Food insecurity, 2013, FeedingAmerica.org, downloaded from http://www.feedingamerica.org/hunger-in-america/our-research/map-the-meal-gap/data-by-county-in-each-state.html on April 27, 2016.
Project staff used intercept surveys to collect data from customers exiting the study store (n = 1996). Those interviewed were required to be 18 years or older and the primary food shopper in their household. Data collection took place across 9 of the 12 months, in mornings, afternoons and evenings. We included questions about respondents' demographic and household characteristics, including if they participated in any federal nutrition programs such as SNAP, WIC, school breakfast and lunch, where they shopped, and whether they had purchased any of the eight MBIs over the past 30 days. The survey also asked about the store choices of the respondents. The stores that respondents identified as the primary (where they do most shopping) or secondary stores (up to two other stores) were then categorized following the classification from the FMI's (Food Marketing Institute, 2015) food retail segment and Hawkes (Reference Hawkes2008) (see Fig. 1 and the Appendix). T-tests for differences in means allowing for unequal variance of unpaired data were performed on several categories of questions. All analyses were conducted using STATA V. 14.

Fig. 1. Primary and secondary food stores were respondents shopped by FMI Classification—percentage of responses.
Source: Authors elaboration on Intercept Survey Data.
Secondary data: data sources, data manipulation and analysis
IRI Consumer Network Panel data
The IRI CNP collects information on food purchases and demographic characteristics for a sample of more than 100,000 households across the USA (see Muth et al., Reference Muth, Sweitzer, Brown, Capogrossi, Karns, Levin, Okrent, Siegel and Zhen2016, for a discussion of the methodology and the data). The USDA ERS provided the data via a third-party access agreement. The dataset contained food-at-home purchases for multiple years. Sampling weights were available to produce a nationally representative sample, as well as US Census regions for a subsample of the data, the ‘static panel’. The sample was restricted to 12,770 households in the EFNSE NE. Purchases for the year 2012 were aggregated at the annual level, the first year demographic data were available. National population sample weights were used instead of the NE ones, as these are created based on the US Census NE definition, which differs slightly from the EFSNE NE.
Data manipulation: Household demographic attributes available in the IRI data include income, size, race/ethnicity and education of the household head, county of residence and the number of children (by age group). All purchase information in the CNP refers to the entire household because the primary shopper is not identified in the dataset. Household income and size were used to segment the sample into two groups based on whether the household was at or below 200% of the US Census Bureau Poverty Threshold (U.S. Census Bureau, 2012); households at or below this threshold were defined as LI whereas those above were NLI. This definition follows that used by the ERS-USDA in their Food Access Research Atlas. Participants' county of residence was linked with the USDA (2013) Rural–Urban Continuum Codes (RUCCs) (United States Department of Agriculture, 2013) to determine if the household was located in an urban or rural area. Participants residing in counties in metro areas (RUCCs 1–3) were categorized as urban while all others (RUCCs 4–9) were categorized as rural.
Data analysis: The CNP dataset includes information on the different types of stores where the purchases took place, namely grocery stores (similar to supermarkets in the intercept survey and CES dataset), superstores, club stores, mass merchandisers, drug stores, dollar stores, convenience stores and ‘all others.’ An illustration of the different store-types included in the CNP data can be found in Volpe et al. (Reference Volpe, Kuhns and Jaenicke2017). Weight-adjusted differences in means using national sampling weights were calculated to assess how food expenditure shares, and the number of purchase occasions at the different types of stores varied for LI and NLI households and urban and rural households. It should be noted that these values do not include purchases as the product sold as ‘random weight’ items (e.g., bread from the bakery department) and only represent packaged products, including produce items.
Additionally, the CNP data were used to analyze purchasing patterns, as described in Cleary et al. (Reference Cleary, Bonnano and Cho2017) and Clancy et al. (Reference Clancy, Bonanno, Canning, Cleary, Conrad, Fleisher, Gomez, Griffin, Lee, Kane, Palmer, Park, Peters and Tichenor2017). In this paper, we summarize some of the MBI purchase results illustrated in those two papers, as well as an original analysis of the differences between purchasers and non-purchasers of selected MBIs. All the analyses performed with the CNP data are weight-adjusted tests for differences in means using the sampling weights and were performed using STATA v.14.
Consumer Expenditure Survey
Data from the Bureau of Labor Statistics Consumer Expenditure Diary Survey (referred to here as the CES) for 2012 through 2014 were also analyzed (Bureau of Labor Statistics, 2016a). The CES is a survey that collects data on US households and their purchases of multiple products including foods. The survey uses national and regional probability samples of US households representative of the civilian, non-institutionalized population (Bureau of Labor Statistics, 2016a). Participating households are recruited through the mail and data collection is conducted through face-to-face interviews and paper surveys (Bureau of Labor Statistics, 2016b). Primary respondents for the CES are considered to be the head of household (Bureau of Labor Statistics, 2016a). The CES includes two unique survey components: the Household Characteristics Questionnaire and the Expenditures Diary. Data for this research were obtained by linking the two datasets through a common identifier for every quarter in 2012, 2013 and 2014. The final dataset included 3428 household observations for the NE.
Data manipulation: The primary survey respondent reports socio-demographic characteristics for themselves and their household; those included in the analysis were chosen for their significance in the literature regarding associations with purchasing behaviors and their similarity to independent variables in the customer intercept survey data. The socio-demographic variables included in the analysis are: household income (LI or NLI), based on whether the household was at or below 200% of the US Census Bureau Poverty Threshold (coded as 0 for households with income above—and 1 for those below); children younger than 18 in the household; ethnicity of the primary respondent (non-Hispanic, Hispanic); race of the primary respondent (White, Black, Asian and Other); education of the primary respondent (less than a college education, college education and more than college); and household participation in SNAP in the last 12 months.
Purchasing data on the 104 food items in the survey were combined into 12 categories and sub-categories from the USDA What We Eat in America methodology used in the National Health and Nutrition Examination Survey national food survey (USDA, 2016). The categories and sub-categories included milk and dairy, meats, poultry, seafood, eggs, cured meats, non-meat proteins, mixed dishes, grains, snacks and sweets, fruit and vegetables. The USDA categories and sub-categories were used as binary dependent variables, coded as a zero ‘0’ if there were no purchases within that category over the two consecutive week sampling interval and ‘1’ if there was a purchase within that category.
Data analysis: To maintain consistency with the CNP analysis, χ2 tests for independence were conducted to assess differences in food purchasing within the 12 food categories by income level. For the remaining variables, multivariate logistic regression analyses were conducted to estimate the associations between socio-demographic characteristics and purchasing of foods within the categories.
Results
Where people shop
Customer intercept surveys: primary and secondary stores
We found that the majority (88%) of respondents used grocery stores (including traditional supermarkets—63%—and limited assortment stores—25%) as their primary store for food shopping. Figure 1 includes the descriptive statistics for the analysis of declared primary and secondary food stores. Approximately 7% shopped at supercenters. Similar patterns were noted for secondary stores with grocery stores being the most frequented (78–60% traditional supermarkets and 17% limited-assortment stores), followed by supercenters (10%).
Additionally, we analyzed whether differences in participants' declared primary store for food purchases differed according to their participation in federal nutrition programs (N = 1,117 participating; N = 859 non-participating) and urban–rural status (N = 1,595, urban; N = 402, rural); see values in Table 2. Almost 60% of respondents in federal nutrition programs identified a supermarket as their primary store, vs 69% of non-program participants (values statistically different from one another). A higher percentage of participants using federal nutrition programs, however, declared to shop at limited-assortment stores than those not using food assistance (30 and 18%, respectively). No statistical difference emerges for the percentage of primary shoppers using traditional supermarkets in rural and urban areas (65 and 64%, respectively). A larger percentage of urban participants used limited-assortment stores (26%) as their primary store than rural participants (15%). However, a higher share of rural participants than urban declare supercenters as their primary stores (18 vs 4%) (Table 3).
Table 3. Share of respondents declaring a given primary food store by federal food assistance program participation and urban–rural status

Asterisks indicate means statistically different at the 5% level.
Source: Authors' elaboration from Intercept Survey data.
Secondary data: expenditure shares and shares of purchase occasions
The analysis that follows focuses on the average share of expenditure and purchase occasions of households in the EFSNE NE as they appear in the CNP for the year 2012. As previously mentioned, these values do not include random weight purchases and only represent packaged products. The analysis discussed below will focus on the share of the number of trips (over total number of trips to all store types) and expenditure shares (over total food purchases at all store types) by store type.
The values in Figure 2 show that, overall, the largest shares of both food expenditures and purchase occasions are recorded for grocery stores (67 and 57%, respectively). Supercenters comprise about 10% value of sales (8% of purchase occasions), followed by the aggregate ‘all others’ store types (amounting to 7% expenditures and 11% of purchase occasions).

Fig. 2. Share of food-at-home expenditure (as % of the total value of food purchases) and purchase occasions by store type (2012).
Source: Authors’ elaborations from IRI Consumer Panel Data (2012).
Differences in food expenditure shares at different store types by income and urban status are presented in Table 4. The data show small differences in the expenditure shares between LI and NLI households for all food stores except ‘all others’ and mass merchandisers. In particular, NLI have a higher share of food expenditures than LIs at both grocery stores and club stores, and a lower share at superstores, dollar stores and convenience stores. Urban households show higher food expenditure shares than rural ones for all store types except in the case of superstores (where rural household had 16% higher shares than urban ones) and dollar stores (2%).
Table 4. Differences in food expenditure shares (2012) Annual Averages
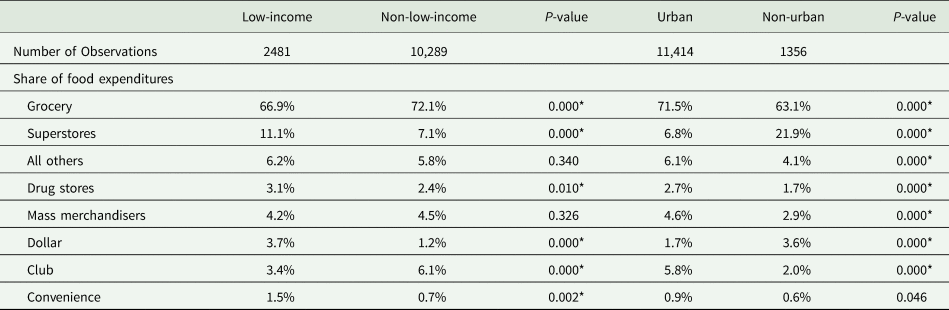
Percentages are calculated as percentages of all purchase expenditures. Asterisks indicate means statistically different at the 5% level.
Source: Authors' elaborations from IRI Consumer Panel Data (2012).
What people buy
Customer intercept surveys: purchase frequencies of MBIs
MBI purchasing results were very similar for both program and non-program participants, although a larger percentage of program participants purchased all the produce items compared to non-participants, except apples. As reported by Clancy et al. (Reference Clancy, Bonanno, Canning, Cleary, Conrad, Fleisher, Gomez, Griffin, Lee, Kane, Palmer, Park, Peters and Tichenor2017), intercept survey respondents showed a higher share of purchasing any of the MBIs (except cabbage) if they had children under the age of 5 in the household.
IRI CNP: characteristics of purchasers and non-purchasers of MB items
Using the 2012 CNP data, we analyzed purchasing patterns of MBIs in the NE across NLI and LI households and urban and rural households.
Income: Compared to NLI households, a larger share of LI households were purchasers of all the MBIs, purchasing also larger quantities, most likely because NLI households purchase more food away from home (Saksena et al., Reference Saksena, Okrent, Anekwe, Cho, Dicken, Effland, Elitzak, Guthrie, Hamrick, Hyman, Jo, Lin, Mancino, McLaughlin, Rahkovsky, Ralston, Smith, Stewart, Todd and Tuttle2018). A smaller share of LI households purchased skim/low-fat milk and lean ground beef compared to NLI, whereas a larger share purchased whole milk, non-lean ground beef and potatoes.
The values illustrated below in Table 5 synthesize the analysis of the difference in means between groups of purchasers and non-purchasers of the different MBIs as a function of demographic characteristics and LI and NLI status (N = 2481 for LI, and N = 10,289 for NLI).
Table 5. Difference in the share of purchasers and non-purchasers of MBI in the function of demographic characteristics, low-income (LI; N = 2481) and non-low income (NLI; N = 10,289) status

A+ or − indicates that the ‘difference’ between purchasers and non-purchasers is statistically different from zero at the 1% level; e.g., the ‘+’ sign for ‘female household head’ for LI, ‘Milk-skim’ column indicates that a higher share of LI female household head purchase skim milk than non-purchasers. ‘X’ denotes that no households were in that specific classification.
Source: Authors elaboration on IRI data.
Children: Overall, LI and NLI households with younger children had a higher percentage of purchasers than non-purchasers for almost all the MBIs. For households with younger children, there were no differences in the percentages of purchasers and non-purchasers of whole milk and lean ground beef. A higher share of households with older children purchased skim milk, regardless of household income. Frozen broccoli purchasers were similar across LI and NLI households with children. Among both LI and NLI households with older children, we observed a higher share of purchasers of regular ground beef and white bread, compared to non-purchasers. We also found a higher share of purchasers of white bread among LI and NLI households with older children but not LI with younger children.
Race and ethnicity: For whole milk, we found a larger share of purchasers than non-purchasers for both LI and NLI households with a black household head. A higher share of purchasers of lean ground beef was observed for both LI and NLI white households. We also found a higher share of purchasers of white bread among NLI black and Hispanic household heads.
Income categories: Smaller percentages of households with incomes less than $14,990 were purchasers of many of the MBIs (with the exception of whole milk and regular ground beef), compared to purchasers. LI households with incomes between $35,000 and $59,999 have larger shares of purchasers of both skim milk and whole milk, regular ground beef, both white bread and wheat bread, peaches, broccoli and potatoes. We also find more purchasers than non-purchasers among NLI households in the same income bracket for whole milk, regular ground beef and white bread.
Education: With regard to levels of education, both LI and NLI households headed by people with some high school, or high school graduates, show higher shares of purchasers (compared to non-purchasers) of whole milk, regular ground beef, white bread, potatoes and peaches. NLI households headed by a person with some college show more purchasers than non-purchasers when it comes to whole milk, both types of ground beef, both types of bread, peaches and potatoes. NLI households headed by a high school graduate also showed more purchasers than non-purchasers when it comes to whole milk, regular ground beef, both types of bread, peaches, broccoli and potatoes.
Consumer expenditure survey
Using data from the 2012–2014 CES, we analyzed food category purchases by income level, which are presented in Table 6.
Table 6. Differences in purchasing of 12 USDA categories by income level in the CES
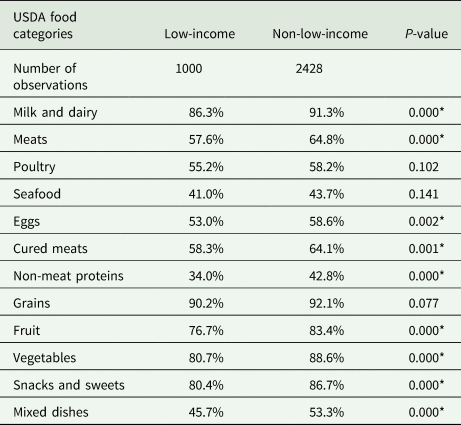
Percentages are calculated as percentages of households purchasing food from the indicated category within that income level. Asterisks indicate means statistically different at the 5% level.
Source: Bureau of Labor Statistics Consumer Expenditure Survey 2012–2014.
LI households show lower percentages of purchasers for nine of the 12 food categories, with the most marked purchasing differences in non-meat proteins, vegetables and mixed dishes. There are no differences in purchasing between LI and NLI households for poultry, seafood and grains.
We also assessed associations between socio-demographic characteristics and food purchasing, which are presented in Table 7. Having children in the household (31% of the sample) is positively associated with purchasing across all food categories; the most significant differences appeared in grains and milk and dairy. The CES data show that households using SNAP (10% of the sample) show a smaller share of fruit purchasers, compared to non-purchasers.
Table 7. Associations between socio-demographic factors and purchasing for 12 USDA categories in the CES

A+ or − indicates that the ‘difference’ between purchasers and non-purchasers is statistically different from zero at the 5% level.
Source: Bureau of Labor Statistics Consumer Expenditure Survey 2012–2014.
Ethnicity and race are associated with different purchasing patterns, particularly in the protein and dairy categories. A higher percentage of Hispanics, compared to non-Hispanics purchased poultry, seafood, meats, eggs non-meat proteins and fruit. Smaller percentages of African Americans and Asian respondents instead purchased milk and dairy, cured meats, and fruits and vegetables. Higher shares of African Americans and Asians, purchase, respectively, poultry and seafood.
Findings related to education relative to food purchasing are mixed. Larger shares of respondents with a college degree and above purchase fruits and vegetables, whereas smaller shares purchase meats, grains, poultry and cured meats.
Discussion
In this section, we highlight the points of convergence and divergence of the analysis across three datasets, and how the findings fit within the existing literature. While some of our results corroborate those of previous research, they also provide additional insights into purchasing patterns which include the greater reliance on limited assortment supermarkets for SNAP and LI households; less reliance on superstores overall except for rural respondents; food category purchasing differences for race and ethnicity, income and education; and children in the household leading to greater purchasing of any MBIs.
Where people shop
The values in Figures 1 and 2 show the importance of grocery stores (which include both traditional supermarkets and limited assortment stores) for shoppers in the EFSNE NE. Both in terms of being the primary or secondary store, and in terms of expenditure and purchase occasion shares, supercenters and other formats are of secondary importance. These findings are similar to previous research which show, regardless of income, that most households utilize traditional supermarkets for their food shopping; the results of food expenditure shares using the CNP data follow the same pattern. Unlike previous studies (Broda et al., Reference Broda, Leibtag and Weinstein2009; Taylor and Villas-Boas, Reference Taylor and Villas-Boas2016; Ver Ploeg et al., Reference Ver Ploeg, Larimore and Wilde2017), our results overall show supercenters as a distant second to supermarkets in terms of store preference, expenditures and purchase occasions.
From the intercept data analysis, we find that a larger shares of respondents participating in federal nutrition programs shop at limited-assortment supermarkets, compared to non-participants, with 30% of them identifying limited-assortment stores as their primary store, similar to the Chrisinger et al. (Reference Chrisinger, DiSantis, Hillier and Kumanyika2018) findings that lower income households spend a larger percentage of their budget at limited assortment stores. The intercept findings may reflect the characteristics and locations of our sample of shoppers. Most limited assortment stores meet the classification of a supermarket used in other datasets and offer competitive prices, which may account for their popularity among LI households.
Differences in food expenditure shares at different store types by income and urban status are presented in Table 4. The data show small differences in the expenditure shares between LI and NLI households for all food stores except ‘all others’ and mass merchandisers. In particular, NLI households have a higher share of food expenditures than LI households at both grocery stores and club stores, and a lower share at superstores, dollar stores and convenience stores. Similar to Broda et al. (Reference Broda, Leibtag and Weinstein2009), we find small differences in food expenditures between LI and NLI purchasing at convenience stores (1.5 vs 0.7%).
While convenience and dollar stores are increasing their presence in rural areas (Bustillos et al., Reference Bustillos, Sharkey, Anding and McIntosh2009; Campbell et al., Reference Campbell, Sharipo, Welsh, Bleich, Cobb and Gittelsohn2017), when compared to urban households, both the intercept and IRI CNP data analysis find that a larger share of rural households use supercenters/superstores and show higher food expenditures at these store types than urban households. Like urban households, supermarkets are the declared primary store and also rank highest in expenditures. This finding is corroborated in a recent case study of five rural grocers that found residents spend nearly half of their food dollars at their locally-owned grocery/supermarket (Peterson and Proctor, Reference Peterson and Proctor2018).
Supermarkets may be located in an LI, middle- or high-income neighborhood but attract shoppers from different income categories or be located in an LI neighborhood and attract middle- and high-income shoppers. Rahkovsky and Snyder (Reference Rahkovsky and Snyder2015) discuss census findings from 2010 that estimate 32% of urban and 42% of rural residents live in LI areas but are not poor themselves. This is similar to Wilde's et al. (Reference Wilde, Llobrera and Ver Ploeg2014) finding that 40% of LI people live in neighborhoods that are not high poverty, making place-based interventions an imperfect solution to food access problems.
What people buy
In this section, we review the findings of the analysis of the CNP and intercept survey data separately from those of the CES data to avoid confusion between specific foods and categories of foods. Where possible, we also compare these findings with the literature.
As noted in Table 1, income is defined by federal nutrition program participation for the intercept survey, and by above and below 200% of the poverty level for CNP and CES. Both the intercept results and the CNP analysis find a higher percentage of LI households to be purchasers of all the MBIs than NLI households, purchasing also larger quantities, most likely because NLI households purchase more food away from home (Saksena et al., Reference Saksena, Okrent, Anekwe, Cho, Dicken, Effland, Elitzak, Guthrie, Hamrick, Hyman, Jo, Lin, Mancino, McLaughlin, Rahkovsky, Ralston, Smith, Stewart, Todd and Tuttle2018). Our findings align with Rahkovsky and Snyder's (Reference Rahkovsky and Snyder2015) research that LI households purchase more foods to be consumed at home overall.
Looking at specific market basket foods, the intercept survey data show a higher share of program participants being purchasers of all fruits and vegetables in the market basket than non-participants. In contrast, the results of the CES analysis show smaller shares of households using SNAP purchasing fruit, results. Also, comparable to Rahkovsky and Snyder's (Reference Rahkovsky and Snyder2015) finding that LILA purchase less fruit, and to Leung et al. (Reference Leung, Epel, Ritchie, Crawford and Laraia2012) who report that SNAP participants consume fewer fruits and vegetables. The intercept findings may reflect the popularity of produce items in the MB compared to the broad category of fruit used in CES.
Both LI and NLI households show a higher incidence of purchasers of skim milk than non-purchasers; in contrast, Rahkovsky and Snyder (Reference Rahkovsky and Snyder2015) report that LILA households are more likely to purchase low-fat milk than non-LILA. Our finding may reflect a trend away from whole milk purchasing, except for African American households.
The intercept findings on bread purchasing patterns are similar to those obtained with the IRI CNP data, a higher share of LI households are purchasers of wheat and white bread. The intercept found that program participant respondents are equally likely to purchase whole wheat bread as non-program participants. Because wheat bread is significantly more expensive than white bread, LI households (or program participants) may place a high value on the nutritional differences between wheat and white bread. Those households participating in the WIC program are urged to purchase wheat bread, which could account for part of the difference (Andreyeva et al., Reference Andreyeva, Luedicke, Middleton, Long and Schwartz2011).
The analysis of the IRI CNP data found that LI and NLI households are equally likely to purchase ground beef, although smaller percentages of LI households purchase lean ground beef, which likely is a function of lean ground beef's higher price or taste preferences.
Smaller percentages of LI households in the CES purchase foods in nine of the 12 food categories than those above the poverty threshold, in contrast to the findings obtained from IRI CNP and intercept survey data that a higher share of LI households are purchasers of all MBIs, which may be due to the fact that we consider food categories in the CES and individual foods in the CNP and the intercept survey.
In summary, the IRI CNP and the intercept results find that LI households purchased more MBIs and show similar purchasing patterns for low-fat milk and wheat bread as non-LI households. While there is no difference in the share of purchasers and non-purchasers of ground beef among LI households, a smaller share purchases lean ground beef. The CES analysis finds a smaller share of LI purchasing milk and dairy, meats, eggs, cured meats, non-meat proteins, fruit, vegetables, snacks and sweets and mixed dishes. Heterogeneity of patterns may reflect differences in taste and cultural preferences and health-seeking behaviors.
Education: Similar to the findings from Handbury et al. (Reference Handbury, Rahkovsky and Schnell2015), we find that a smaller share of respondents with higher levels of education of the household head (college graduate and holding a post-graduate degree) are purchasers of some of the ‘less healthy’ MBI (whole milk, regular beef, white bread); a result that holds only for white bread in LI households.
Children in household: Both the analyses of the IRI CNP and intercept survey data show that having young children in the household is associated with purchasing the majority of the MBIs. Similarly, the analysis of the CES finds that having children in the households is associated with purchasing across all food categories. LI and NLI households with young children show more purchasers than non-purchasers for almost all the MBIs, including skim milk, lean ground beef, wheat bread, frozen broccoli and potatoes. A likely reason for this result is that households with children may prepare more meals at home while seeking to meet dietary needs for children's growth. This finding may also reflect participation in the WIC program.
Rural: We find no significant differences between urban and rural households with regards to purchasing the MBIs, while Rahkovsky and Snyder (Reference Rahkovsky and Snyder2015) find that LILA urban households purchases are similar to non-LILA rural households.
Race and ethnicity: Most of our findings related to race and ethnicity support previous literature, although most of the literature focuses on proteins and produce. In the protein category, we found a larger share of Hispanics purchasing seafood and poultry, and a larger share of Asians purchasing seafood. Zhen et al. (Reference Zhen, Taylor, Muth and Leibtag2009) also found that Hispanics, Asians, as well as African Americans spend more on fish and seafood than whites. The CES analysis finds that a larger share of African Americans are purchasers of poultry, similar to Nielson (2017), Zhen et al. (Reference Zhen, Taylor, Muth and Leibtag2009) and Rahkovsky and Snyder (Reference Rahkovsky and Snyder2015).
In the produce category, we found a higher percentage of Hispanics being purchasers of fruit, similar to Nielson's (2017) findings. Other studies have found that Asians also spend more on fresh produce than whites and African Americans (Zhen et al., Reference Zhen, Taylor, Muth and Leibtag2009; Cullen et al., Reference Cullen, Baranowski, Watson, Nicklas, Fisher, O'Donnell, Baranowski, Islam and Missaghian2007). The CES analysis found that a smaller share of African Americans purchased fruits and vegetables, in contrast to Rahkovsky and Snyder (Reference Rahkovsky and Snyder2015) who report that African Americans spent 11% more on fruit. Studies conducted on ethnic populations have found that the major barriers among LI populations to the purchase and consumption of fresh fruits and vegetables are the high cost and high spoilage rates, a perceived lack of time and the extensive preparation time for cooking vegetables (Yeh et al., Reference Yeh, Ickes, Lowenstein, Shuval, Ammerman, Farris and Katz2008; Stephens et al., Reference Stephens, Troutman, Johns and Taylor2015).
Further, the analysis of the CES and IRI CNP both find distinct purchasing differences across ethnic groups for dairy categories, with a larger share of African Americans being non-purchasers of milk and dairy. Rahkovsky and Snyder (Reference Rahkovsky and Snyder2015) also found that African Americans are less likely to purchase dairy products, possibly due to higher rates of lactose intolerance.
Limitations
The key variables in this study are measured in a variety of ways, which makes comparing across the datasets challenging and may account for some of the differences in our findings. For example, the definition of, and the language describing store categories vary with small but significant differences as to what constitutes a supermarket, grocery store, small grocery, etc. The definition of the stores used in the IRI data analysis does not uniquely match that of the FMI. With current retail trends, it would be helpful for future analyses to use a standard classification to ensure comparability. For example, the FMI's categorization is the one most cited and is used for this paper with a modification.
Measurements for store preferences also vary. The IRI dataset uses expenditures and purchase occasions as the metric for store preferences, while the intercept survey uses self-reported store preferences. The issue of purchasing variables arises in many studies. The CES utilizes aggregated food groups and the IRI and the intercept survey utilize a limited number of food items. Also, the IRI does not measure non-packaged produce items, which means the analysis is missing non-packaged produce purchases and produce purchased outside of the MBIs.
As noted in Table 1, the choice of demographic questions also varies across datasets. For example, the intercept survey asks about children in the household under the age of 5 while the other two datasets ask about children under the age of 18. Income and poverty measures also vary across datasets, which may account for some variation in our results and comparability. In our intercept survey analysis, we used participation in any federal nutrition program as a proxy for income, while for the analysis of the IRI CNP and CEE data, we used the 200% or less of the federal poverty line. This means we have not captured the gap between 200% of the poverty line and the cutoffs for SNAP, WIC and school lunch eligibility.
Conclusion
Our analysis used three datasets to describe trends in store choice and food purchasing among LI households in the NE USA. One strength of this study is the ability to examine a number of variables that have shown to be correlated with shopping and purchasing decisions and compare the findings with trends and analyses that have been reported in other studies. Some of the differences we found may be a reflection of the characteristics of shoppers in the NE region. We may also be witnessing changes in shopping and purchasing trends that are taking place over time. Using a multi-faceted approach to understand the suite of factors related to the food purchasing of LI households challenges researchers to consider the complexity of the issue.
We offer two notable findings on store choices about limited assortment supermarkets and supercenters. The analysis of the intercept survey shows that one in four urban residents use limited assortment stores as their primary store, and that a larger share of program participants shop at limited assortment stores compared to non-participants. The appeal of this store format for LI or urban individuals warrants further research to understand how these smaller format supermarkets can fulfill nutritional needs without the level of investment (and profits) required to support superstores or supermarkets. Also, supercenters appeal to rural residents more than urban; however, the CNP data suggest that supercenters comprised only 10% of sales and 8% of purchase occasions of food-at-home. While nationwide trends continue to show superstores with increased market share, we did not find that trend from the IRI or the intercept data for the NE.
Our review of the literature also indicates that there is a paucity of research on rural households' food purchasing habits: a gap that should be filled with more studies and tested for replicability. It is also possible that other studies have not found significant differences between urban and rural households, thus are not reporting a null finding. Understanding these gaps would help inform interventions and policymaking in the rural arena.
We find a few studies that look at purchasing patterns and children in the household. Based on our findings, the presence of children is correlated with healthier food purchasing in the household, similar to Rahkovsky and Snyder (Reference Rahkovsky and Snyder2015) (see page 6). Additional research on the role of children in shifting purchase patterns would help define opportunities for intervention.
Another finding worth emphasizing is that while differences in purchasing patterns across household income levels may be statistically significant, they are small, and are likely not of public health significance. Except for whole milk and lean ground beef, our intercept survey data reveal similar purchases across program participants and non-participants. The analysis of IRI data finds a smaller share of LI households to be purchasers of low-fat milk and lean ground beef than NLI households, while the CES data showed racial and ethnic differences, regardless of income. At this point, it may not be as important to study these types of differences as it is to acknowledge that several recent studies point out that demand for healthy foods is a much greater driver of purchases than supply is. Research that focuses on why these differences exist may be more useful to programs and interventions and even policies than more information about what the differences are, as we illustrated earlier with regard to LI ethnic food choices.
For those seeking to increase healthier purchasing for specific audiences, some of these findings on specific foods may be useful. For example, because wheat bread is purchased by all income groups, researchers could investigate what has motivated households to change from white to wheat bread (Chase et al., Reference Chase, Reicks, Smith, Henry and Reimer2003). Racial and ethnic preferences for protein foods may guide program implementers to suggest culturally appropriate products with healthier preparation methods.
While households at all income levels fail to meet dietary guidelines, LI households encounter additional challenges with lower levels of education, and less access to transportation, and purchasing decisions may reflect those challenges. Thus, it will be important for policymakers, practitioners and researchers to examine more deeply the context and the complexities of food purchasing choices of LI households that go beyond quantitative analyses.
Acknowledgements
Many thanks to our anonymous reviewers who provided excellent and constructive feedback. The authors gratefully acknowledge funding from USDA/NIFA under Global Food Security Grant No. 2011-68004-30057 (Enhancing the Food Security of Underserved Populations in the Northeast US through Sustainable Regional Food Systems Development) and the Agricultural Experiment Station of The Pennsylvania State University and Colorado State University. Any opinions, findings, recommendations or conclusions are those of the authors and do not necessarily reflect the views of the Economic Research Service, US Department of Agriculture. The analysis, findings and conclusions expressed in this presentation also should not be attributed to Information Resources, Inc. (IRI).
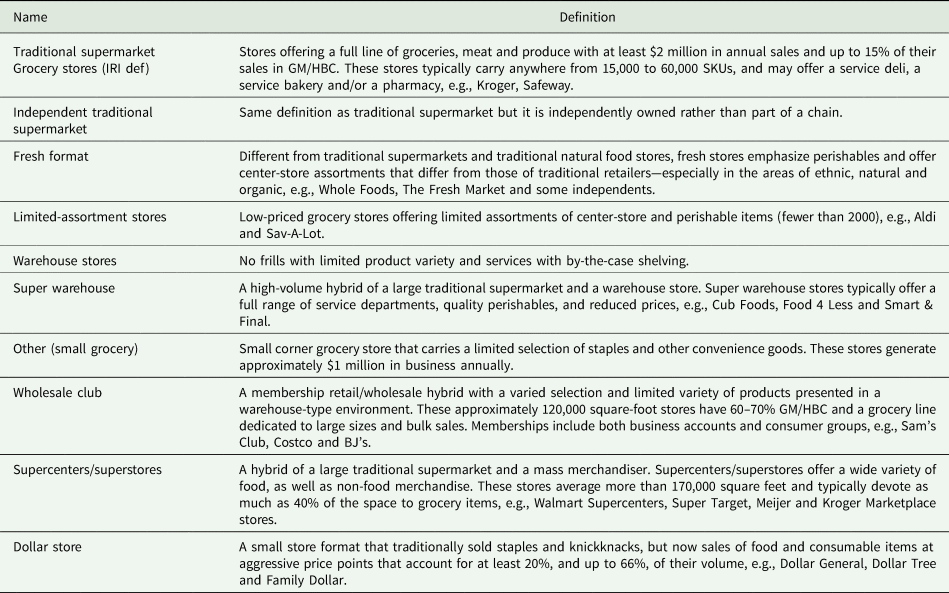
Appendix 1: Stores classification
We use a (modified) version of the FMI's store classifications to provide background on what the retail landscape currently looks like.