


I. INTRODUCTION
Nanoindentation is a well-developed technique for measuring the mechanical properties of stiff materials. There is growing interest in using the technique for determining the properties of more compliant materialsReference Oyen1 including biological tissuesReference Ebenstein and Pruitt2–Reference Franke, Durst, Maier, Göken, Birkholz, Schneider, Hennig and Gelse4 and hydrogels.Reference Shapiro and Oyen5–Reference Oyen7
The advantages of using a nanoindenter instead of more conventional techniques include the ability to probe small volumes of tissue and the ability to spatially resolve the properties of the material. The latter is particularly important, given that biological materials or hydrogels may not have homogeneous microstructuresReference McKee, Last, Russell and Murphy8,Reference Draper, Mears, Castilla, King, McDonald, Akhtar and Adams9 or may have been designed to have spatially varying properties.Reference Draper, Schweins, Akhtar, Groves, Chechik, Zwijnenburg and Adams10
One of the key developments in nanoindentation is the ability to conduct oscillatory tests. This method superimposes an oscillating force and measures the resulting indenter oscillation amplitude and phase shift. The analysis to derive contact stiffness and damping is straightforward if the indentation system is well modeled as a simple-harmonic oscillator, both prior to, and during, sample contact.Reference Oliver and Pethica11–Reference Asif, Wahl and Colton14 Such testing enhances instrumented indentation as a materials characterization tool. Of relevance to the present work is the ability to measure the viscoelastic properties of a material at a series of specific frequencies.
Many studies have compared oscillatory nanoindentation data with macroscale dynamic test methods, including dynamic mechanical analysis (DMA), dynamic mechanical thermal analysis (DMTA), and rheometry. These macroscale methods have a long history and thus serve to validate nanoindentation methods. An early study by White et al. compared rheometry with oscillatory nanoindentation for epoxy, PMMA, and two types of PDMS of differing moduli.Reference White, Drzal and VanLandingham15 The complexity of a direct comparison was evident as each sample had to be tested by a different mode with the rheometer, due to differing sample geometries and instrument compliance. For the epoxy resin, nanoindentation values were found to be lower than the rheometric values by a factor of two; agreement was better for PMMA. For the PDMS samples, good agreement was found for the stiffer sample; but for the most compliant sample (storage modulus of approximately 1 MPa), the nanoindentation values were significantly higher than rheometric values. Generally, the discrepancies were attributed to delayed surface detection, insufficient knowledge of contact area, and inherent differences in strain and strain rate between the two methods. In another study, Hayes et al.Reference Hayes, Goruppa and Jones16 compared oscillatory nanoindentation with DMTA to determine the properties of four different polymers and found good agreement in tan δ (the ratio of loss modulus to storage modulus, also known as the “loss factor”). However, storage and loss moduli from the nanoindenter were not reported due to substantial errors in the contact area.Reference Hayes, Goruppa and Jones16 We note here that the nanoindentation loss factor is immune to errors in the contact area because both the loss modulus and storage modulus depend on the contact area in the same way, making their ratio independent of the contact area.
One of the issues with many of the earlier studies using nanoindentation to test compliant materials was the use of pyramidal indenters such as the Berkovich tip. Such an indenter causes a contact that violates the conditions of linear viscoelasticity, which is the basis on which rheological measurements of polymers are conducted.Reference Herbert, Oliver and Pharr17,Reference Tweedie and Van Vliet18 Herbert et al. demonstrated that a frustum indenter (a flat-ended cylinder) can preserve linear elasticity, if the penetration depth is small.Reference Herbert, Oliver and Pharr17 Furthermore, with a frustum, the contact area is known and constant throughout the experiment; it is simply the area of the circular end. Herbert et al. also carefully characterized the dynamic response of their nanoindentation instrument to accurately isolate the contribution of the contact. With these improvements to the nanoindentation method, they demonstrated good agreement between nanoindentation and DMA on highly plasticized polyvinyl chloride over the frequency range of 1–50 Hz. Following this, others have found general agreement between oscillatory nanoindentation and DMA.Reference Hay and Herbert13 Consequently, oscillatory nanoindentation has now gained acceptance as a way to make small-scale DMA measurements, even though discrepancies remain due to fundamental differences in imposed strain and strain rates.Reference Herbert, Phani and Johanns19 However, for materials that are so compliant that they are normally tested with a rheometer, making comparable measurements by oscillatory nanoindentation remains challenging but highly desirable. Recently, oscillatory nanoindentation methods have been utilized to study soft tissuesReference Moronkeji, Todd, Dawidowska, Barrett and Akhtar20–Reference Peters, Comerford, Macaulay, Bates and Akhtar22 and also hydrogels.Reference Guglielmi, Herbert, Tartivel, Behl, Lendlein, Huber and Lilleodden23
In this study, our interest is in the application of oscillatory nanoindentation to a class of highly compliant hydrogels which are known as low-molecular-weight gelators (LMWGs).Reference Draper, Mears, Castilla, King, McDonald, Akhtar and Adams9,Reference Draper, Schweins, Akhtar, Groves, Chechik, Zwijnenburg and Adams10 LMWGs are an interesting class of molecule that can self-assemble under specific conditions to form a hydrogel.Reference Draper and Adams24 The challenges of utilizing oscillatory nanoindentation for such materials are 2-fold. First, the compliance of the material means that the measured contact stiffness can be on the order of the uncertainty in the stiffness, thus making uncertainty analysis an essential aspect of experimental design. Second, the bulk methods of characterization often differ widely, as demanded by the properties of the sample. For samples having moduli on the order of kPa, simple parallel-plate rheometry may be used. For even more compliant samples, a vane-in-cup form of rheometry is more suitable, wherein the vane consists of four or more cross-shaped blades at the end of a central shaft which can be inserted into the gel with little disruption of its microstructure.Reference Stokes and Telford25 To the best of our knowledge, there has not been a systematic study which examines the application of oscillatory nanoindentation to LMWGs with a direct comparison to rheometry.
Here, we compare oscillatory nanoindentation to both parallel-plate and rotational (vane) rheometry of LMWGs. In particular, we focus here on LMWGs formed using a pH trigger that arises from the controlled hydrolysis of glucono-δ-lactone (GdL) to gluconic acidReference Draper, Mears, Castilla, King, McDonald, Akhtar and Adams9 due to the reproducibility of this gelation method. It is well-established that pH-triggered LMWGs, including those formed using GdL, exhibit mechanical behavior which is governed by the fibrous microstructure of the gels.Reference Adams, Mullen, Berta, Chen and Frith26–Reference Terech and Weiss28 A number of factors affect the mechanical properties of the gels including the final pH of the gel and the rate of pH change during gel formation.Reference Draper, Mears, Castilla, King, McDonald, Akhtar and Adams9 The rheological behavior is well-described in the literature for LMWGs.Reference Kalcioglu, Mahmoodian, Hu, Suo and Van Vliet29 With strain, G′ and G″ are constant at low strain, but at higher strains, G′ decreases sharply due to a breakdown in the gel network. With frequency, properties are relatively constant below about 15 Hz.Reference Draper, Mears, Castilla, King, McDonald, Akhtar and Adams9 Properties also depend on strain rate. For unconfined low-speed compression (1 mm/s), the gels exhibit a plastic response which is coupled with expulsion of water from the gel. For high-speed compression (5 mm/s), the gels have an initial elastic response that is consistent with the shear rheology results, followed by a brittle failure at around 3–5% strain.Reference Adams, Mullen, Berta, Chen and Frith26
Samples produced by the GdL gelation method are ideal for investigating the utility of oscillatory nanoindentation as an alternative technique to bulk characterization via rheometry. First, GdL hydrolysis results in homogenous hydrogels which are not affected by their shear or mixing history.Reference Draper, Mears, Castilla, King, McDonald, Akhtar and Adams9 Second, as stated above, the mechanical behavior of the gels formed by this method is well-characterized, especially with vane-in-cup rheometry. Third, their microstructure can easily be determined with complementary techniques such as optical imaging and scanning electron microscopy.Reference Draper, Mears, Castilla, King, McDonald, Akhtar and Adams9 Fourth, due to their compliance, they serve as an ideal candidate for exploring issues around uncertainty in the instrumentation.
II. THEORY OF OSCILLATORY NANOINDENTATION FOR RHEOLOGICAL PROPERTIES
This section provides a theoretical overview of the oscillatory nanoindentation method that has been utilized in this study.
A. Oscillatory indentation (theory)
The theory of oscillatory indentation is informed both by elastic contact models and constitutive forms used to comprehend the mechanical behavior of polymers. Sneddon was the first to derive a general relation among force, displacement, and shear modulus for an axisymmetric indenter in contact with a flat surface.Reference Sneddon30 Oliver, Pharr, and Brotzen showed that a derivative form of Sneddon’s relation is largely independent of the geometry of the indenterReference Pharr, Oliver and Brotzen31 This derivative relation is
 $$G' = {{S\left( {1 - \nu } \right)} / {\left( {4a} \right)}}\quad ,$$
where G′ is the shear storage modulus of the material, ν is the Poisson’s ratio, S is the elastic stiffness of the contact, and a is the radius of contact, or simply the radius of the punch face, if using a frustum. If the material response is substantially elastic, then G′ is identical to the shear modulus, G. Also, for gels and biomaterials, it is reasonable to assign ν = 0.5,Reference Chippada, Yurke and Langrana32,Reference Nijenhuis, Zhao, Carisey, Ballestrem and Derby33 leading to
 $$G' = {S / {\left( {8a} \right)}}\quad .$$
Later, Loubet, Lucas, and Oliver invoked the Kelvin–Voigt material model and thereby deduced the analogous relationshipReference Loubet, Lucas, Oliver and Smith34
 $$G'' = {{{D_{\rm{s}}}\omega } / {\left( {8a} \right)}}\quad ,$$
where G″ is the loss modulus and D sω is the contact damping, manifest as the damping coefficient D s multiplied by the radial frequency, ω. The loss factor, tan δ, defined as the loss modulus divided by the storage modulus is
 $${{\tan \delta \,\,\equiv\,\, G''} / G} = {{{D_{\rm{s}}}\omega } / S}\quad .$$
Thus, the task of measuring the complex modulus of a gel by oscillatory indentation is that of measuring the contact stiffness, S, and contact damping, D sω.
The indentation system utilized in this study has been deliberately designed to behave as a simple-harmonic oscillator, so that by oscillating the system with a force amplitude, F 0, and angular frequency, ω, and measuring the resulting displacement amplitude, z 0, and phase shift, ϕ, we may know the values of all the components of the oscillator: K, D, and m. Specifically,
 $$K - m{\omega ^2} = \left( {{{{F_0}} / {{z_0}}}} \right)\cos \phi = \kappa \quad ,$$
and
 $$D\omega = \left( {{{{F_0}} / {{z_0}}}} \right)\sin \phi = \chi \quad .$$
When the indenter is free-hanging, or not in contact with any material, then K, D, and m are the stiffness, damping, and mass of the indentation system alone, or K i, D i, and m i. In fact, this is how K i, D i, and m i are determined: by oscillating the indenter when it is free-hanging. When the indenter is in contact with a test material, the parameters K, D, and m comprehend the combined effect of both the indentation system and the contact. Thus, the fundamental values of F 0, z 0, and f must be compensated for the known influence of the instrument to isolate the contact. During an experiment, we obtain the contact stiffness for use in Eq. (2) as the combined dynamic stiffness less the instrument stiffness, or
 $$S = \left( {{{{F_0}} / {{z_0}}}} \right)\cos \phi - \left( {{K_i} - {m_i}{\omega ^2}} \right) = \kappa - {\kappa _i}\quad ,$$
and we obtain the contact damping for use in Eq. (3) as the combined dynamic damping less the instrument damping, or
 $${D_{\rm{s}}}\omega = \left( {{{{F_0}} / {{z_0}}}} \right)\sin \phi - {D_i}\omega = \chi - {\chi _i}\quad .$$
B. Uncertainty analysis (theory)
Some of our experimental choices, namely testing frequency and punch size, were guided by uncertainty analysis. The relative uncertainty in shear storage modulus is dominated by the relative uncertainty in contact stiffness,
 $${{\delta G'} / {G'}} = {{\delta S} / S}\quad ,$$
and likewise for the shear loss modulus,
 $${{\delta G''} / {G''}} = {{\delta \left( {{D_{\rm{s}}}\omega } \right)} / {\left( {{D_{\rm{s}}}\omega } \right)}}\quad .$$
In turn, the uncertainty in contact stiffness and damping are given by the root-sum-square of the uncertainties in the two comprising terms [see Eqs. (7) and (8)].
 $$\delta S = {\left[ {{{\left( {\delta \kappa } \right)}^2} + {{\left( {\delta {\kappa _i}} \right)}^2}} \right]^{1{\rm{/}}2}}\quad ,$$
 $$\delta \left( {{D_{\rm{s}}}\omega } \right) = {\left[ {{{\left( {\delta \chi } \right)}^2} + {{\left( {\delta {\chi _i}} \right)}^2}} \right]^{1{\rm{/}}2}}\quad .$$
It is a reasonable approximation to set the uncertainty in the total measured stiffness, κ, to that of the instrument, i.e., δκ = δκi, because for this sort of testing, we expect the total measured stiffness to be dominated by the instrument. We make an analogous observation for the damping, and thus approximate the uncertainties in contact stiffness and damping as
 $$\delta S = \surd 2\delta {\kappa _i}\quad ,$$
 $$\delta \left( {{D_{\rm{s}}}\omega } \right) = \surd 2\delta {\chi _i}\quad .$$
Thus, the first experimental task is to measure δκi and δχi over the operating domain of the instrument to provide guidance as to the necessary contact radius, available frequency range, and ideal position of the indenter relative to its range of travel.
The size of the frustum is chosen so that the contact stiffness is large (50×) relative to the uncertainty in stiffness. In other words, we wish to select a frustum such that
 $${S / {\left( {\delta S} \right)}} > 50\quad ,$$
recalling that S = 8G′a [see Eq. (2)] and solving for a yields the experimental requirement that
 $$a > {{50\left( {\delta S} \right)} / {\left( {8G'} \right)}}\quad .$$
III. EXPERIMENTAL
A. Sample preparation
All samples were prepared at a room temperature range of 20–22 °C. ThNapFF, shown in Fig. 1, was dissolved in water at a concentration of 5 mg/mL by the addition of 1 molar equivalent of a 0.1 M NaOH solution to a dispersion of the ThNapFF in water. A stock solution of 40 mL was prepared for all the experiments. Solutions were stirred using a magnetic stirrer bar overnight until all the gelator had dissolved.

FIG. 1. Chemical structure of ThNapFF: (2R)3-phenyl-2[(2R)3-phenyl-2[2-(5,6,7,8-tetrahydronaphthalen-1-yloxy)acetamido]propanamido]propanoic acid.
In all cases, gels were formed by the addition of an aliquot of the stock solution of ThNapFF to GdL (8 mg per mL of stock solution). GdL hydrolyses slowly so that there was sufficient time after addition and mixing to transfer the solution to different molds prior to gelation, meaning the same gelation trigger and the method could be used to prepare samples for all rheological and nanoindentation methods.
For vane-in-cup-rheometry, the gels were prepared in 7 mL Sterilin vials. A pipette was used to add 2 mL of stock solution to the vial into which the GdL had been weighed. The samples were then gently shaken by hand until the GdL had dissolved. The samples were then left for 16 h to gel before being measured. The Sterilin vials were directly loaded into the rheometer for measurements so no direct manipulation, transfer, or loading of the sample was required.
For the nanoindentation and parallel plate measurements, gel samples were prepared in molds using a syringe. This was done by removing the top from 20 mL syringe. GdL (8 mg per mL of stock solution) was added and the sample mixed in a separate vial to make sure that all the GdL was dissolved. Care was taken not to generate bubbles in the solution. The solution was then transferred to the syringe which was secured to a flat surface using Blu Tack (Bostik, Leicester, U.K.). The top was covered with Parafilm to prevent the sample drying out. The samples were then left overnight (around 16 h) to gel without being disturbed. The gels could then be removed from the mold by removing the Parafilm and gently pushing the plunger. The sample was then gently transferred from the syringe mold onto the nanoindentation puck by using a scalpel, or onto the bottom plate of the rheometer by using a glass slide and a spatula. Any gels that were damaged in this process were not used.
These methods gave gels formed from the syringe mold (i.e., for nanoindentation and parallel plates) with a diameter of 20 mm and a thickness of around 9 mm [Fig. 2(a)] and the gels formed in the Sterilin vials (i.e., for vane-in-cup rheology) had a diameter of 12 mm and a thickness of 14 mm [Fig. 2(b)]. All the samples were left for 16 h before mechanical testing.
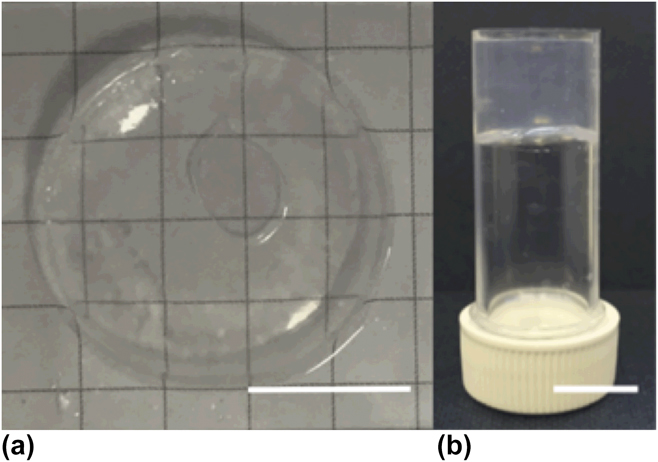
FIG. 2. (a) Nanoindentation sample. Scale bar represents 10 mm. (b) Vane-in-cup rheology sample. Scale bar represents 10 mm.
For confocal imaging, the gelator solution was prepared as before, and 2 μL of a 0.1 wt% of Nile blue in water was added to 1 mL of the stock solution. The stock solution (1 mL) was then mixed with 8 mg of GdL and shaken until dissolved. This solution (100 μL) was immediately transferred to a 35-mm plastic CELLview™ dish with a glass bottom (Greiner Bio-One, Kremsmünster, Austria). The culture dish was wrapped with a wet paper towel to produce a saturated atmosphere to ensure that the gel did not dry out whilst gelling. The dish was then covered with a lid and sealed with Parafilm and not moved again until imaged so as not to disturb the gelation. These samples gave very thin gels that could be imaged more easily than the bulk samples.
B. Rheometry
All rheological measurements were performed using an Anton Paar Physica 301 rheometer (Anton Paar, Gratz, Austria). Following the manufacturer’s instructions, motor and inertia adjustments were made prior to testing. Measurements were carried out at 25 °C, maintained using a Peltier plate and water bath. During the experiment, the static force was set to zero and controlled by small automatic adjustments of the fixtures. All measurements were repeated in triplicate to ensure reproducibility of the reported results.
Strain sweeps and frequency sweeps were performed for both vane-in-cup and parallel-plate test configurations. Strain sweeps were carried out from 0.1 to 1000% strain at a frequency of 10 rad/s (1.6 Hz). The strain at which the gel broke was determined as the point when G′ and G″ deviated from linearity, a manifestation of permanent deformation. If indicated, the flow point–the strain at which the sample began to act as a liquid–was determined as the strain at which G″ first exceeded G′. Strain-sweep results are reported in the Supplementary Material. Frequency sweeps were carried out from an angular frequency of 0.02–20 Hz (0.1–128 rad/s) at a constant strain of 0.5%, which was in the linear viscoelastic region determined by the strain sweep.
1. Vane-in-cup
Vane-in-cup measurements were performed with a vane having a cross diameter of 8.8 mm and a length of 10 mm (ST10-4V 8.8/97.5) together with a cup having an aluminum insert to fit a diameter of 14 mm (C-PTD200). The vials holding the prepared gels were loaded directly into the cup of the rheometer and secured using Blu Tack (Bostick, Leicester, U.K.). The vane was then lowered into the gel sample slowly, using the soft viscoelastic setting to minimize compression during insertion. The vane was completely covered by the gel and was 1.2 mm away from the bottom of the gel.
2. Parallel-plate
Parallel-plate measurements were performed with a sandblasted top having a diameter of 25 mm (PP25/S) and a flat bottom plate having a diameter of 25 mm. Gel disks were carefully transferred to the bottom plate, and the top plate was lowered onto the gel surface slowly, using the soft viscoelastic setting to minimize compression (Fig. 3). The gels were measured at a gap distance of 2.6–2.7 mm.
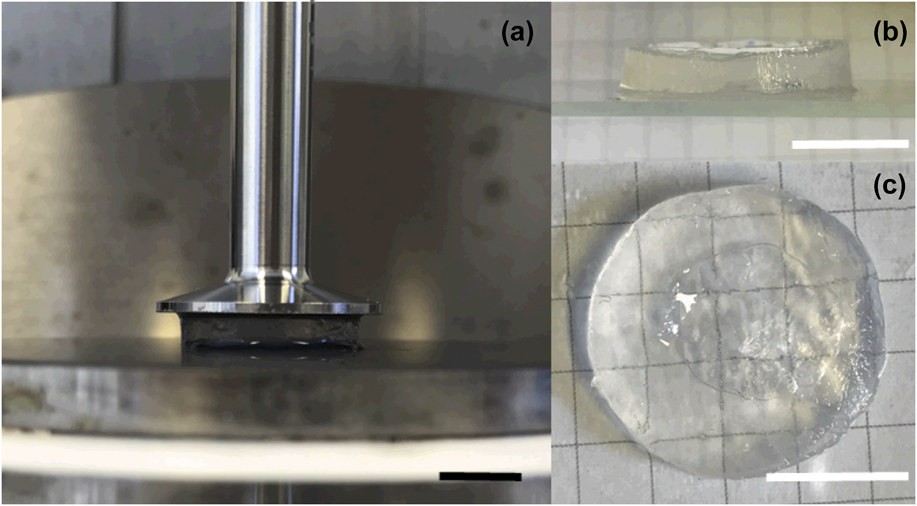
FIG. 3. Images showing (a) LMWG samples formed in the gel mold measured with the parallel plate rheometry setup (b) and (c) LMWG gel after a frequency measurement. Scale bar represents 10 mm.
C. Confocal microscopy
Confocal microscopy images were taken using a Zeiss LSM 710 confocal microscope. The objective was a LD EC Epiplan NEUFLUAR 50× (0.55 DIC; Carl Zeiss, Oberkochen, Germany). The samples were excited at 634 nm using a He–Ne laser. Multiple parts of the gel were imaged to ensure that the images were representative of the sample.
D. Nanoindentation
Nanoindentation experiments were conducted with a Nanoindenter G200 system equipped with a DCM-II head (Keysight Technologies, Chandler, Arizona). The nanoindenter utilized in this study was similar to the system described by Herbert et al.Reference Herbert, Oliver and Pharr17 A flat-ended cylindrical punch having a face diameter of 100 µm (Synton-MDP Ltd., Nidau, Switzerland) was used for all the experiments. All the tests were conducted in a temperature-controlled laboratory with the typical testing temperature being 22 °C.
1. Method for quantifying uncertainties
The first experimental task was to measure the uncertainties in contact stiffness and damping over the operating domain of the instrument. This was accomplished with the indenter “free-hanging,” i.e., not in contact with any sample. A custom test method was designed to perform this characterization which comprised moving the indenter to typical vertical testing positions between +6 and +12 µm. Then, at each position, the instrument stiffness and damping were measured at 7 specific frequencies between 15 and 110 Hz. For each position–frequency combination, the instrument stiffness and damping were measured 30 times in succession. Each one of these 30 measurements comprised measuring (F 0/z 0)cos ϕ and (F 0/z 0)sin ϕ over a brief period and averaging over the period to report a single value of κi and a single value of χi, respectively. The standard deviations of these 30 independent measurements, σ1 and σ2, were used to calculate the relevant uncertainties for that particular position–frequency combination as
 $$\delta S = \surd 2\delta {\kappa _i} = \surd 2\left( {2{\sigma _1}} \right)\quad ,$$
and
 $$\delta \left( {{D_{\rm{s}}}\omega } \right) = \surd 2\delta {\chi _i} = \surd 2\left( {2{\sigma _2}} \right)\quad .$$
It should be noted that the standard deviations are doubled to achieve a 95% confidence interval.
2. Hydrogel testing
The gels were tested in a custom holder having a surface area of 25 mm2 and a depth of 4 mm. Sequential indents on the gel were separated by at least 200 µm. The tip was cleaned after each indent to prevent any material being transferred to the subsequent indent location. This was achieved by alternating gel indents with quick indents on a piece of double-sided Scotch tape (3M, MN, USA) mounted on an adjacent sample puck.
Each nanoindentation test on the gel was performed at a particular pretest compression and a particular frequency. A first series of indents was made wherein the oscillating frequency was fixed at 110 Hz, and the pretest compression was varied (3–13 µm). A second series of indents was made wherein the pretest compression was fixed at 5 µm and the oscillating frequency was varied (5–110 Hz). Each experimental condition (compression–frequency combination) was repeated at three different sites on each of three different gel samples for a total of nine independent indentations per condition.
Each nanoindentation test on the gel comprised two integrated parts: (i) the measurements of the gel, followed immediately by (ii) dynamic calibration of the instrument. For the first part of the test, the indenter was brought into full contact with the surface of the gel as indicated by a consistent shift in the phase angle of the displacement oscillation. To ensure a consistent phase shift, the phase was monitored over a number of data points to exclude random spikes which would erroneously indicate contact.Reference Akhtar, Draper, Adams and Pfaff35 However, once the surface detection requirement was fulfilled, the initial contact was set to the first point in that sequence. Next, the prescribed pretest compression was applied. Finally, the indenter was vibrated at the prescribed frequency with an oscillation amplitude of 500 nm, and the first terms of Eqs. (7) and (8) were measured. These are the total system stiffness and damping, respectively, from which the instrument contribution had to be measured and subtracted as described next.
The second part of the test–the in situ dynamic calibration of the instrument–comprised moving the entire actuator up approximately 1 mm, leaving the indenter column at the test position (the same raw displacement at which the test was conducted) yet not in contact with anything. At this position, the indenter was oscillated at the testing frequency and the response was measured. Specifically, the quantities (F 0/z 0)cos ϕ and (F 0/z 0)sin ϕ were averaged over a brief period and recorded for use in Eqs. (7) and (8) for the quantities (K i − m iω2) and (D iω), respectively [recall Eqs. (5) and (6) for the case of a free-hanging indenter]. By this method, the instrument contribution to the total response was measured as well as possible. Finally, the stiffness and damping were calculated according to Eqs. (7) and (8), and the complex moduli and loss factor were calculated according to Eqs. (2) and (3).
IV. RESULTS AND DISCUSSION
A. Nanoindentation uncertainty
Under most experimental conditions (position–frequency), the uncertainties in instrument stiffness and damping were less than 0.1 N/m. For any given condition, the uncertainties were not greater than 0.4 N/m (Fig. 4). The lowest uncertainty was consistently observed at 110 Hz, which is near the resonant frequency of the actuator. This was expected because this is the condition under which the actuator itself is most dynamically compliant. This observation guided our choice of 110 Hz as the best frequency for performing the series of indents wherein compression was systematically varied (Sec. IV.B). We did not test above the resonant frequency because we expected the uncertainties in both stiffness and damping to increase significantly with the dynamic stiffness and damping of the actuator.
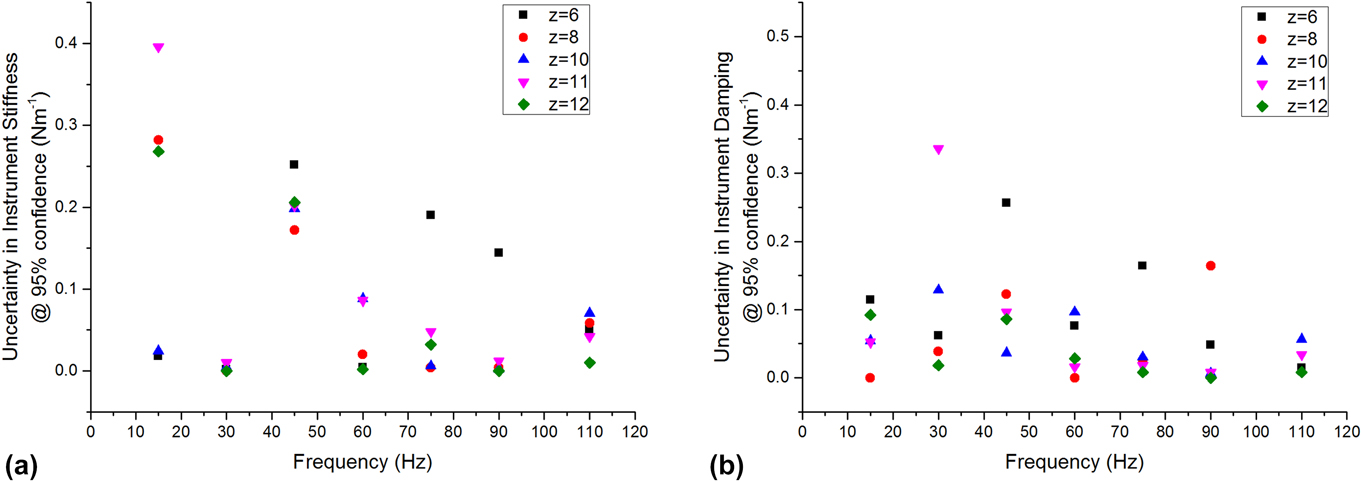
FIG. 4. Measurement uncertainty in (a) stiffness and (b) damping, conducted with a free-hanging indenter as a function of position and frequency.
As a practical matter, all testing were done with a frustum indenter purchased prior to this analysis, having a radius of 50 µm. However, this uncertainty analysis supports the use of such a punch to produce an adequate contact stiffness on these gels, which have a shear storage modulus on the order of 20 kPa. Based on our previous study on similar LMWGs, the gels were expected to have a shear modulus of at least 20 kPa.Reference Draper, Mears, Castilla, King, McDonald, Akhtar and Adams9 Recalling that Eq. (16) estimates the contact radius required for a 2% relative uncertainty in shear modulus, we used the directly measured uncertainty to calculate
 $$a > 50\left( {1.4} \right){{\left( {0.1\;{{\rm{N}} / {\rm{m}}}} \right)} / {\left[ {8\left( {20\;{\rm{kPa}}} \right)} \right]}}\quad ,$$
or
 $$a > 43.8\;\mu {\rm{m}}\quad {\rm{.}}$$
B. Effects of pretest compression by nanoindentation
We observed slight, but significant, sensitivity to pretest compression (Fig. 5). The relatively large scatter at the smallest pretest compression of 3 µm indicated incomplete contact between the punch face and the gel surface. For compressions of 5 µm and greater, the storage modulus steadily decreased, while the loss modulus remained constant, effecting a net increase in loss factor. In addition, we noted that the standard deviation was much higher at compressions above 5 µm. These observations guided our choice of 5 µm, or 10% of the punch radius as the best compression to use for the series of varied-frequency indentations. This compression was just large enough to make full contact, yet not so large as to significantly affect the measurements.

FIG. 5. (a) G′, (b) G″, and (c) loss factor, i.e., tan δ, shown as a function of differing compression applied to the gels with nanoindentation. Error bars represent standard deviation (9 measurements for each precompression value).
The variation in properties with compression may be due to significant violation of the assumption of linear viscoelasticity inherent to the analysis [Eqs. (2) and (3)], or due to true material changes, or a convolution of both effects. In PDMS, wherein true material changes with compression are minimal, it is easier to attribute the observed effects of compression to the violation of the assumption of linear viscoelasticity which undergirds the analysis.Reference Du, Cheng, Lu and Zhang36 In this work, the assumption of linear viscoelasticity is certainly suspect when the pretest compression exceeds 10% of the punch radius. However, with hydrogels that exhibit significant poroelasticity, one might expect compression to cause real changes in the material that are manifest in the measured shear modulus. We lean toward this explanation for decreasing modulus with compression because the mechanical behavior of poroelastic materials is strongly dependent on fluid flow through the network. Reduced fluid flow has been reported in precompressed poroelastic materials.Reference Jönsson and Jönsson37 In microscale indentation experiments on polymeric hydrogels, the modulus was found to decrease slightly with indentation depth, and this was related to the poroelastic response of the materials.Reference Kalcioglu, Mahmoodian, Hu, Suo and Van Vliet29,Reference Galli, Comley, Shean and Oyen38 Macroscale compression of LMWGs has shown that the gel behavior varies depending on the level of strain and the speed of compression, attributed to the movement of fluid in the gels.Reference Adams, Mullen, Berta, Chen and Frith26
C. Frequency-dependent properties: Nanoindentation and rheology
Each method returned self-consistent, albeit different, values for complex modulus (Fig. 6 and Table I). Nanoindentation returned the greatest values for shear storage and loss modulus, whereas parallel plate rheometry returned the lowest values. However, by every measurement technique, these LMWGs were largely elastic, as manifested by the relatively low loss factor (<0.20) [Fig. 6(b)]. Energy added to this gel in testing was substantially returned. Others have observed similar behavior for LMWGs.Reference Draper, Mears, Castilla, King, McDonald, Akhtar and Adams9,Reference Sathaye, Mbi, Sonmez, Chen, Blair, Schneider and Pochan39 The material cause for this elasticity was the mechanical dominance of the fibrous microstructure. Confocal imaging (Fig. 7) confirmed that the gels were composed of an evenly dispersed network of very fine fibers. Furthermore, with increasing frequency above 5 Hz, the hydrogel became more elastic (decreasing tan δ) as the fibrous structure became dynamically stiff.
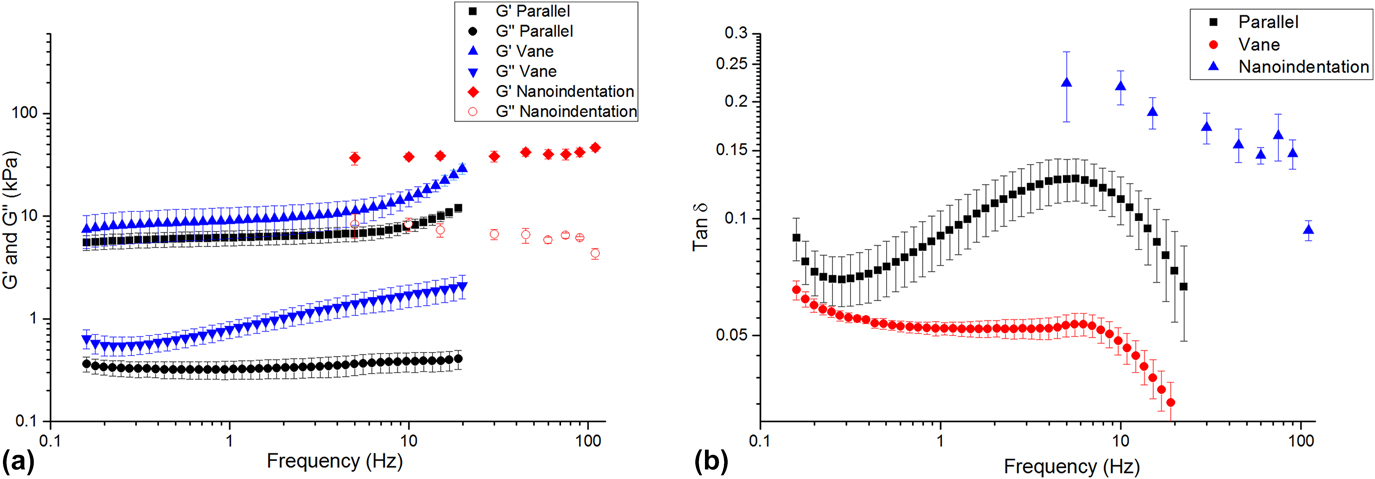
FIG. 6. (a) Complex shear modulus versus frequency for the LMWG, as measured by nanoindentation and bulk rheometry. (b) tan δ versus frequency for each technique.
TABLE I. Shear modulus and tan δ as measured by each technique at 10 Hz. Data are presented as mean (SD).


FIG. 7. Confocal image showing fine fibrous network making up the LMWG microstructure.
There are a number of possible reasons for the differences in the absolute values returned by each method. The parallel-plate and vane-in-cup rheometry methods both probe the bulk properties of the LMWG at the scale of about a centimeter. Although the length-scale is similar for both methods, absolute differences in the measured moduli are expected due to the differing test configurations and associated loading conditions.Reference Yang, Wei, Hu, Zhou and Lyu40 The vane-in-cup configuration yielded greater moduli than the parallel plate configuration. The vane-in-cup geometry is generally preferred for LMWGs because loading the sample into the parallel plate fixtures may weaken the microstructure.Reference Stokes and Telford25 G″ is very low with the parallel plate configuration relative to the vane setup (more than 4× smaller) suggesting that this is a plausible explanation because G″ is particularly sensitive to a hydrogel’s microstructure.Reference Adibnia and Hill41 Note, by contrast, G′ is approximately 2× lower with the parallel plates than the vane configuration.
As nanoindentation values (for G′ and G″) are significantly higher than those obtained with both vane-in-cup and parallel plate rheometry, the question remains as to whether this is a length-scale effect or related to other factors. When considering G′, length-scale effects seem unlikely here because confocal imaging shows that nanoindentation with a 100-µm flat punch is “large” relative to the dense network of fibers, with submicron diameters (Fig. S2, Supplementary Material). Others have also reported that the elastic modulus returned with nanoindentation for hydrogels is higher than that obtained with bulk measurement techniques.Reference Galli, Comley, Shean and Oyen38 Galli et al.Reference Galli, Comley, Shean and Oyen38 commented that it is unclear exactly why this trend is observed. Buffinton et al.Reference Kocen, Gasik, Gantar and Novak42 found significant differences in the elastic modulus of polyacrylamide hydrogels measured with nanoindentation as compared to pipette aspiration and bulk compression. They attributed these to differing loading configurations and the associated flow of water in the gels during the testing. In our case, this may also be a contributory factor for the higher G″. Relative to rheometry, nanoindentation is an unconstrained test, due to the existence of a large free surface. In response to excitation, fluid moves around the indenter, thus leading to greater energy loss. By comparison, rheometry is more constrained because the fixtures are large, relative to any free surface. The constraining effect of the fixtures inhibits fluid movement so that the material behaves more elastically. By analogy, an open-pore, fluid-filled material will manifest greater damping than a closed-pore version of the same material wherein energy is not dissipated by viscous travel through tight spaces. Differences in absolute values may also be influenced by temporal differences with the techniques, as a single oscillatory nanoindentation test occurs much more quickly (<60 s) than a rheometry test (>10 min). We further suspect that nanoindentation returns higher G″ because it causes the least disruption to the microstructure of the gel. Further work is required to conclusively understand the different responses.
Despite absolute differences with each technique, the moduli obtained in this study are in the same order of magnitude and we suggest that oscillatory nanoindentation can be used to complement rheology. It should be noted that hydrogel materials exhibit complex viscoelastic behavior and their properties can be analyzed in a number of different ways. However, the advantages and limitations of each technique have to be acknowledged.Reference Kocen, Gasik, Gantar and Novak42
V. CONCLUSIONS
We conclude that oscillatory nanoindentation can be used for accurate mechanical characterization of hydrogels as a complementary technique to rheometry. Relative to rheometry, nanoindentation may yield significantly different absolute values for properties because it probes a smaller volume with a different constraint, but it captures the same trends in mechanical behavior with frequency. Nanoindentation is particularly useful for understanding the influence of the localized microstructure on the mechanical behavior of these gels. However, the experimental parameters for oscillatory nanoindentation, especially the radius of the punch face, need to be carefully selected in light of instrument uncertainty. We believe that other nanoindenters of the same make and model will have uncertainties similar to what we have measured here: about 0.1 N/m for both instrument stiffness and damping. For other kinds of nanoindenters, the same uncertainties should be measured by a similar method to ensure that those uncertainties are small relative to measured values.
Supplementary Material
To view supplementary material for this article, please visit https://doi.org/10.1557/jmr.2018.62.
ACKNOWLEDGMENTS
RA is grateful to the Royal Academy of Engineering/Leverhulme Trust for a Senior Research Fellowship (LTSRF1617/13/76). The DCM-II nanoindenter used to conduct this study was funded by a Royal Society grant (RG103629) awarded to RA. We thank Ana María Fuentes Caparrós for collecting the confocal microscope images. The EPSRC is thanked for funding the confocal microscope used in this project (EP/J004790/1 and EP/N007417/1). We thank Finlay Walton (University of Glasgow) for help setting up the confocal microscopy. DJA thanks the EPSRC for a Fellowship (EP/L021978/1), which also funded ERD.


 Open access