


Introduction
Economics is not a gender or racially diverse field (Bayer and Rouse Reference Bayer and Rouse2016; Collins Reference Collins2000; McDowell, Singell, and Ziliak Reference McDowell, Singell and Ziliak1999). And even though this lack of diversity has been a point of discussion for at least four decades, the field continues to be noted as toxic for women and one in which minorities are largely underrepresented (AEA 2019; Wu Reference Wu2017).Footnote 1 These inequalities are observed as early as in undergraduate degree programs, where the percentage of women is lower than in many other predominately male fields (Bansak and Starr Reference Bansak and Starr2010) and continues throughout graduate programs and careers in the form of less representation in academic ranks and the publications needed for career advancement (Bayer and Rouse Reference Bayer and Rouse2016; West et al. Reference West, Jacquet, King, Correll and Bergstrom2013).Footnote 2
Although initiatives to recruit more women undergraduate majors have been undertaken, and programs to support the early-career pipeline through mentoring programs have recently made headway (Bayer and Rouse Reference Bayer and Rouse2016; Rouse Reference Rouse2009), progress has not been rapid (Kahn Reference Kahn1995). This was made all too clear when Wu (Reference Wu2017) quantified the degrading language used to identify women economists on the now notorious Economics Job Market Rumors website. A few associations are now working to improve the climate of the profession (AEA 2018a; 2018b). In particular, it is the work of the Northeastern Agricultural and Resource Economics Association (NAREA), and the call by Sarah Jacobson (Reference Jacobson2018) to do more to improve upon diversity and inclusion, that we contribute to by analyzing organizational and survey data on membership and association benefits in order to identify concrete steps that associations can take to increase diversity in economic associations and association leadership positions.
Professional association meetings provide important networking opportunities (Garfield Reference Garfield1991), can have a positive impact on citation rates, and are an essential part of the scientific process, as they encourage peer input into the most recent advances of the field (Di Vaio, Waldenstrom, and Weisdorf Reference Di Vaio, Waldenstrom and Weisdorf2012; Taylor, Fender, and Burke Reference Taylor, Fender and Burke2006). While a significant number of PhD economists become members of at least one professional economic association over the course of their careers, the benefits of these associations, and the meetings they support, tend to favor those who need these benefits least. For example, graduate students and postdocs face a greater number of obstacles compared to academic faculty when it comes to having a paper accepted to a meeting and obtaining the funding needed to attend (Garfield Reference Garfield1991). And women are often underrepresented as keynote speakers (Lundberg and Stearns Reference Lundberg and Stearns2019), less likely to engage in question-and-answer sessions (Gunther, Grosse, and Klasen Reference Gunther, Grosse and Klasen2017), and more likely to experience harassment (Shinall Reference Shinall2018). Furthermore, the “childcare-conference conundrum” affects mothers more than fathers (Calisi Reference Calisi2018).Footnote 3 While discussions about increasing diversity in economics have noted the role of mentoring, the pipeline, and undergraduate exposure, the role that associations and meetings can play in advancing the careers of women and minority groups has been largely overlooked in the literature.
One overlooked way of supporting the careers of women and minority economists is by encouraging their participation in associations and their annual meetings. The limited research on economic associations focuses on identifying drivers of membership and meeting attendance. Evidence suggests that membership numbers are linked to the number of PhDs and PhD programs (Kilmer Reference Kilmer2004), the annual meeting date and location, and journal access. Meeting dates that are more accommodating to academic schedules and meeting locations that are easily accessible are relatively less costly (Siegfried and Nelson Reference Siegfried and Nelson1979) and often translate into more meeting attendees and association members in any given year (Siegfried Reference Siegfried2002; Broder, Bergstrom, and Kriesel Reference Broder and Bergstrom1994). Finally, access to and quality of the association journal has historically been an important membership benefit (Siegfried Reference Siegfried2002). Our study updates the outdated literature in this area, uses a more sophisticated empirical strategy, and is more comprehensive because we also use member survey data. We provide insights on issues not considered in previous research, such as how gender, income status, and professional status affect meeting attendance. Findings from our paper suggest that although there is no gender gap in membership, there is a gender gap in meeting attendance. Women do seem to face additional barriers to attending meetings and accessing their associated career benefits. Similarly, lower income status is also a barrier to attending meetings.
This paper identifies the determinants of membership and meeting attendance on two different scales to identify policies that can increase participation and diversity in the profession and to highlight different policy prescriptions for large and small associations (like NAREA). The term diversity can refer to gender identity, age, race, ethnicity, nationality or national origin, sexual orientation, religion, disability, health condition, physical appearance, marital status, parental status, socioeconomic status, professional status, or personal connections. Due to data availability, we are only able to focus on socioeconomic status, gender, and professional status and to refer to these aspects as diversity in the paper, although we readily admit that other elements of diversity are equally important – if not more – to study at the present in time.
The remainder of this paper proceeds as follows: in the next section, “Data and Descriptive Statistics,” we describe the membership and survey data that we have collected from external sources and our own survey. Then, in the following section, “Empirical Methodology and Results,” we use two empirical strategies to identify policies for increasing participation in economics associations and annual meetings. Because our data are non-stationary, we use a vector error correction model (VECM) to analyze time-series data on membership and meeting attendance of three associations over time and to identify the impact of policy on membership and attendance. In addition, we use a Poisson model to estimate individual membership and attendance while controlling for socioeconomic characteristics of members. We consider the role of socioeconomic status, gender, and professional status in the determinants of these models and provide practical recommendations on how NAREA and different types of associations can sustain or increase the diversity of their membership and participation in their meetings. In the “Conclusions” section, we offer with suggestions for how our findings can be used to increase diversity in economics.
Data and Descriptive Statistics
Two sources of data are used to investigate the determinants of association membership and meeting attendance. They are a 40-year panel from three large economics associations and survey data from 2,931 members of four associations. We group economic associations into four categories: national, regional, field, and regional-field. The American Economic Association (AEA), founded in 1885, is a national association in the United States (Bernstein Reference Bernstein2008). The four primary regional associations include the Eastern Economic Association (EEA), Midwest Economics Association (MEA), Southern Economic Association (SEA), and Western Economic Association International (WEAI).Footnote 4 There are other regional associations in this category, which target smaller geographic areas but remain open to all subdisciplines, such as the New York State Economics Association. Field associations target a subdiscipline within economics and have no regional boundaries, such as the Agricultural and Applied Economics Association and Urban Economics Association. Finally, regional-field associations target specific subdisciplines within a regional boundary, such as NAREA and Midwestern Law and Economics Association.
Association Time-Series Data
Economic association data on membership, dues, meeting attendance, meeting registration fees, and meeting locations for the 40-year time period after 1975 (or the first year available) were obtained from Siegfried (Reference Siegfried2002) (which has data on AEA membership history), association records, staff, and journals for the AEA, SEA, and WEAI.Footnote 5 These data suggest that average AEA membership increased from over 19,000 in the 1970s to an average of 21,109 between 1986 and 1995. Then between 2006 and 2015 it declined to 17,945 (see Table 1). Average SEA membership fell from a total of 1,733 between 1975 and 1985 to approximately 1,400 between 1986 and 1995, fell again in the decade that followed, but then increased to 1,536 between 2006 and 2015. Average WEAI membership peaked at 2,053 in the 1986 to 1995 time period and fell in each time period since. Concurrently, average attendance at the annual meetings increased by 97, 27, and 74 percent, respectively, for the AEA, SEA, and WEAI between 1975 (or the earliest year for which we have data) and 2015. Membership dues increased significantly for each association over the period 1975–2015, with SEA dues increasing almost 800 percent, although the AEA dropped its dues from $98 to $40 in 2013. At the same time, real conference registration fees also increased for all associations over this period at a higher rate than membership fees, with the average SEA registration fees increasing by more than 2000 percent.Footnote 6 Table 1 also contains summary statistics on dummy variables for meeting locations in the largest cities within the regions and regular meeting rotations, since these cities are expected to attract more meeting attendees due to the ease of travel and relatively lower travel costs (Siegfried Reference Siegfried2002; Siegfried and Nelson Reference Siegfried and Nelson1979). These cities include New York; Washington, DC; Chicago; and Philadelphia for AEA; New Orleans and Washington, DC for SEA; and Los Angeles and San Francisco for WEAI. The AEA never held a meeting in Los Angeles, while the SEA and WEAI (domestic) never held meetings in the other cities outside of their locational centers.
Table 1. Descriptive Statistics of Economic Association Data from 1971 to 2015
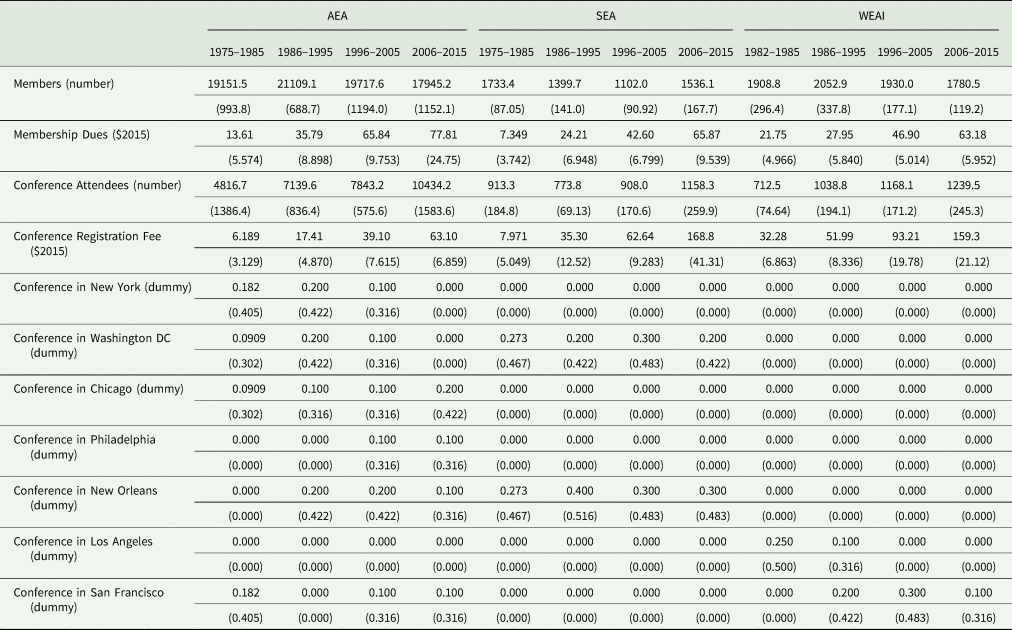
Notes: Standard deviations in parentheses.
A Dickey-Fuller (DF) test suggests that many of the variables included in our models of AEA, SEA, and WEAI membership and attendance are non-stationary (see Table 2) and therefore that including them in the time series analysis would produce unreliable and spurious results (Johansen Reference Johansen1991; Engle and Granger Reference Engle and Granger1987). We do, however, find the differenced variables to be stationary and therefore stationarize the time series by estimating the year-to-year differences of the independent variables (see Table 2).
Table 2. Dickey-Fuller Unit Root Tests
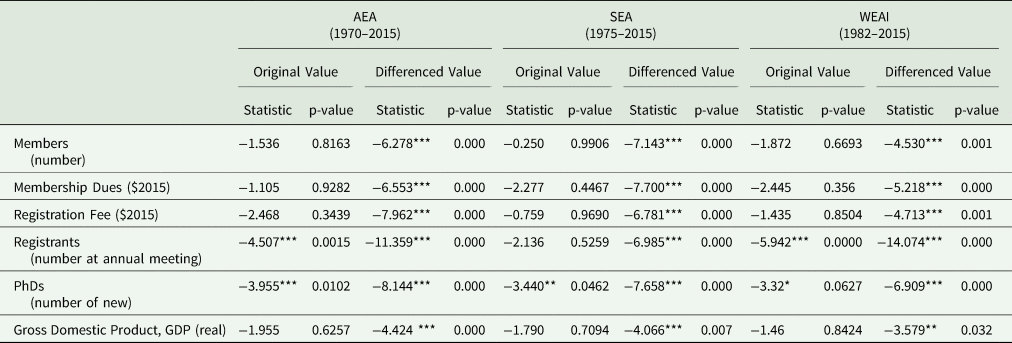
Notes: The null hypothesis is that the variable is non-stationary; *significance at the 10%; ** significance at 5%; *** and significance at 1%.
Member Cross-Sectional Survey Data
Our second set of data includes survey responses from 2,931 participants from four economics associations, including one national, regional, field, and regional-field association (NAREA).Footnote 7 In each case, members were emailed an invitation to participate in an online survey. Two follow-up emails were sent to each group, resulting in a response rate ranging from 16 to 44 percent (see Table 3). Response rates are slightly lower if we only include completed surveys for variables of interest.Footnote 8 The survey instrument was identical across associations, except for a few tailored questions added by the associations themselves (not reported here). The first part of the survey gathered information on respondent membership benefits, ranking of the reported benefits, information on membership status, and attendance at the association's annual meeting over time. The second part of the survey gathered demographic information, including employment status, type of employer, field of expertise, educational attainment, gender, and income.
Table 3. Response Rates of Economic Association Surveys
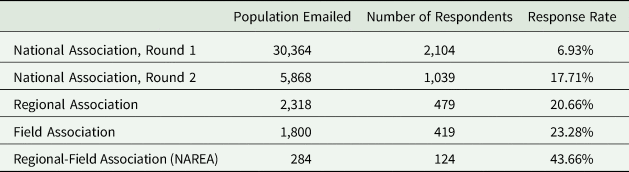
Notes: The response rate for the national association is estimated to be approximately 16%. The first round of the survey was administered to an old, but public, listing of members. The second round of the survey was sent to a subset of current association members (respondents were not permitted to complete the survey twice). The combined rounds divided by the current membership is approximately 16%.
Table 4 contains descriptive statistics for several key survey questions. We find that between 28 and 68 percent of the survey respondents indicate that their association provides benefits that other economics associations do not. On average, respondents in the national association hold their membership longer (10–20 years) than the other associations (2–5 years). Approximately 44–64 percent of association members pay membership fees out-of-pocket. Respondents of the national and field associations are on average members of three associations, compared to four associations for the others. Regional associations appear to attract higher proportions of respondents employed by universities, with 89 percent, compared to 66–78 percent in other associations. The percentage of respondents that hold a doctorate is highest for the regional association (96 percent). The percent of female respondents, which is likely representative of female participation in the association, is lowest for the national association (20 percent) and increases as the association size decreases and specialization of the association increases. Approximately 30 percent of NAREA (regional-field association) respondents are female. For reference, the share of female economics PhDs in 2016 was 31 percent, a figure that has remained fairly constant in the U.S. over the last 20 years (Lundberg Reference Lundberg2018). The average household income is between $120,000 and $159,000 for respondents of the national association and lower for the respondents of other associations.Footnote 9
Table 4. Descriptive Statistics from Economic Association Surveys
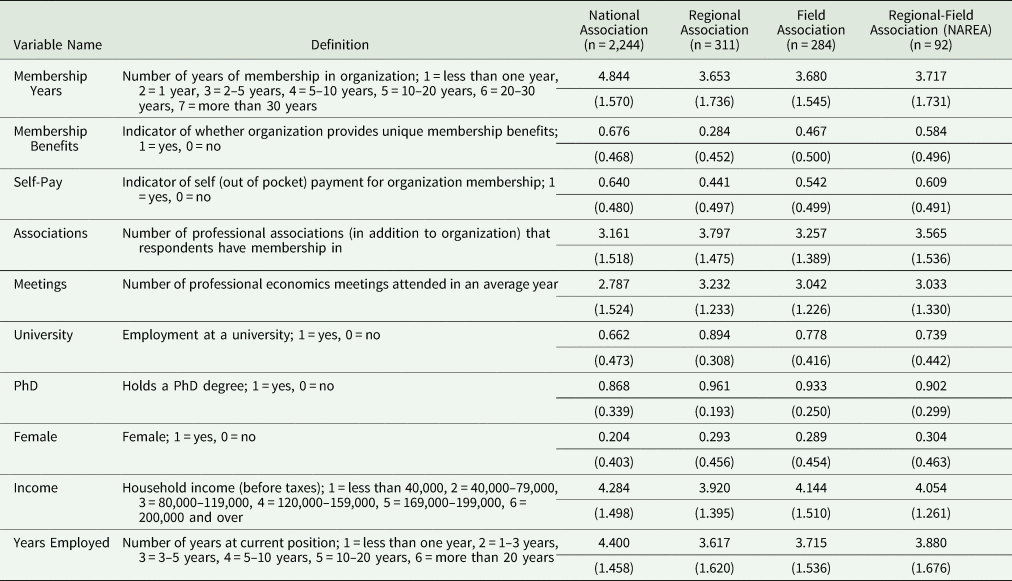
Note: Standard deviations in parentheses.
The top-ranked benefits reported for associations include access to the association journal, the annual meeting, job market opportunities, staying professionally current, and networking (see Table 5). With the exception of the national association, up to 64 percent or more respondents note that networking and the annual meeting are the most important benefits of the association (combined). For NAREA, networking is ranked as the most important benefit of membership. Respondents prefer to maintain membership with more than one economic association, and they are neutral in the belief that cost is an important determinant of membership (see Table 6). Given that members receive different benefits from different types of associations, it's not surprising that most respondents prefer to maintain more than one membership. Members of all associations believe that location is a marginally important determinant in the decision to attend the annual meeting and prefer to attend meetings that are close to airports. Respondents are on average indifferent about whether they maintain membership only when they attend the annual meeting; although our estimations in the next section suggest that attendance at the annual meeting is becoming a more important influence on maintaining memberships. Our membership data suggest that the ratio of meeting participants to association members is increasing over time (see Figure 1).
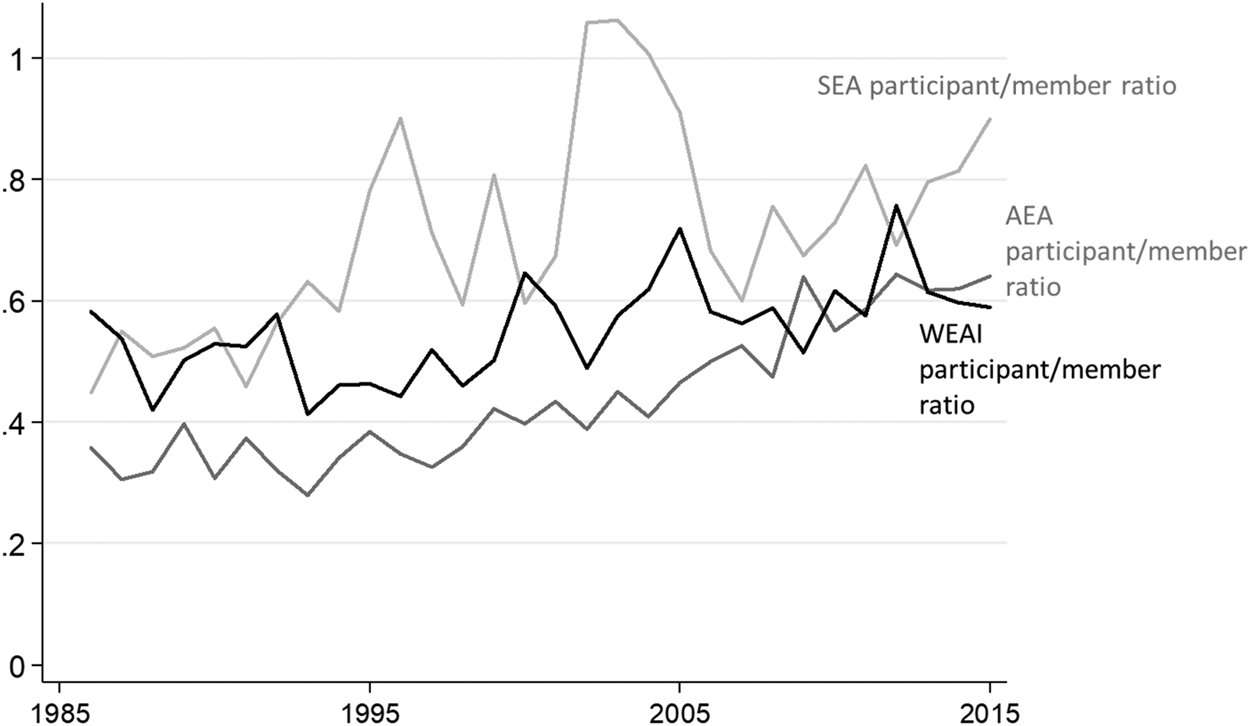
Figure 1. Ratio of Meeting Attendees to Association Members from 1986 to 2015 for AEA, SEA, and WEAI
Table 5. Highest Ranked Association Benefit by Association Type (Survey Data)
(top ranked benefit; percent of respondents to note benefits)

Table 6. Association Preferences by Association Type (Survey Data)
(Likert: 1 = strongly disagree, 2 = disagree, 3 = neither agree nor disagree, 4 = agree, 5 = strongly agree)
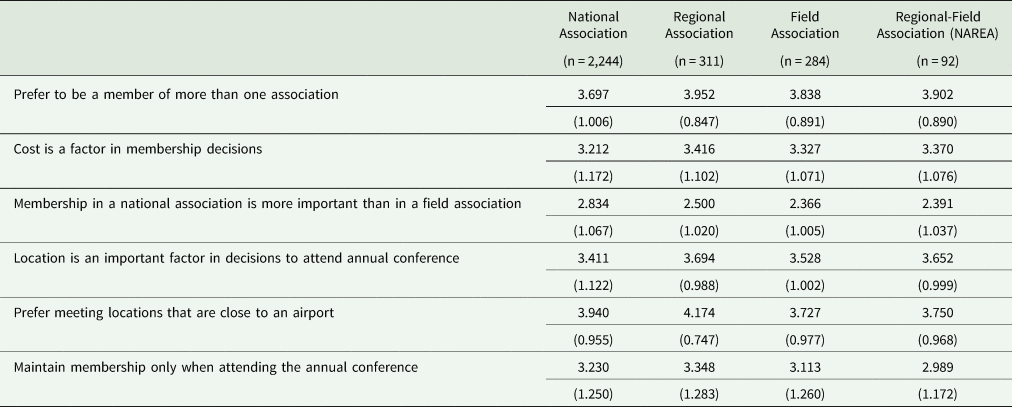
Note: Standard deviations in parentheses.
Empirical Methodology and Results
We use two empirical strategies to identify policies to increase participation in economics associations and annual meetings. First, because our data are non-stationary, we (1) use a vector error correction model (VECM) to analyze time-series data on membership and meeting attendance of three associations over time, and (2) identify the impact of various policies imposed by associations on membership and attendance. Second, we use a Poisson model to estimate individual membership and attendance while controlling for socioeconomic characteristics of members.
Association Time-Series Models and Results
We first estimate the factors that drive membership and meeting attendance over time. We assume that the time-series relationship for membership in time t (Mt) is given by equation (1), where total association membership is a function of membership dues (Pt), lagged membership (Mt-1), meeting attendance (At), the number of new economics PhDs earned in the U.S. (PhDt), national gross domestic product (GDPt), dummies for association policy changes (Policyt), and locational dummies for the annual meeting (Xt).

Similarly, the relationship for meeting attendance (total members to attend the annual meeting) is given by equation (2), where the number of attendees is a function of meeting registration fees (Ft), lagged meeting attendance (At-1), the number of new economics PhDs earned, national gross domestic product, dummies for association policy changes, and location dummies for the annual meeting.

We estimate membership and meeting attendance models for the time series we have for each association (1970–2015 for AEA, 1975–2015 for SEA, and 1982–2015 for WEAI). The general VECM model takes the general form

where m is an integer between 1 and k that defines the lag placement of the VECM term, k is the lag length, and the deltas represent the differenced independent and dependent variables (to make our data stationary). We identify the number of lags to be included using the Johansen integration test (Johansen Reference Johansen1991) and estimate the model with these lags (see Table 7). Tests for cointegration identify such evidence in the estimations of membership and meeting attendance for all three associations (see Table 8). Our final models are chosen based on the results from the lag selection (see Table 7) and Johansen tests for cointegration (see Table 8). The lags and ranks are also noted in the VECM estimations presented in Table 9.
Table 7. Lag Selection
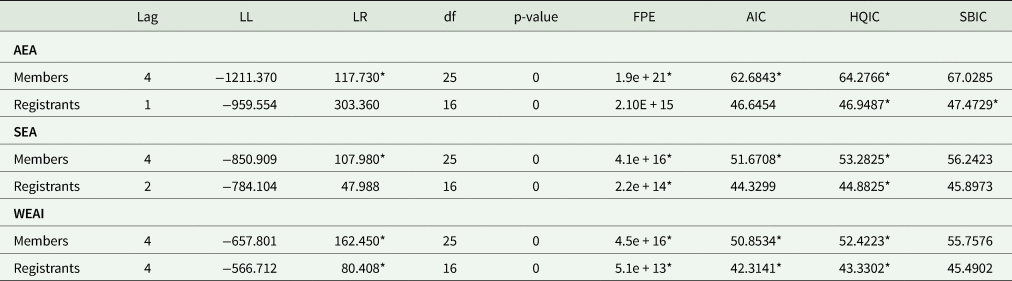
Notes: *The test confirms the number of lags noted in the table.
Table 8. Johansen Tests for Cointegration

Notes: *The test confirms cointegration at the rank noted in the table.
Table 9. VECM Estimations for Association Membership and Conference Registration

Notes: *significance at 10%; ** significance at 5%; *** and significance at 1%. Additional covariates include members, membership dues, registration fees, annual meeting registrants, PhDs, GDP (See table 6 for a listing) and their respective lags. We did not discuss or present these results because (with the exception of prices, which are discussed in another context) these variables cannot be influenced by policy.
We include at least one policy variable in each of our estimations.Footnote 10 For AEA we identified two policy changes over this time period. First, in 2000 the association began to require at least one paper author be a member of AEA or one of the other affiliated associations (policy 1), and second, in 2009 AEA began to require that users of the online hotel reservation system for the conference were members (policy 2). For SEA we identified one policy change in the registration fee structure: in 2004 the meeting registration fee was higher for non-members. We identified one policy change for WEAI. In 1994 WEA added “International” to its name and began to hold (in addition to the annual meeting) biennial meetings in the Pacific Rim. It is likely that other policy changes, particularly in the early years of our dataset, also took place. If so, these policy changes are not in the institutional memory of these associations as far as we can discern. AEA has never charged different registration fees for members and non-members and WEAI has always charged a higher rate for non-members.
We discuss each association's short-run effects (see Table 9) and begin with the estimation of AEA membership and meeting attendance. We focus on the discussion of the policies noted above and the location decision.Footnote 11 The short-run results include differenced lags of the controls (GDP, lagged attendance, prices, conference registrants, and new PhDs) and policy and meeting location dummy variables (long-run results only include differences and thus no policy variables).Footnote 12 The results suggest that locating the annual meeting in New York increases attendance by 1,572 and locating the annual meeting in Washington, DC, increases attendance by 1,800. However, locating the annual meeting in these locations does not translate into increases in membership. The policy to require at least one paper author be a member of AEA (policy 1) is correlated with 1,894 fewer conference registrants and 2,196 fewer members. The requirement that attendees must be members to register in the meeting hotels (policy 2) is correlated with an increase of 2,164 conference registrants, but this policy was not correlated with an increase in membership.
We continue with the estimation of SEA membership and meeting attendance, where the short-run results suggest that locating the annual meeting in New Orleans increases attendance by 133 and locating the annual meeting in Washington, DC, increases attendance by 175. Locating the meeting in Washington, DC, also translates into an increase of approximately 149 new members, but there is no impact on membership when the annual meeting is held in New Orleans. These positive and significant Washington, DC, conference attendance results for both SEA and AEA make sense, since the city has the largest concentration of economists in the country.Footnote 13
We conclude with the estimation of WEAI membership and meeting attendance. According to our results, the policy initiated in 1994 to become WEA International had negative impacts on meeting attendance. According to our results, this decision decreased attendance at the annual meeting by 268. This might be because members treat the domestic and international meetings as substitutes, resulting in a decline in meeting attendance. Finally, the results suggest that locating the annual meeting in San Francisco increased membership by 167 members.
In sum, these estimations suggest that the findings from some previous less-sophisticated models (Siegfried Reference Siegfried2002; Siegfried and Nelson Reference Siegfried and Nelson1979) continue to hold: meeting locations in the largest cities attract more meeting participants. We also find that a portion of these meeting attendees are translated into association members. With these more general findings in mind, we advance our understanding of the type of members that are most impacted by these decisions with individual level data on perceived benefits of association meetings, meeting attendance, and association membership choices.
Association Survey Model and Results
While the estimations above can point to policies that can increase membership and annual meeting attendance, these policies do not address diversity, since they are based on association and not individual data. To explore policies that target different socioeconomic groups, we estimate membership and attendance with survey data and the Poisson model given by:

where individual i's count of memberships or meetings attended each year (Qi) is a function of price (Pi) that is proxied by an indicator of payment out of pocket, household income (Ii), and a series of socioeconomic characteristics (Si), including the number of years employed, gender, holding a PhD, university employment, and years of membership. The stochastic disturbance term (ɛi) represents the net impact of all unobservable factors that influence the dependent variable.Footnote 14
Results in Table 10 suggest that members of the regional and regional-field associations (NAREA) hold more association memberships than those from the national association, the comparison unit. This is an expected result, since regional-field members are likely to be regional or national members, but national members are not necessarily regional-field members. But NAREA members and field association members do not attend more meetings, compared to those from the national association. Regional association members attend more meetings, compared to national members. This makes intuitive sense, since a higher percentage of regional members find presenting a paper to be the most valuable benefit of meetings, compared to all other types of members (see Table 5). Field association members are not distinguished from national association members in memberships or meeting attendance. The number of years a respondent has been a member of their association is also positively associated with the number of memberships held, but not with meetings attended. As expected, in Model 1 and 2, attending more meetings has a positive impact on the number of memberships. Models 2 and 4 are included to identify if there is a tenure effect. We expect that because teaching and research incentives can differ before and after a faculty member obtains tenure, these different incentives may impact association membership and attendance at meetings. In Model 2, we do see this effect, since the dummy variable for those with less than six years employment is positive and statistically significant.
Table 10. Poisson Estimation of the Number Association Memberships and Number of Meetings Attended per Year using Survey Data

Notes: Robust standard errors in parentheses; * significant at 10%; ** significant at 5%; *** significant at 1%
Duration and type of employment affects the number of memberships and meetings attended. University employees are members of more associations and attend more meetings than others, all else being equal. However, those who have worked at a university for more than six years, a proxy for the post-tenure period, attend fewer meetings compared to respondents with less than six years at a university (Models 3 and 4). The number of years employed is negative and significantly related to the number of meetings, but has a positive impact on the number of memberships in Model 1. We also identify what we term a tenure effect: faculty who have been employed for more than six years are less likely to attend meetings (Model 4). Together, these results suggest that early-career scholars attend conferences and present their research more often, during what is likely the pre-tenure years and then reduce the number of meetings per year as careers advance, but memberships are still maintained.
There are several interesting insights that can be drawn across demographic characteristics. First, household income does not affect the number of memberships economists hold, but it does affect how many meetings per year economists attend. Respondents who self-pay tend to hold more memberships but attend fewer meetings. Given the large expense of travel compared to association membership, it makes intuitive sense that lower household incomes and those who self-pay attend fewer meetings per year. Respondents that hold a PhD do not maintain more memberships, but they do attend more meetings. Another interesting result is that male economists do not appear to hold more memberships than female economists, but males do attend more meetings per year compared to females, suggesting that females face greater barriers for meeting attendance. This implies that there is no gender gap in terms of association memberships, which have little impact on career trajectory (since anyone can pay a membership fee), but a gender gap does exist for meeting attendance, which prevents women from accessing important opportunities for professional development.
Conclusions
This study analyzes time-series association data and cross-sectional survey data from a large sample of economic association members to draw conclusions on how NAREA and other associations can increase the diversity of association membership and meeting attendance. Our empirical results allow us to identify several barriers to meeting access. First, income status can be a barrier to meeting attendance. Because cost of travel is closely linked to meeting location and opportunity cost, this is one policy area under the direct control of association leadership. Similar to previous work, we find that meeting locations that are easily accessible and are relatively less costly (Siegfried and Nelson Reference Siegfried and Nelson1979) translate into more meeting attendees and association members in any given year (Siegfried Reference Siegfried2002; Broder, Bergstrom, and Kriesel Reference Broder and Bergstrom1994). Locating meetings in hard-to-reach locations disadvantages parents and those with lower levels of research funding. This points to implications about equitable access to meetings for economists across a broad range of institutions, with those from less prestigious institutions likely having less institutional support for travel. Results from member surveys confirm that those who pay out-of-pocket attend fewer meetings per year, which is more likely to be economists from less prestigious institutions.
Although AEA has taken measures to reduce membership fees for lower income levels, our results suggest that income is typically not a barrier to becoming a member. Survey data suggest that members do not place much importance on membership dues or meeting registration fees. Yet graduate students or low-income individuals may be more sensitive to membership fees, because they are less likely to have institutional support for travel. Subsidies or grants for student participants, new members, and low-income individuals could help provide better access to association services and help increase the diversity of members.
Our survey data also reveal heterogeneity across membership characteristics and perceived benefits: while a majority of association members are academic economists, the national association members tend to have higher incomes and participate in fewer annual meetings and associations. Furthermore, we find that the importance of networking increases as association size decreases. This points to the rationale for economists to maintain multiple memberships, since each association provides different professional development opportunities. NAREA and associations that are relatively small and focused on a region or field would therefore benefit from events that build on this strength, such as cocktail hours, meet-and-greet opportunities, mentoring programs, meeting field trips, and opportunities to participate in governance; networking services should specifically target those who are underrepresented in the profession. Associations can also build upon technological advances to supplement in-person networking opportunities. For example, social media, virtual meeting experiences, or mentoring experiences not directly tied to meeting attendance may be more equitable for those facing barriers to attending meetings and are likely to become more common and more advanced in a post-pandemic world. Of course, the global pandemic may pose different barriers to women and people of color, which needs to be carefully considered. Associations that are large and display other core competencies, such as job market activities and high-quality journals, should improve upon and maintain these services. Reducing bias in job market activities and publishing should be a priority for these associations.
Finally, we find important differences across demographic characteristics. We provide evidence that inequalities in meeting attendance do exist for women, lower-income individuals, and non-academic economists. We believe that underrepresented groups not directly analyzed in this paper face even greater barriers. Our time-series analysis of meeting attendance and membership show that association policy changes can influence membership. Furthermore, because our estimations also suggest that female economists attend fewer meetings than males but do not hold fewer memberships, we believe this points to inequalities and additional barriers women may face to attend meetings. To change this, associations should increase their support of women and underrepresented minorities by providing a more inclusive environment at meetings, providing meeting childcare services, providing more professional development opportunities targeting these members, and exploring other policy options with the groups of interest. NAREA has taken a leadership role in these endeavors by creating a committee on diversity and inclusion and starting several new initiatives to attract and elevate diverse members. We suspect these findings can help target their next steps.
Conflict of Interest
The authors have no conflicts of interest to declare.
Data availability statement
The association time-series data and conference data from AEA, SEA, and WEAI available upon request and subject to association approval.


 Open access