


1. Introduction
Interest in the relationship between farm size and productivity in Africa has been driven in recent years by rising doubts about the potential for smallholder-led agricultural growth in Africa (Collier and Dercon, Reference Collier and Dercon2014) and by the rising share of medium-scale farms in many African countries (Jayne et al., Reference Jayne, Chapoto, Sitko, Nkonde, Muyanga and Chamberlin2014, Reference Jayne, Chamberlin, Traub, Sitko, Muyanga, Yeboah and Anseeuw2016). In light of such trends, major policy debates are arising over how the region’s remaining prime agricultural land should be allocated, especially in the wake of rising land scarcity and land prices (Deininger, Savastano, and Xia, Reference Deininger, Savastano and Xia2017; Holden and Bezu, Reference Holden and Bezu2016) and challenges associated with access to land for young people (Bezu and Holden, Reference Bezu and Holden2014).
The inverse farm size-productivity relationship (IR) refers to the observation that small plots or farms produce more output per unit area than larger ones. The IR has been one of the enduring justifications for supporting smallholder farmers in developing countries. Recent studies upholding the inverse relationship between farm size and productivity have generally been based almost entirely on samples of farms cultivating less than 10 ha (Ali and Deininger, Reference Ali and Deininger2015; Carletto, Savastano, and Zezza, Reference Carletto, Savastano and Zezza2013; Larson et al., Reference Larson, Otsuka, Matsumoto and Kilic2014; Barrett and Bellemare, Reference Barrett and Bellemare2010). For instance, less than 1% of the farms contained in the Living Standards Measurement Study-Integrated Survey on Agriculture (LSMS-ISA) analyzed in the studies cited above cultivate more than 10 ha. Not much is known about the relationship between output per unit area and farm size beyond 5 ha (Jayne et al., Reference Jayne, Chamberlin, Traub, Sitko, Muyanga, Yeboah and Anseeuw2016). Although a few recent studies have gone beyond 5 ha, the literature on IR beyond 5 ha is scanty. Consequently, the available evidence is unable to sufficiently guide government efforts to promote agricultural productivity through land policies that encourage larger farm units.
Using data from southern Ghana, we study the IR with farm sizes that are greater than 5 ha. This paper makes two contributions. First, we add to the body of evidence on the existence of IR beyond 5 ha and examine the idea of a U or L-shaped relationship between productivity and farm size that has been observed in recent studies. The measures of productivity used are gross output per hectare and net value of output (NVO) per hectare. The latter measure allows us to account for input costs which are important in productivity studies. Second, our study strengthens evidence in the literature which suggests that the IR is not an artifact of measurement error. We do this by using an instrumental variable (IV) for land size to mitigate measurement error in the land size variable. Previous studies like Muyanga and Jayne (Reference Muyanga and Jayne2019), which is closely related to this paper, relied solely on ordinary least squares estimators (OLS) estimates. We used a second measure of land size recorded in 2015 as an instrument for the 2013/2014 land size variable. Farmers were asked to recall what they had reported their farm sizes to be in the 2013/2014 planting season. We admit that our IV does not fully correct measurement error in land size variable. It however provides useful robustness check for our estimation of the IR.
A review of the IR literature shows that the literature still requires bolstering on two fronts: provision of additional evidence showing existence of the IR beyond 5 ha, and more evidence showing that the IR is actually U-shaped. Leading papers in the IR literature which studied IR for farm sizes exceeding 5 ha are Foster and Rosenzweig (Reference Foster and Rosenzweig2022) and Muyanga and Jayne (Reference Muyanga and Jayne2019). The Muyanga and Jayne (Reference Muyanga and Jayne2019) study found that IR holds for farms within the range of 0–3 ha. Beyond 4 ha, the relationship between farm size and farm productivity is positive with farms between 20 and 70 ha being the most productive. Muyanga and Jayne (Reference Muyanga and Jayne2019) observed that family labor use tends to increase output but reduces profits when costed, which makes it important for input use intensity to be captured in measuring productivity. They also observed that higher relative productivity of medium-sized farms is not due to favorable agro-ecological factors or ability to access markets as compared to small-sized farms. They attributed differences in productivity to differences in technology choice and input use intensity.
Foster and Rosenzweig (Reference Foster and Rosenzweig2022) used the India ICRISAT VLS panel survey to explain the U-shaped relationship between farm productivity and farm size. They used a model that captures transaction costs in the labor market and scale economies in machine capacities. Using a tripartite classification scheme (i.e., smallest farms, slightly larger farms, and larger farms), Foster and Rosenzweig (Reference Foster and Rosenzweig2022) showed that the smallest farms and larger farms are most efficient, and slightly larger farms are the least efficient due to labor market transaction costs. The study suggested that “there are too many farms at scales insufficient to exploit locally-available equipment-capacity scale-economies.” (Foster and Rosenzweig, Reference Foster and Rosenzweig2022)
Observance of a U-shaped relationship between farm productivity and farm size is not a very recent discovery. Kimhi (Reference Kimhi2006), using a sample of which 86% of the farms were below 3 ha, found that when endogeneity of plot size is corrected using Heckman selectivity correction procedure, the productivity-farm size relationship becomes U-shaped. Kimhi (Reference Kimhi2006) argues that the IR dominates economies of scale up to 3 ha. Carter and Wiebe (Reference Carter and Wiebe1990) found a positive relationship between net profitsFootnote 1 and farm size, and a U-shaped relationship between output per acre and farm size, and also between family incomeFootnote 2 and farm size. Carter and Wiebe (Reference Carter and Wiebe1990) noted that the intensity of family labor use drives profits down, even into negatives for the smallest farms.
Explaining the U-shaped relationship, Muyanga and Jayne (Reference Muyanga and Jayne2019) argued that labor market imperfection in the form of small farms using family and hired labor more intensely, as against medium-scale farms’ use of fertilizer and mechanization more intensely, is partially responsible for the U-shaped relationship between farm size and productivity. Market imperfection, which has been argued in the older literature to be a driver of the IR, has had recent evidence going against it. For instance, Assunção and Braido (Reference Assunção and Braido2007) used plot-level data on plots simultaneously cropped by the same household and showed that the IR remains unchanged with the introduction of household fixed effects. Thus, the IR could be at the plot level as well and not just at the farm level. Bevis and Barrett (Reference Bevis and Barrett2020) also found the IR to hold only at the plot level (after controlling for both farm size and plot size). Our study does not focus on market imperfections since this has been heavily researched and summarized in the older literature.
Foster and Rosenzweig (Reference Foster and Rosenzweig2022) ruled out the possibility of the U-shaped relationship being driven by measurement error in farm size, omitted land quality, credit constraints, and farmer ability differences by farm size. They attribute the U-shaped relationship to fixed transaction costs in the hiring of labor and other inputs. Due to this fixed transaction cost, and because many workers work for less than a full day, the hourly price of a worker is higher when workers are engaged for part of the day. They noted that intermediate-sized farmers are most likely to employ workers on a part-time basis. Beyond some threshold, economies of scale in the adoption of machine technology that is adapted differentially to farm size take over. Using the sprayer equipment as an example, they argued that higher capacity machines do more work per hour, but the cost of these higher machines does not increase proportionately with capacity. Further, because large machines are not used at their full capacities on small plots, there is less cost-effective use of such machines on small farms and a subsequent increase in productivity as farm size increases. Indeed, recent studies such as Bevis and Barrett (Reference Bevis and Barrett2020) concluded that the IR cannot be entirely explained by unobserved land quality differences. Also, see Barrett and Bellemare (Reference Barrett and Bellemare2010). Our study does not include soil quality measures because we do not have them. Besides, previous studies have shown it is not the driver of the IR.
We made effort to mitigate the effect of measurement error in land size because although some studies found that measurement error in land size does not explain the IR (Carletto, Savastano, and Zezza, Reference Carletto, Savastano and Zezza2013; Foster and Rosenzweig, Reference Foster and Rosenzweig2022), some recent studies to the contrary found measurement error in farmer-reported production to be the driver of the IR (Abay et al., Reference Abay, Gashaw, Barrett and Bernard2019; Desiere and Jolliffe, Reference Desiere and Jolliffe2017). We however do not have data on yield measured through crop cutting and thus cannot carry out analysis similar to those in Abay et al. (Reference Abay, Gashaw, Barrett and Bernard2019) and Desiere and Jolliffe (Reference Desiere and Jolliffe2017).
Results from our study point to a negative relationship between farm productivity and farm size irrespective of the measure of productivity used when models are estimated with OLS. The inverse relationship flattens as farm size grows. Although several of the notable papers in this area of study (e.g., Carter and Wiebe, Reference Carter and Wiebe1990; Foster and Rosenzweig, Reference Foster and Rosenzweig2022; Heltberg, Reference Heltberg1998; Muyanga and Jayne, Reference Muyanga and Jayne2019) observe flattening of farm productivity with farm size, they find that the relationship eventually becomes positive thus creating a U-shaped relationship between productivity and farm size. We find that this negative relationship never becomes positive: the IR is L-shaped for Ghana. We also find that although our IV does not correct for all measurement error, we still see a large increase in the IR magnitude. Presumably, if we had corrected fully for measurement error, the IR would have been even larger.
The rest of the paper is organized as follows: Section 2 describes the data employed in this study while Section 3 presents the estimation strategy. Section 4 reports and discusses the results. Finally, Section 5 presents the main conclusions and policy implications.
2. Data
The study uses primary data from a survey conducted in southern Ghana in August 2014 by the authors. Unlike much of northern Ghana which has recorded massive increases in the number of medium- and large-scale farms in recent years (Jayne et al., Reference Jayne, Chapoto, Sitko, Nkonde, Muyanga and Chamberlin2014), much of southern Ghana is densely populated and faces acute land pressures. Four districts were purposively chosen from four regions in southern Ghana because they contain a relatively large number of medium- and large-scale farms. The selected districts are Offinso-North in the Ashanti region, Bibiani-Anhwiaso in the Western region, Afram Plains South in the Eastern region, and Nkwanta North in the Volta region. Twenty villages were sampled at random from each selected district. A list of farmers operating more than 5 ha in the 2013/2014 season was created in each of these 20 villages by agricultural extension agents. Farmers were then selected at random from these villages.
The sample size used for this study is 437. Operated farm size at the 5th and 95th percentiles of the distribution is 5.7 and 37.7 ha, respectively. The results of this study can therefore be considered reasonably representative of farms operating up to roughly 40 ha but not the entire population of medium- and large-scale farms. Where the household head of the sampled farm was not available at the time of the interview, he/she was replaced randomly with another farmer from the list. About 38 farmers were replaced. Most of the 38 replaced farmers had traveled out of the village at the time the enumerators visited those villages. The survey collected information on all utilized fields. Land area measures are as reported by the farmers to enumerators and GPS or compass and rope methods were not used.
Tables 1 and 2 present some descriptive statistics on farmers in the data used for this study. The mean landholding was 18.24 ha while the mean area cultivated was 12.41 ha. The average age of household heads in the data is about 45.5 years. About 96% of the farmers were males. Forty-seven percent of respondents have no formal education while 13% have tertiary education. Interestingly, about 48% of respondents were attracted to farming because their parents were farmers while 15.33% were attracted to farming because they saw farming as a business. About 74% of respondents used some family labor while about 95% used some hired labor. From Table 2, we see that most farmers plant maize or yam and about 19% of farmers in the sample produce cocoa.
Table 1. Household demographics and input use by hectares of area planted (2013/14)

Source: Authors’ computation from survey data.
Table 2. Descriptive statistics

Notes: Net value of output subtracts costs of hired labor, family labor, exchange labor, fertilizer, chemicals, and mechanization. Family and exchange labor were valued using district median agricultural wage rates.
Source: Authors’ computation from survey data.
A section of the survey asked respondents about the wages they paid for various agricultural activities per acre. We use the district median agricultural wage rate in the data to calculate the NVO. Median village-level crop sales prices obtained from the survey data were used to value crop output. Prices of a few crops that were not captured in the survey were replaced with prices from the regional markets as reported on the website of Ghana’s Ministry of Food and Agriculture.
3. Estimation Equation
The econometric model explains farm productivity using farm size and covariates including education, gender, age of head of household, and village and crop dummy variables. Two measures of productivity are used. These are gross output per hectare planted and the NVO per hectare planted (i.e., differencing the costs of hired labor, family labor, exchange labor, fertilizer, chemicals, and mechanization from the gross output). In another specification, we examine the robustness of our results based on an alternative definition of productivity in terms of the NVO per hectare of potentially utilizable land (area planted plus fallow). This allowed us to explore the possibility that larger farms may utilize a smaller proportion of their total landholdings, which might be considered as a foregone potential that could have been realized by others under alternative land distribution arrangements.
To test the IR hypothesis, we run the regression,
 $$\ln y_{i}=\beta _{0}+\beta _{1}\ln A_{i}+{\boldsymbol{X}}_{i}\Gamma +\varepsilon _{i}$$
where the response variable is either gross output per hectare or NVO per hectare planted by respondent i. A i is the area planted by the respondent and X is a vector of variables, which includes education, gender and age of household head, dummies for villages, and whether major staple crops were planted (rice, maize and yam, groundnut, and soy). ε i is the error term. The NVO subtracts costs of hired labor, family labor, exchange labor, fertilizer, chemicals, and mechanization from the gross output. Family and exchange labor are valued using the district median agricultural wage. The survey instrument asked for information on district agricultural wages. We adopt the parsimonious model, which contains only variables deemed exogenous. We do not use the “production function method,” which includes variables such as fertilizer use and labor days because these variables tend to be endogenous.
Because recent studies have found that respondent-reported farm size can be prone to measurement error, studies examining the relationship between farm productivity and farm size need to consider the extent to which their results are affected by potential measurement error bias. We use a second measure of area planted obtained from farmers as an instrument for the area planted variable. Farmers were asked to recall what they had reported in 2013/2014 planting season as their farm sizes. As we have admitted in Section 1, this is for robustness check since this instrument is unable to fully correct for measurement error in land size variable.
4. Results and Discussions
Table 3 contains our main results for both the OLS and IV estimations. As stated underneath Table 3, NVO is the net value of output. This productivity measure values family, communal, and child labor using the median wage of agricultural activities in the respective districts and accounts for non-labor costs associated with the use of fertilizer, chemicals, and mechanization. The set of OLS results from column 1 of Table 3 points to the existence of an IR. Column 1 uses the area planted as the land size variable, and a negative relationship is observed for both productivity measures. For gross output per hectare, a 1% increase in crop area is associated with a decrease in productivity by 0.25%. The observed negative relationship between planted area and productivity remains statistically significant even after accounting for labor and non-labor costs.
Table 3. Estimates of the inverse farm size-productivity relationship (log log)

Standard errors are in parentheses. *p < 0.10, **p < 0.05, ***p < 0.01. All regressions include a constant term, age, education, gender of household head, main crops dummies (maize, rice, yam, soy and groundnut and cocoa), and village dummies. Productivity and area planted/operated area are measured in logs. Operated area is the sum of area planted and fallow land. NVO subtracts costs of hired labor, family labor, exchange labor, fertilizer, chemicals, and mechanization from gross output. Standard errors are in parenthesis and R-squares are in square brackets. The basic equation run is
 $$\ln {y_i} = {\beta _0} + {\beta _1}\ln {A_i} + {X_i} + {\varepsilon _i}.$$
Sample sizes are not the same across results because the IV variable has missing data. Respondents could not be reached for the repeated measure of farm size. Also, net value of output was negative for some respondents and we could not take logarithm of those values. The instrumental variable is a second measure of area planted reported by farmers. Farmers were asked to recall what they had reported earlier as their land sizes in the 2013/2014 planting season.
$$\ln {y_i} = {\beta _0} + {\beta _1}\ln {A_i} + {X_i} + {\varepsilon _i}.$$
Sample sizes are not the same across results because the IV variable has missing data. Respondents could not be reached for the repeated measure of farm size. Also, net value of output was negative for some respondents and we could not take logarithm of those values. The instrumental variable is a second measure of area planted reported by farmers. Farmers were asked to recall what they had reported earlier as their land sizes in the 2013/2014 planting season.
Instrumenting for area planted using a repeated measure of area planted reported by farmers renders the IR coefficients statistically insignificant in both gross output per hectare and the NVO regressions as shown in column 2 of Table 3. Most studies find a larger (more negative) IR when using a GPS measurement of land size rather than farmer-reported land size. This is because the systematic measurement error in farmer-reported land size (over-estimation of small plots/farms and under-estimation of large plots/farms) leads to an under-estimate of the IR. While we do not have GPS measurements of land size, we believe our IV will correct for some of the measurement error, though not all. In line with the previous literature, this IV correction increases the magnitude of the estimated IR. However, it also decreases significance since our sample is very small, and 2SLS estimates necessarily suffer from larger confidence intervals than OLS estimates. This well-known imprecision in parameter estimates from the IV estimator suggests that, if anything, measurement error in land size is mitigating the IR. That is, the IR is likely larger than what appears in the OLS estimates once we account for the likelihood that the IV estimate of the IR is statistically insignificant simply because of the relatively low sample size coupled with the inefficiency associated with the IV estimator.
Social efficiency objectives look at the productivity of farmers based on available land and not just how much area was planted. We thus use operated land area (area planted plus fallowed land) as the main regressor in columns 3 and 4 of Table 3 to assess the robustness of the results to the measurement of farm size. We find that the results are quite consistent with those that use just the area planted as the main regressor. Figure 1 shows a distribution of the area planted in the sample. This shows a right-skewed distribution as the summary statistics suggests. Figure 2 shows plots of gross output per hectare (left panel) and the NVO per hectare (right panel) against the area planted. The graph shows a negative relationship that flattens as farm size increases for the range of farm sizes considered. It can be seen from Figure 2 that the confidence interval widens to include zero after about 20 ha, lending credence to our observation that the IR relationship flattens after 20 ha.

Figure 1. Histogram showing distribution of area planted in hectares.
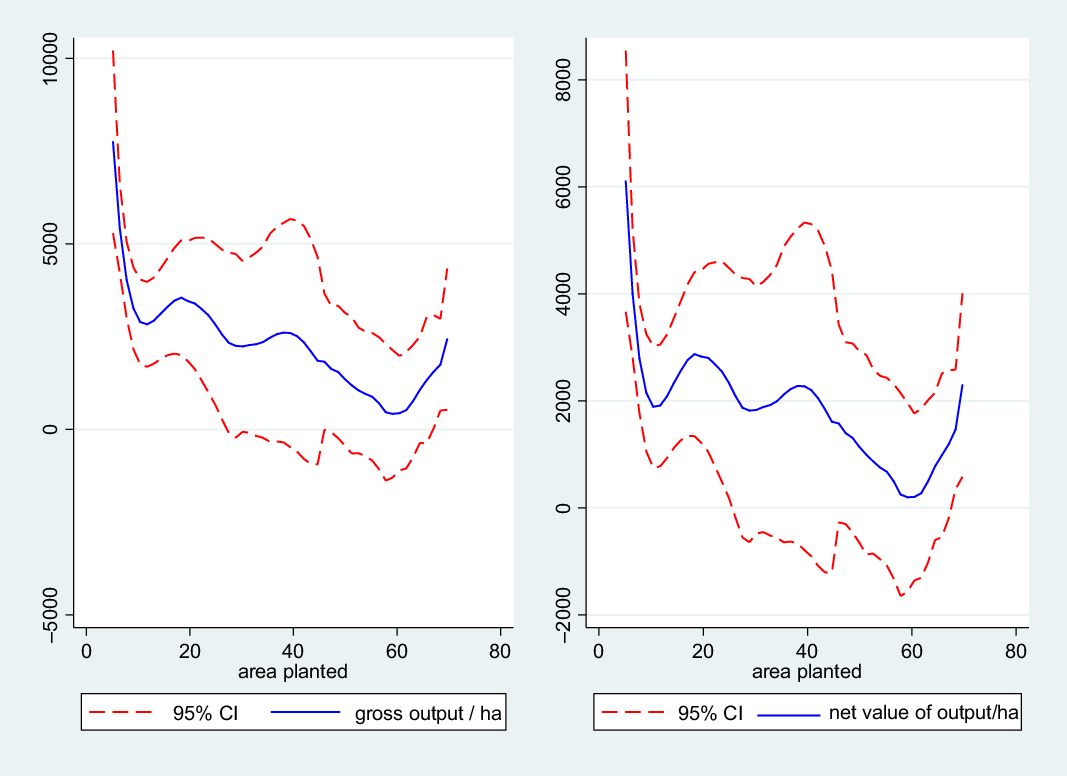
Figure 2. Local polynomial smoothing plot of gross output per hectare planted and net value of output per hectare planted against area planted (all in levels).
Unlike Carter and Wiebe (Reference Carter and Wiebe1990), Foster and Rosenzweig (Reference Foster and Rosenzweig2022), and Muyanga and Jayne (Reference Muyanga and Jayne2019) who all found a U-shaped relationship between farm size and farm productivity, results in our study reveal an L-shaped relationship between land size and farm productivity. The relationship flattens and does not become positive in our data. The L-shaped finding does not contradict the U-shaped findings discussed earlier: farmers in Ghana may simply not be leveraging technology and input discounts sufficiently to reverse the IR quickly enough. This observation is not unique to our data. It has been found to exist in samples without large farms. Muyanga and Jayne (Reference Muyanga and Jayne2019), for example, found the IR to exist between 0 and 3 ha and a flattening between 3 and 5 ha. Our data are not detailed enough to check whether the flattening of the IR or its inability to be reversed is attributable to economies of scale associated with fixed costs in the labor market or use of high-capacity machines as in Foster and Rosenzweig (Reference Foster and Rosenzweig2022).
To deepen understanding of the L-shaped finding here as compared to the U-shaped observed in some other studies, we performed further checks on relative input use across the various samples used in the leading works. We notice that while farmers in our sample use animal draught power, tractor, power tiller, and shellers for farming, the ICRISAT VLS data used in Foster and Rosenzweig (Reference Foster and Rosenzweig2022) show farmers use bullock, tractor, tiller, combined harvester, sprayer, seed drill, and sprayer technologies. The farmers in the Muyanga and Jayne (Reference Muyanga and Jayne2019) study also use tractors and oxen power together with many of the same pieces of equipment that farmers reported they used in our sample. The issue could be about the intensity of fertilizer input and mechanization use by medium-sized farmers as mentioned in Muyanga and Jayne (Reference Muyanga and Jayne2019). Compared to the farmers in the Muyanga and Jayne (Reference Muyanga and Jayne2019) study who heavily used inputs such as fertilizer, labor, oxen, or mechanization power, the use of these inputs is very low in our data. We observe that 195.78 kg/ha of fertilizer was used on average in the Muyanga and Jayne (Reference Muyanga and Jayne2019) sample, while this number is just 49.93 kg/ha in our sample. Almost about the same percentage (above 77%) of farmers in our sample, and Muyanga and Jayne (Reference Muyanga and Jayne2019) used some form of mechanization but the dollar equivalent of amounts expended on average on mechanization is very low in our sample ($152 in our sample and about $543 in the Kenya data). Also, the amount expended on fertilizer use on average is far too low in our sample as compared to Muyanga and Jayne (Reference Muyanga and Jayne2019) (about $77 in our sample and $614 in the Kenya data).Footnote 3
Figure 3 presents the logarithmic form of Figure 2. We can see a linear relationship in log terms, which means there is a nonlinear, flattening relationship in non-log terms as in Figure 2. Table A1 in the appendix shows the equivalent of Table 3 results but in levels. We observe no statistically significant relationship using levels data in the regression. Also, because Figure 2 looks nonlinear, we show results of a quadratic specification in Table A2. We find no statistically significant relationship.

Figure 3. Local polynomial smoothing plot of gross output per hectare planted and net value of output per hectare planted against area planted (all in logs).
5. Conclusions and Policy Implications
This study examines the relationship between farm size and farm productivity on farms cultivating between 5 and 70 ha in southern Ghana. The study is unique in that it covers the rapidly growing segment of “medium-scale” farms in Africa, which now accounts for a significant fraction of the total area cultivated in the region (Jayne et al., Reference Jayne, Chamberlin, Traub, Sitko, Muyanga, Yeboah and Anseeuw2016). The study is useful in providing guidance on policy discussions about the pros and cons of promoting larger farm scales in Africa (e.g., Collier and Dercon, Reference Collier and Dercon2014).
Two key conclusions emerge from this study. First, the results show that there is a strong inverse relationship between farm size and farm productivity using OLS estimation. However, unlike Carter and Wiebe (Reference Carter and Wiebe1990), Foster and Rosenzweig (Reference Foster and Rosenzweig2022), and Muyanga and Jayne (Reference Muyanga and Jayne2019) who all found a U-shaped relationship between farm size and farm productivity, the results here reveal an L-shaped relationship between land size and farm productivity. The relationship flattens and does not become positive in our data. This finding points to the insufficient substitution of capital for labor in the form of increased use of farm mechanization for relatively large farms in Ghana. Farm mechanization can be employed at all stages of farm production beginning with land preparation, planting, and harvesting. There may be a need for some sort of technology adoption audit to identify stages of farm production activity that require augmenting in Ghana.
The second conclusion from the study is that measurement errors in relation to the size of farms may be a significant concern that require attention to improve agricultural economics research and practice in Africa. This is a training issue that must be incorporated into national agricultural development programs to improve the measurement and reliability of farm production data.
Data Availability
The data that support the findings of this study are publicly available via Mendeley, https://data.mendeley.com/datasets/dzp5224jg5/1. Please cite as; Debrah, Godwin (2022), “Medium Scale Farmers in Southern Ghana”, Mendeley Data, V1, doi: 10.17632/dzp5224jg5.1
Author Contributions
Conceptualization, G.D.; methodology, G.D. and K.A.; formal Analysis, G.D. and K.A.; data curation, G.D. writing—original draft, G.D.; writing—review and editing, G.D. and K.A.; supervision, G.D. and K.A.
Financial Support
This research received no specific grant from any funding agency, commercial, or not-for-profit sectors.
Conflict of Interest
None.
Appendix A
Table A1. Estimates of the inverse farm size-productivity relationship (levels)

All regressions include a constant term, age, education, gender of household head, main crops dummies (maize, rice, yam, soy and groundnut and cocoa), and village dummies. Productivity and area planted/operated area are measured in logs. Operated area is the sum of area planted and fallow land. NVO subtracts costs of hired labor, family labor, exchange labor, fertilizer, chemicals, and mechanization from gross output. Standard errors are in parenthesis and R-squares are in square brackets. The basic equation is
 $$\ln {y_i} = {\beta _0} + {\beta _1}\ln {A_i} + {X_i} + {\varepsilon _i}.$$
Sample sizes are not the same for results because the IV variable has missing data. Some respondents could not be reached for the repeated measure of land size. Also, net value of output was negative for some respondents and we could not take logarithm of those values. The instrumental variable is a second measure of area planted reported by farmers. Farmers were asked to recall what they had reported earlier as their farm sizes in the 2013/2014 planting season.
$$\ln {y_i} = {\beta _0} + {\beta _1}\ln {A_i} + {X_i} + {\varepsilon _i}.$$
Sample sizes are not the same for results because the IV variable has missing data. Some respondents could not be reached for the repeated measure of land size. Also, net value of output was negative for some respondents and we could not take logarithm of those values. The instrumental variable is a second measure of area planted reported by farmers. Farmers were asked to recall what they had reported earlier as their farm sizes in the 2013/2014 planting season.
Table A2. Quadratic specification

Standard errors in parentheses. All regressions include a constant term, age, education, gender of household head, main crops dummies (maize, rice, yam, soy and groundnut and cocoa), and village dummies. NVO subtracts costs of hired labor, family labor, exchange labor, fertilizer, chemicals, and mechanization from gross output.


 Open access