


Introduction
Rice (Oryza sativa L.) is the primary staple crop in Taiwan. Its annual cultivated area is 271,506 ha (i.e., 33.9% of the total cultivated surface of the island): 93.6% is dedicated to the production of japonica rice and 6.4% to indica rice (Council of Agriculture 2019). In Taiwan, rice can be grown twice a year. The first crop season is from February to June, when the temperature and daylength increase progressively during the season. The rice-cropping area during the first crop season is about 170,000 ha, with a total brown rice production of about 1 billion kg and an average yield of about 6,300 kg ha−1 (Council of Agriculture 2019). The second season is from August to November, when the temperature and daylength decrease gradually during the season. Some rice growers leave the paddy fallow or grow other crops during the second crop season, which leads to a decrease in rice paddy surface to about 102,000 ha, with a total brown rice production of about 497 million kg and an average yield of about 5,700 kg ha−1 (Council of Agriculture 2019).
Transplanting is the prevalent rice production system in Taiwan. Custom farming is well developed for rice production, with each step well mechanized and highly professionalized, from seedling preparation, to transplanting, to fertilizer and pesticide application, to harvesting, to post-harvest processing.
Since the 1960s, the transplanting system, together with the wide use of PRE herbicides, has controlled the weed population well, leaving only a few species of weeds in the paddy at low density: barnyardgrass [Echinochloa crus-galli (L.) P. Beauv.], chickenspike (Sphenoclea zeylanica Gaertn.), monarch redstem (Ammannia baccifera L.), heartshape false pickerelweed [Monochoria vaginalis (Burm. f.) C. Presl ex Kunth], knotgrass (Paspalum distichum L.), and rock bulrush [Schoenoplectiella juncoides (Roxb.) Lye]; Sheu et al. Reference Sheu, Yang and Hou2005). However, the development of labor-reducing planting methods since the 1980s, such as direct-seeding and ratooning (preserving stubble after harvesting and allowing volunteer rice to grow during a second cultivation period), has increased the weed density in rice paddies (Sheu et al. Reference Sheu, Yang and Hou2005), and an increasing frequency of “red rice” (Oryza sativa f. spontanea) has been observed. Oryza sativa f. spontanea produces broken kernels at milling and has low eating quality, reducing both the quantity and quality of milled rice. In 2015, the increased observation of O. sativa f. spontanea in the public stock drove the Agriculture and Food Agency of the Council of Agriculture as well as three public regional research and extension stations to jointly conduct a survey on O. sativa f. spontanea contamination by sampling warehouses of the public stock across the main rice production regions on the west coast of Taiwan. Oryza sativa f. spontanea was present in 96.8% of the 125 sampled townships, with varying extent of contamination, from 0.02% to 6.36%, median 0.28% (D-H Wu, unpublished data). On further phenotype evaluation, these O. sativa f. spontanea plants exhibited higher seed shattering and earlier maturation, corresponding to the characteristics of weedy red rice (WRR, O. sativa f. spontanea; Cheng et al. Reference Cheng, Wu, Wu, Li, Gealy and Wu2017).
Indeed, WRR is difficult to control and can cause severe yield loss (Ziska et al. Reference Ziska, Gealy, Burgos, Caicedo, Gressel, Lawton-Rauh, Avila, Theisen, Norsworthy, Ferrero, Vidotto, Johnson, Ferreira, Marchesan, Menezes, Cohn, Linscombe, Carmona, Tang and Merotto2015). WRR infestation has been reported around the world. In Cuba, an estimated 80% of rice fields are infested by WRR, and infestation rates could reach 30% to 70% in Europe and the United States (Nadir et al. Reference Nadir, Xiong, Zhu, Zhang, Xu, Li, Dongchen, Henry, Guo, Khan, Suh, Lee and Chen2017). In Asia, the increase of WRR infestation in countries as India, Malaysia, Vietnam, and Sri Lanka was highly associated with an increase in area under direct seeding (Delouche et al. Reference Delouche, Burgos, Gealy, de San-Martin, Labrada, Larinde and Rosell2007). In both Cambodia and the Philippines, farmers needed to be made aware of the need for better WRR control through better cultural practices (Chhun et al. Reference Chhun, Kumar, Martin, Srean and Hadi2020; Tanzo et al. Reference Tanzo, Martin and Chauhan2013). One study showed that WRR seeds remaining in the combine harvester could be dispersed over 6,400 m2 or 3 km into the next field during harvesting (Gao et al. Reference Gao, Zhang, Sun, Yu and Qiang2018).
Fieldwork and previous studies (Cheng et al. Reference Cheng, Wu, Wu, Li, Gealy and Wu2017; Wu et al. Reference Wu, Gealy, Jia, Edwards, Lai and McClung2020) have suggested that the WRR infestation in Taiwan is probably related to growers’ operating practices and perception of WRR. However, no data were available for a detailed investigation. The objectives of the present study were to (1) collect data via a structured questionnaire on rice growers’ backgrounds, farming practices, perceptions of WRR, and expectations for WRR research and extension activities; (2) characterize patterns of farming operations of rice growers in Taiwan; (3) investigate factors contributing to WRR infestation; and (4) provide direction for WRR management, research, and extension activities.
Materials and Methods
Survey Design and Administration
The survey questionnaire was adapted from a questionnaire for rice growers in the United States provided by Nilda Burgos. Particularly, to facilitate the response process, most of the initial open-ended questions were converted to multiple-choice responses. Weed photos were provided to facilitate weed identification. A pretest was based on 88 completed questionnaires collected in one township, and the choices for some questions were clarified.
The questionnaire consisted of four sections: information related to (1) the farmers and their rice production systems, (2) their weed management practices, (3) their perceptions of herbicide-resistant rice, and (4) their desire for WRR research and their need for extension outreach and education. The full questionnaire, both the original in Chinese and its English translation, is in Supplementary Appendix S1. To facilitate further data analysis, we grouped related questions in different sections into new categories (see “Data Preprocessing” section).
The survey was administered from September 16 to December 28, 2019. It could be completed on paper or online; response was voluntary. We aimed to capture a representative sample of the entire rice production area in Taiwan. Paper copies were available to rice growers through extension activities organized by District Agricultural Research and Extension Stations and farmers’ associations. The completed questionnaires were collected at the end of the extension activities. We also publicized the survey through social media.
Data Preprocessing
At the end of the survey, we examined the responses and regrouped the questions into five categories to facilitate further data analysis (Table 1): We turned multiple-choice weed occurrence responses into binary responses for each individual weed (Table 1, B5 to B12). The consistency of the responses was checked manually and edited when necessary. From the 493 initially collected questionnaires, we removed those with incomplete responses and balanced the representation of each location by randomly selecting up to 30 questionnaires per location. Responses from 408 questionnaires were used for final data analysis.
Table 1. Survey questions. a
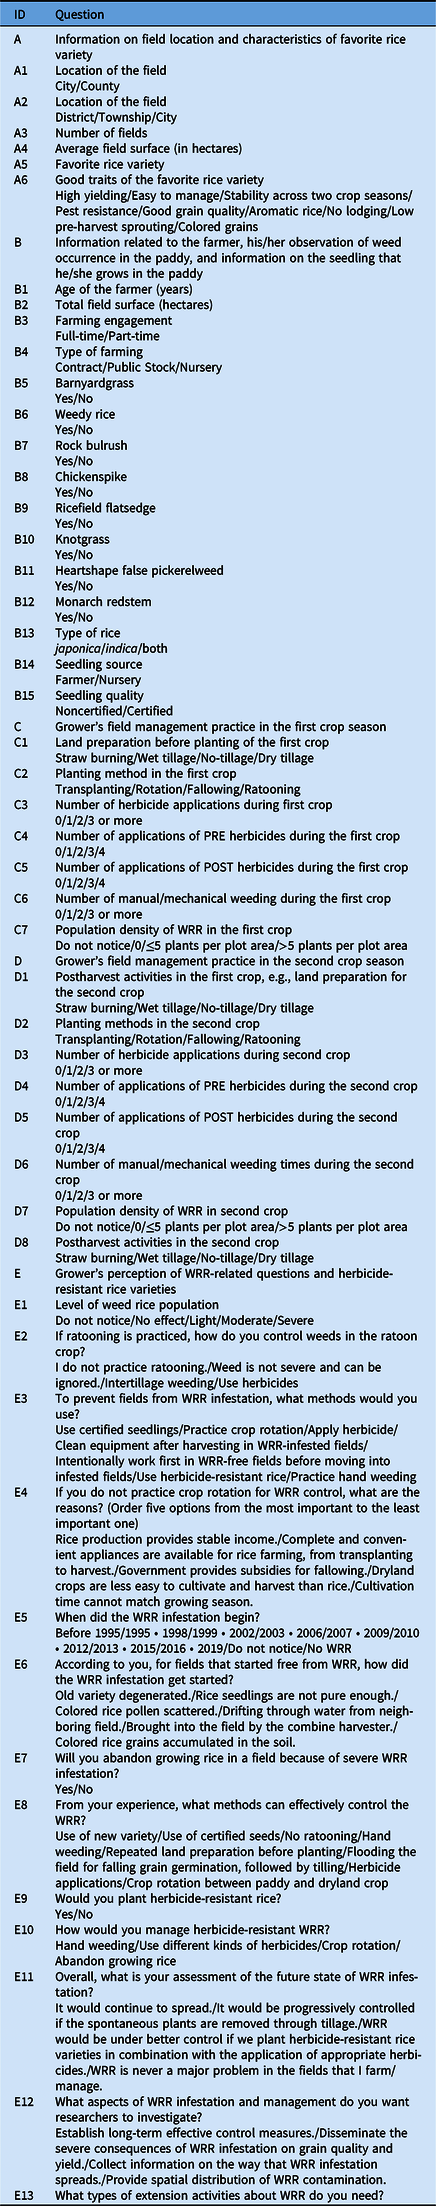
a For each question, answers were assigned numeric values for further analysis.
Data Analysis
Descriptive bar plots and pie charts were created with Microsoft Office Excel; all other analyses were done in R (R Core Team 2019). The correlation between growers’ characteristics and cultural management practices was estimated with Spearman’s rank-sum correlation and graphically represented by using the corrplot function in the R corrplot package (Wei and Simko Reference Wei and Simko2017). Variables were ordered by hierarchical clustering based on Ward’s minimum variance method (Ward Reference Ward1963).
We also estimated and visualized the spatial structure of the cultural management practices within the responses by using the nonnegative matrix factorization (NMF) algorithm implemented in R TESS3r (Caye et al. Reference Caye, Deist, Martins, Michel and François2016). NMF solves clustering problems and estimates the coefficient for each unit to a subpopulation, similar to STRUCTURE (Pritchard et al. Reference Pritchard, Stephens and Donnelly2000), which uses a model-based Bayesian algorithm under the hypothesis that allele frequency of genetic loci within the same subpopulation would follow the Hardy-Weinberg equilibrium. However, NMF is more generalized and does not require the Hardy-Weinberg equilibrium as a working hypothesis, and therefore is suitable for analyzing survey data. Five independent random seed numbers were selected for K = 1 to 10 (tolerance = 1 × 10⁻⁷, iteration = 1,000). The optimal K-value was selected based on the cross-entropy criterion with 5% of the input data masked.
Results and Discussion
Characteristics of Respondents
From the 408 questionnaires used for analysis, the total rice paddy surface covered was about 111,797 ha (i.e., 72.2% of rice production area in the first crop in 2019), corresponding to 106 towns in 17 counties (Figure 1), which indicates the highly representative sampling of the present survey. The median age of the respondents was 51 to 60 yr (Table 2); 9.2% were 15 to 34 yr old, 69.9% were 35 to 64 yr old, and 21.2% were >65 yr old, similar to the age structure of the population employed in agricultural in the country: 10.2% being 15 to 34 yr old, 71.5% being 35 to 64 yr old, and 18.3% being >65 yr old (Council of Agriculture 2019). Age is an important indicator of farming practice in Taiwan, because farmers are used to complementing weed management with manual weeding, which is possible due to small paddy size, despite the highly mechanized rice production system. In addition, younger farmers tend to use social media to enrich their training, whereas older farmers mainly rely on extension activities. Among the 408 questionnaires, 247 (60.5%) were paper copies and 161 (39.4%) were completed online. The average age of respondents was 57.3 and 44.1 yr for paper and online surveys, respectively (Supplementary Figure S2A). Among the respondents, 50.2% were full-time farmers and 49.8% were part-time; full-time and part-time farmers had a similar age structure (Table 2). In Taiwan, custom farming for rice production is well developed for each operation throughout the rice production. Therefore, part-time rice growers can easily delegate the day-to-day farming activities to custom operators while devoting their time to other jobs. Meanwhile, part-time farmers may be less familiar with the details of field management, including weed identification and weed control.
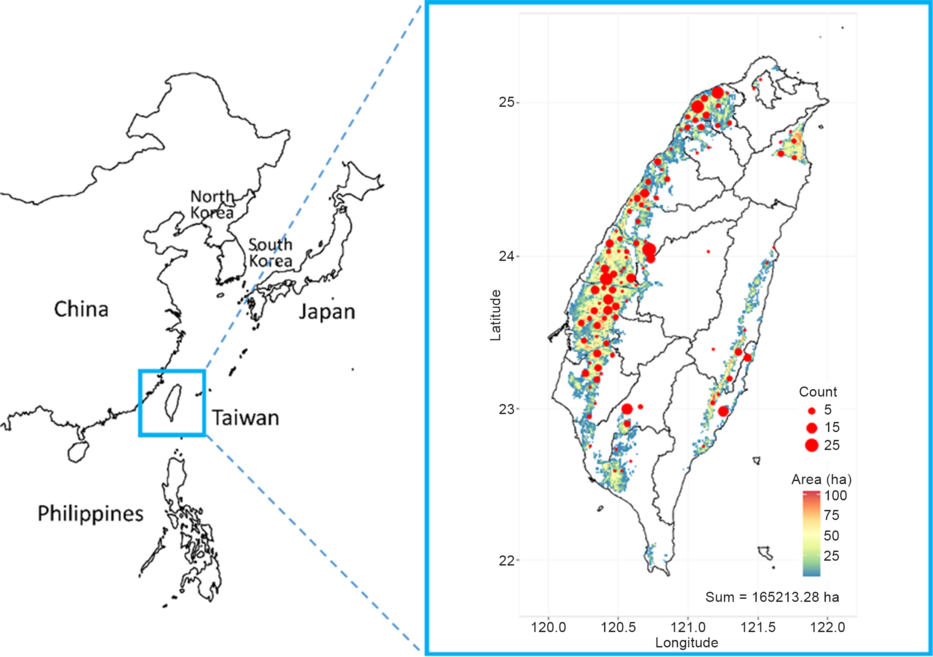
Figure 1. Geographic distribution in Taiwan of the 408 survey respondents. Rice-growing regions and the density of rice paddies are indicated in a heatmap gradient. The total rice paddy surface is 165,213 ha. The number of respondents per town is indicated by red solid circles whose size is proportional to the number of respondents.
Table 2. Farming engagement and the production goal of respondents (n = 408).
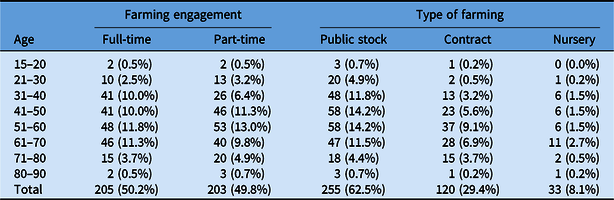
In our survey, 75% of respondents grew rice on paddies of 0.25 to 2.75 ha, with 16.9% of respondents operating on more than 5 ha (Supplementary Figure S2B). This finding reflects the general characteristics of farmers in Taiwan, with 75% of farmers working on 0.5 to 1 ha (Council of Agriculture 2019). Most respondents (62.5%) grew rice for the public stock; 29.4% produced rice under contract; and 8.1% were in charge of a seedling nursery (Table 2).
In all, 96% of respondents acquired their seedlings from a nursery; only 4% prepared seedlings themselves (Supplementary Figure S2C). Among all 408 respondents, 31% used certified seedlings (Supplementary Figure S2D); these were mostly contractual rice growers or those in charge of a seedling nursery (Table 2), which requires clean seed.
The results of our survey reflected japonica being the predominant subspecies grown in Taiwan: 85.5% of respondents specialized in japonica rice, 4.7% in indica rice, and 9.8% grew both japonica and indica rice (Table 3). While japonica was grown across all rice production areas in Taiwan; the major indica-growing region was central Taiwan (Table 3).
Table 3. Type of rice grown by geographic location in Taiwan (n = 408 respondents).
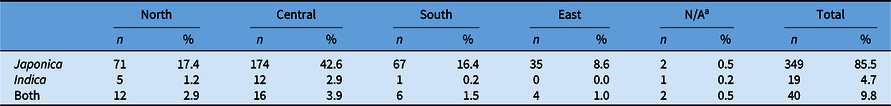
a N/A, location not available.
In terms of ability to identify weeds, respondents generally could distinguish E. crus-galli (87.0%), followed by S. zeylanica (62.7%), WRR (58.1%), ricefield flatsedge (Cyperus iria L.; 52.2%), A. baccifera (43.9%), M. vaginalis (43.4%), P. distichum (42.4%), and S. juncoides (36.5%) (Table 4). This general trend is similar across different regions in Taiwan (Supplementary Figure S3). Sphenoclea zeylanica was more frequently noticed in the south and the east, probably because it is considered a potherb in these regions. The overall general characteristics of respondents corresponded well to the National Agricultural Statistics (Council of Agriculture 2019). Therefore, we can be confident of the representativeness of the survey.
Table 4. Number and proportion of weeds identified in paddies (n = 408 respondents).
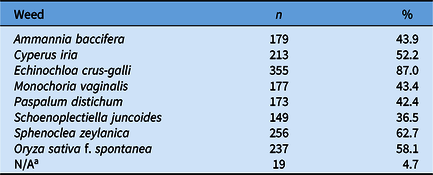
a N/A, not available.
Characteristics of Growers’ Farming Operations
Overall, 398 (97.5%) of the respondents used seedling transplanting for rice production during the first crop season (Table 5). Dry tillage primary method for land preparation (78.9%), whereas 16.4% of respondents used wet tillage, and 4.7% did not till before rice planting. Most respondents (82.1%) applied herbicides for weed control, and 79.1% applied herbicides only once or twice, most frequently using one PRE herbicide (57.4%), while a small proportion (21.7%) of respondents mixed different herbicides before the application. In addition to chemical control, 73.5% of respondents included at least one manual or mechanical weeding. Because the cropping area per grower is small, growers perform manual weeding when weed problems become severe. WRR had not yet caught the attention of rice growers in Taiwan: only 21.8% of respondents provided an approximation of WRR population density in their fields (Table 5), and 72.1% of respondents did not investigate WRR occurrence in their field. Only 25 (6.1%) respondents claimed that there was no WRR in their paddy, but they may not have noticed it.
Table 5. Characteristics of rice growers’ farming operations for the first and second crop seasons (n = 408). a
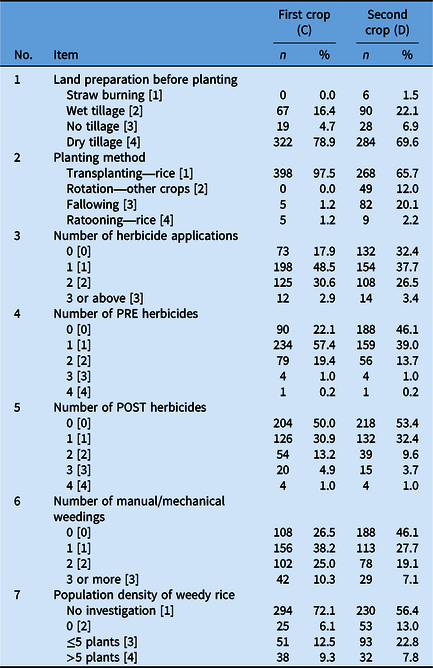
During the second crop season, field management is generally more diverse. In total, 268 (65.7%) respondents grew rice, 12% planted other dryland crops, and 20% let the land lie fallow (Table 5). The proportion of fallow and dryland crop in the second crop season has been increasing during the last 10 yr and is directly related to policies that encouraged rice growers to move to options other than rice for the second crop season by means of subsidies. Land preparation for the second crop season was also dominated by dry tillage (69.6%), followed by wet tillage (22.1%). Straw burning before planting was not frequent, because this practice has been prohibited by the government since 2003 to reduce air pollution. Meanwhile, some growers still practice straw burning between the first and the second crop because it is a quick method to remove the straw and reduce the seedbank while increasing the potassium level in the soil. Because of a larger proportion of fallow land, the proportion of non-herbicide application increased as well: 132 (32.4%) respondents did not apply herbicide in the second crop season, and 82 (20.1%) let the land lie fallow. More growers noticed the presence of WRR in the second crop (30.6% vs. 21.8% in the first crop), but the proportion remained low.
Pairwise correlations between variables related to growers’ backgrounds and farming operation characteristics could be divided into three groups (Figure 2). The first group included the presence of P. distichum in the field (B10), planting method for the second crop (D2), farming engagement of the grower (B3), type of farming (B4), and seedling quality (B15). A closer examination of the data indicated that when rice transplanting was practiced for the second crop, P. distichum was observed less frequently, but when the land was left fallow in the second crop season, P. distichum was observed with higher frequency in the field. Full-time farmers tended to use certified seedlings (83/205 vs. 43/203 part-time farmers), whereas part-time farmers tended to use noncertified seedlings (160/203 vs. 122/205 full-time farmers). Similarly, farmers producing rice under contract tended to use certified seedlings (73/126 using certified seedlings, 57.9%), whereas farmers producing rice for public stock generally used noncertified seedlings (223/282 using noncertified seedlings, 79%).
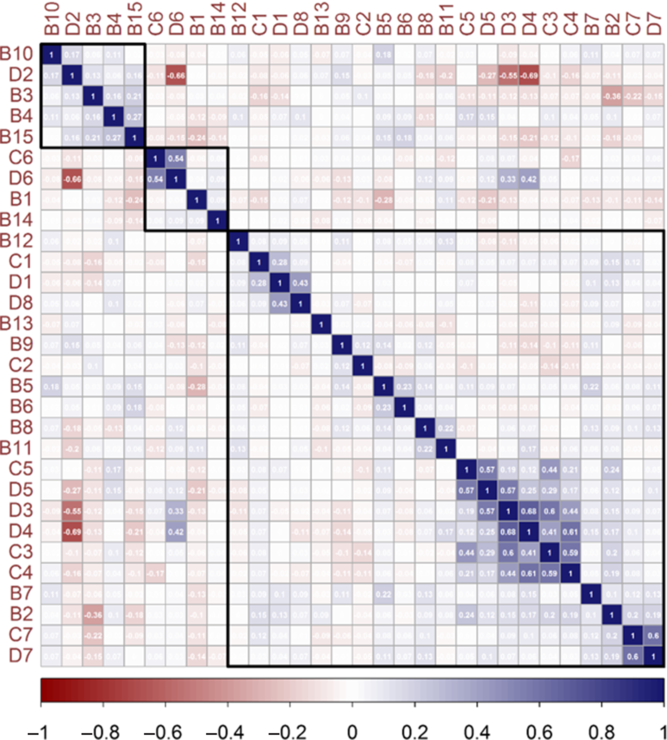
Figure 2. Spearman’s rank-sum correlation between growers’ backgrounds (Table 1, B questions), their farming operations at first crop season (Table 1, C questions), and at second crop season (Table 1, D questions). Variables are grouped together based on positive correlation. The detailed meaning of each variable is given in Table 1.
The joint consideration of groups 2 and 3 (Figure 2) showed a significant positive correlation for the same practice between the two crop seasons in terms of the number of manual/mechanical weedings (C6 and D6), land preparation before planting (C1 and D1), number of herbicide applications (C3 and D3), number of PRE herbicides used (C4 and D4), and number of POST herbicides used (C5 and D5). Thus, growers tended to apply the same cultural practices for the two crop seasons. The number of herbicide applications was positively correlated with the number of PRE and POST herbicides used in both seasons (C3 to C5 and D3 to D5), so when the number of herbicide applications increased, growers tended to use more types of herbicides. In the second crop season, the number of manual/mechanical weedings (D6), herbicide applications (D3), and PRE herbicides (D4) was highly negatively correlated with the planting method (D2), mainly due to the practice of fallow in the second crop season (coded as “3”), for which no physical or chemical weed control was done.
The negative correlation (−0.36) between B3 and B2 indicated that full-time farmers tended to cultivate larger fields (mean 4.8 ha and median 1.7 ha) compared with part-time farmers (mean 2.3 ha and median 0.8 ha). We also observed a negative correlation between age of growers and quality of seedlings (−0.24), the ability to recognize E. crus-galli (−0.28), and number of POST herbicides in the second crop season. Echinochloa crus-galli is well controlled in Taiwan, and one application of PRE herbicide generally suffices for good control. Therefore, not surprisingly, older growers are better able to identify E. crus-galli than younger growers, who have less need to identify E. crus-galli in the paddy. The average age of farmers using certified seedlings was 57.4 yr, and the average age for those using noncertified seedlings was 49 yr. Thus, we investigated why younger farmers tended to use noncertified seedlings. When we cross-checked the data based on farming engagement (B3), type of farming (B4), and seedling quality (B15), among the 122 full-time farmers using noncertified seedlings, 75 grew rice for public stock, and their average age was 44.1 yr. Indeed, rice production for public stock does not require the use of certified seedlings. In addition, the local policy of “Small Landlords, Big Tenants” offers incentives to encourage younger people (18 to 55 yr old) to engage in large-scale farming. Therefore, we hypothesized that the concerns of younger farmers were to ensure income security through the stable market of public stock and government subsidies.
Relationship between Growers’ Farming Operations and WRR Infestation Rates
To better understand the relationship between growers’ farming operations and the extent of WRR infestation, we first used the NMF algorithm to distinguish growers’ farming operation patterns based on seedling source (B14), seedling quality (B15), and management practices in the first and second crop seasons (C and D series). Also, we combined the farming operation patterns and location information to visualize the spatial distribution of different farming patterns. Among the 408 responses, 401 provided precise information of the respondent’s location, covering 104 townships; the WRR contamination rate surveyed in 2015 was available for 73 towns (i.e., 319 respondents).
Generally, a striking decrease in cross-validation scores indicates the most probable number of subgroups within the data. We found no major decrease in cross-validation scores (Supplementary Figure S4), but the score decreased at a larger extent between K = 1 and 2, K = 2 and 3, and K = 3 and 4. Therefore, we investigated growers’ operation patterns at K = 2, 3, and 4 and the key factors contributing to the distinction of different patterns within a given K.
At K = 2 (Figure 3A), 141 respondents were classified as P2-1 and 260 respondents as P2-2, with the main distinguishing factors being the number of manual/mechanical weedings (C6) and the planting method for the second crop (D2). For the operation pattern of P2-1, most growers applied no hand weeding in the first crop season and left the land fallow for the second crop season, without manual or chemical weed control. The geographic distribution of P2-1 corresponded to regions with strong northeast monsoons (northeast and south peninsula) or in the southern part of Taiwan, where rainfall is relatively scarce during winter and subsidies are granted for fallow or producing vegetable and dryland crops. The WRR contamination rate was available for 78 respondents belonging to the P2-1 pattern, which gave an average WRR contamination rate of 0.43% (median 0.34%), slightly higher than the average of 0.39% for P2-2 (median 0.3%, based on data for 241 respondents); both crop seasons were dedicated to rice production and hand weeding and PRE herbicide application was performed at both crop seasons.
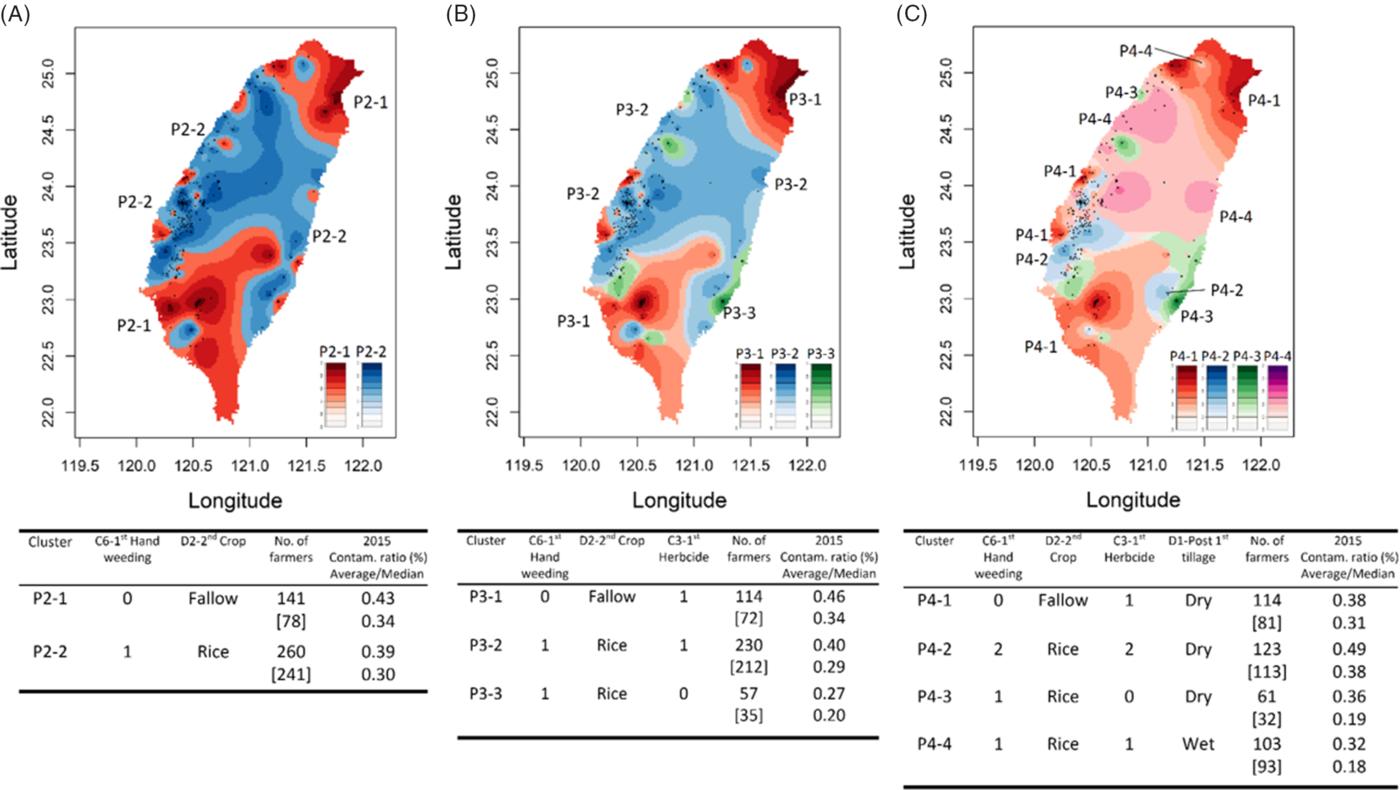
Figure 3. Spatial distribution of farming operation patterns based on K = 2 (A), K = 3 (B), and K = 4 (C). The main variables distinguishing subgroups within each K are listed in the table, together with the number of farmers belonging to a given subgroup, the number of townships for which the 2015 weedy red rice (WRR, O. sativa f. spontanea) data were available (between brackets under “No. of farmers”), and the average (upper number) and the median (lower number) of the 2015 WRR contamination rate.
At K = 3 (Figure 3B), the number of respondents for P3-1, P3-2, and P3-3 was 114, 230, and 57, respectively, and the WRR contamination rate was available for 72, 212, and 35 individuals of each subgroup. In addition to C6 and D2, a major feature distinguishing the three subgroups was the number of herbicide applications during the first crop season (C3). The major characteristics of P3-1 were no hand weeding but one herbicide application for the first crop, with the field left fallow for the second crop season. The main features of P3-2 were two rice productions a year and both hand weeding and chemical control for the first crop. For P3-3, major features were two rice productions a year and no chemical control for the first crop. The average contamination rate was 0.46%, 0.40%, and 0.27% for P3-1, P3-2, and P3-3, respectively; the median was 0.34%, 0.29%, and 0.2%.
At K = 4 (Figure 3C), the number of respondents for P4-1, P4-2, P4-3, and P4-4 was 114, 123, 61, and 103, respectively, and the WRR contamination rate was available for 81, 113, 32, and 93 individuals for each subgroup. The mean contamination rate was 0.38%, 0.49%, 0.30%, and 0.3% for P4-1, P4-2, P4-3, and P4-4, respectively; the median was 0.31%, 0.38%, 0.19%, and 0.18%. The estimation of contamination rate was particularly representative for P4-2 and P4-4, because it was based on 91.9% (113/123) and 90.3% (93/103) of respondents belonging to the respective subgroups. Although the major features in P4-2 were a higher number of manual weedings and herbicide applications, WRR contamination rate was the highest among the four subgroups both in terms of mean and median. For P4-4, although the two crop seasons were mainly dedicated to rice production, as in P4-2, the WRR contamination rate was much lower, and manual and chemical weeding were practiced less by this group. The determinant factor could be the dry/wet tillage before the second crop season. On inspecting the geographic distribution of P4-2 and P4-4, P4-4 was distributed at the central-north part of Taiwan, where the harvesting of the first crop is generally later in the season as compared with the south. In this area, typhoons are more frequent between the two crop seasons, which results in the practice of wet tillage. Wet tillaging would allow for germination of weeds in the soil seedbank, followed by incorporation of seedlings in the soil, which provides effective weed control. The practice of crop rotation, fallow, or dry tillage between two rice crops would increase the soil seedbank. WRR would germinate when environmental conditions were ideal, which would then increase the infestation rate, while the variable burial depth of WRR seeds would cause a variable germination rate, with plants escaping the active period of herbicide application, thus making the latter ineffective.
Regarding P3-3 and P4-3, both patterns indicated relaxed weed control similar to that of environment-friendly farming, but the 2015 WRR contamination rate was low. This is probably related to WRR contamination data being available for only 61.4% and 52.5% of the individuals belonging to each category, making the estimation of contamination rate not representative enough. Indeed, the WRR contamination survey conducted in 2015 focused on the major rice production region on the west coast, with information on the east coast lacking, and merits a further survey.
Growers’ Perceptions of WRR
The highly mechanized transplanting system helps growers identify WRR when a rice plant occurs between the rows. The small paddy size also facilitates the observation of “off-type” plants by its unusual plant height compared with regular seedlings at the early stage. Among the 408 respondents, 157 gave an approximate beginning of WRR infestation based on their own experiences and 126 provided an estimation of the extent (from light to severe) of WRR infestation in their fields. The presence of WRR, or more exactly, “off-type” plants, was noticed by growers before 1995, with growing frequency starting from 2003 to 2005 (Figure 4A). This growing trend fits well with the progressive implementation of several recommendations and policies. Between 1997 and 2012, the Council of Agriculture encouraged the use of ratoon for rice production for the second crop to reduce labor needs. In 2003, the Environmental Protection Administration prohibited straw burning. In addition, the subsidies for leaving a field fallow during the second crop season were increased from 2004. The combination of these policies encouraged labor-saving farming practices, which enabled a buildup of weed seeds in the soil seedbank.
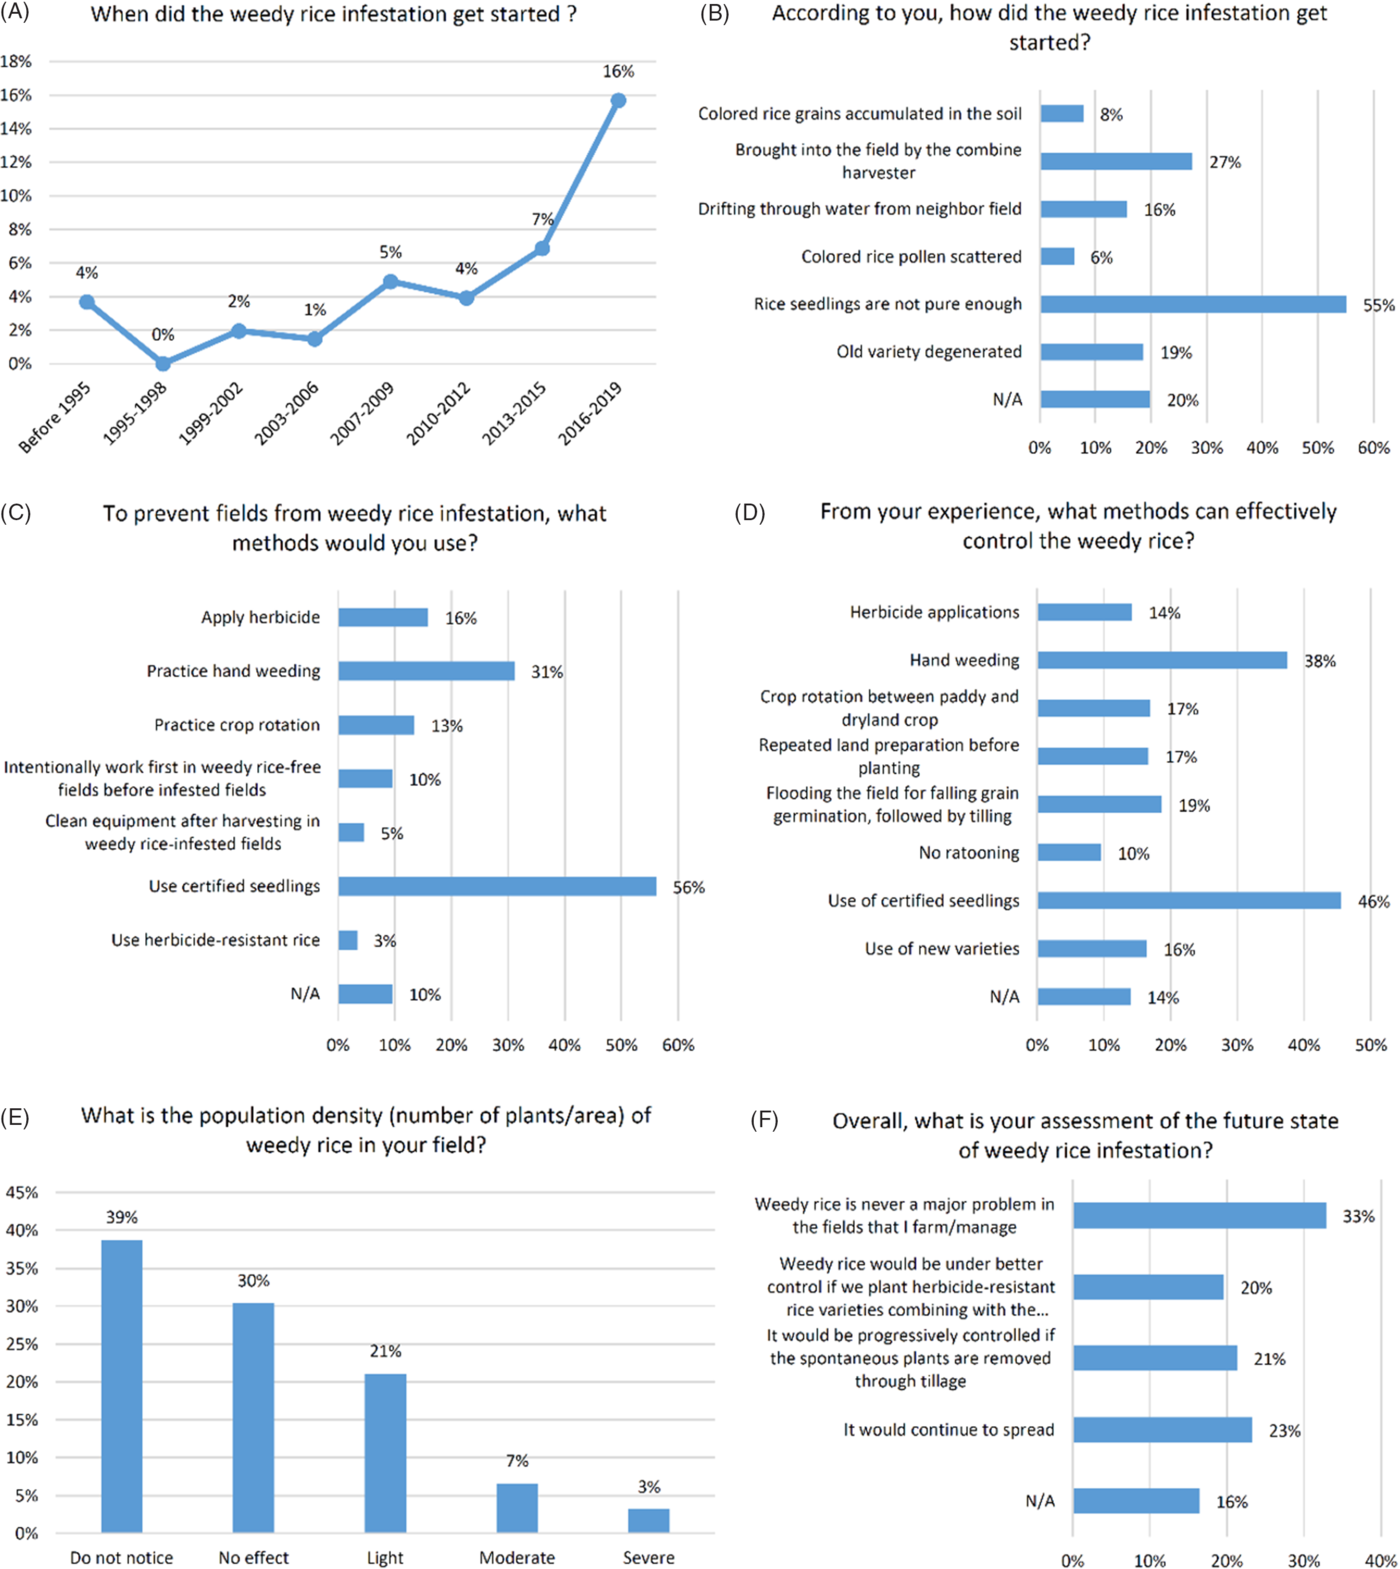
Figure 4. Growers’ perception of weedy red rice (WRR, O. sativa f. spontanea)-related questions. N/A, not available.
Most growers considered that the occurrence of WRR was related to the genetic composition of the seedlings: the rice seedlings were not pure (55.1%) or resulted from the degeneration of old varieties (i.e., de-domestication; 18.6%). The spread by the use of common combine harvesters (27.4%) or from neighboring paddies (15.7%) was also invoked (Figure 4B). Growers’ perception of WRR prevention (Figure 4C) and its control (Figure 4D) were closely related to their perception of the origin of WRR: use of certified seedlings was considered the best method to prevent and control WRR infestations. The second solution was hand weeding. Although this requires more labor, hand weeding is frequently practiced in Taiwan, because the field size for each household is generally small and farmers generally do not tolerate the presence of weeds in their fields. Rotation between rice and dryland crops could provide effective weed control, but rice growers in Taiwan did not rank it as a top priority (Figure 4C and D). The main reasons for not applying crop rotation for weed control were the stable income provided by rice production for public stock and the well-developed rice production industry (Supplementary Figure S5). The incentive related to fallow also drove not practicing crop rotation. In addition, the production of other crops is generally less mechanized than that of rice, and planting is subject to the typhoon season, discouraging growers from investing time and money.
Only 9.8% (n = 40) of respondents noticed a moderate to severe infestation of WRR in their fields (Figure 4E). This does not indicate that weedy rice is not a severe problem in Taiwan but rather reflects the lack of awareness of the risks related to WRR infestation. Indeed, for 32.8% of respondents, WRR was never a problem and 16.4% did not answer the question regarding the future status of WRR (Figure 4F).
In Taiwan, herbicide-resistant rice is not yet on the market. However, we wanted to have a general idea about growers’ perceptions of this option: 44.1% of the respondents would plant herbicide-resistant rice varieties if they were available (Table 6), and 3% of respondents would try herbicide-resistant rice for WRR prevention (Figure 4C). Regarding the management of herbicide-resistant WRR, 58.3% of respondents would practice hand weeding (Table 6), which was consistent with the cultural practices of farmers in Taiwan as revealed by Figure 4C and D; 21.1% would try other herbicides, 23.3% would apply crop rotation, and 3.4% would abandon growing rice. Abandoning rice production is the last option for rice growers, even if the paddy is severely infested by WRR (94 respondents, 23.0%; data not shown).
Table 6. Grower’s perception of herbicide-resistant rice varieties (n = 408). a
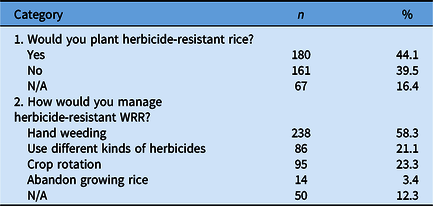
a N/A, not available; WRR, weedy red rice (O. sativa f. spontanea).
Research and Extension Needs of Growers
Most respondents expected researchers to establish long-term effective control measures (56.9%) and to disseminate the severe consequences of WRR for rice production (41.2%), but they were less concerned by how WRR is spread (19.1%) or the geographic distribution of WRR (13.5%; Table 7). For extension activities, rice growers were more interested in the control of WRR (48.5%) and its identification (44.6%) and wished to have a consulting service in regions of severe WRR infestation (23.5%). Leaflets on WRR were also requested (21.8%).
Table 7. Growers’ expectations for WRR-related research and extension activities (n = 408). a
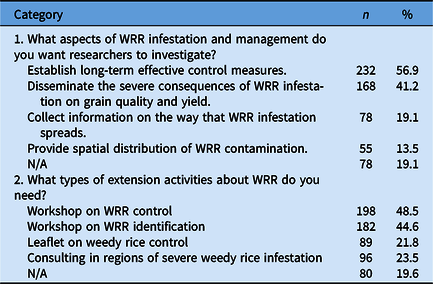
a N/A, not available; WRR, weedy red rice (O. sativa f. spontanea).
Current Status and Prospect of WRR Management in Taiwan
This study provides the first quantitative and qualitative evidence of rice production practices and growers’ perceptions of WRR infestation in Taiwan. Although a survey conducted in the warehouses of public stocks in 2015 showed that WRR was present across all the rice production regions in Taiwan (Supplementary Figure S1), most rice growers are not yet aware of the presence of WRR in their paddies, or the possible negative consequences of WRR infestation. These factors, together with the farming practices related to the growers’ backgrounds, would contribute to increasing the soil seedbank density. However, seedling transfer within rice production regions and well-developed rice custom farming contribute to the spread of WRR across Taiwan (Wu et al. Reference Wu, Gealy, Jia, Edwards, Lai and McClung2020). Seed purity has been suggested as an important component to control WRR, whether in the direct-seeding or transplanting systems (Chauhan et al. Reference Chauhan, Abeysekera, Wickramarathe, Kulatunga and Wickrama2014; He et al. Reference He, Jiang, Ratnasekera, Grassi, Perera and Lu2014), and certain herbicides have been identified as ineffective for WRR in Japan, where transplanting is also used for rice production (Imaizumi Reference Imaizumi2018). Hence, an effective WRR control in a transplanting system such as in Taiwan should include the use of certified seedlings and the removal of volunteer WRR plants in the paddy. The former could reduce the introduction of WRR into the paddy, and the latter could decrease the soil seedbank density. From our experience, hand weeding is not an effective method to reduce WRR infestation, although it was considered a top solution by growers. Multiple tillage and more applications of PRE herbicides could provide effective WRR control (Mansor et al. Reference Mansor, Karim and Abidin2012; Mispan et al. Reference Mispan, Bzoor, Mahmod, MD-Akhir and Zulrushdi2019). One labor-saving and efficient management approach would be the application of wet tillage after harvesting to remove seedlings of shattered seeds. After transplanting, two to three applications of PRE herbicides could control WRR germinated from different soil depths. The residual volunteer plants around the ridges should be removed at flowering to prevent the spread of WRR. The success of weed control is closely related to the grower’s awareness of the weed. Therefore, future training for growers should focus on the economic consequences of WRR infestation and the identification and effective management of WRR.
Acknowledgments
We are grateful to Nilda Burgos, who invited us to join the survey at the 27th Asia-Pacific Weed Science Society Conference and encouraged us throughout the work. We thank Ya-Ling Hou (Taitung DARES), Rong-Kuen Chen (Tainan DARES), Chia-Hsing Huang (Hualien DARES), Chia-Yu Lin (Miaoli DARES), Hung-Yu Dai (TARI), Ho-Ting Su (Agriculture and Food Agency), and other staff members of the Rice Laboratory, TARI for their excellent technical support with survey collection. This research is partially supported by the General Agricultural Science and Technology Programs funded by the Council of Agriculture, Taiwan, ROC (grant nos. 108AS-23.1.2-SS-X1 and 109AS-19.1.2-SS-X1) and by the Ministry of Science and Technology, Taiwan, ROC (grant nos. 108-2628-B-055-001 and 109-2628-B-055-001). No conflicts of interest have been declared.
Supplementary material
To view supplementary material for this article, please visit https://doi.org/10.1017/wsc.2020.73


 Open access