


1. Introduction
The glaciers of Mount Kenya have been the object of extensive research motivated by problems of global climatic and environmental change (Reference HastenrathHastenrath, 1984). As part of this project, the largest ice body on the mountain, Lewis Glacier (Fig. 1), has been monitored in detail since the early 1970s. Numerical modeling has been used to advantage before to predict the future behavior of some mid-latitude glaciers (Reference Untersteiner and NyeUntersteiner and Nye, 1968; Reference BindschadlerBindschadler, 1980) for engineering purposes. In particular, Reference BindschadlerBindschadler (1980) employed an 11 year series of net-balance observations to calculate glacier evolution under continuation of recent climatic conditions. By comparison, in the tropical half of the Earth, modeling has so far been limited to Carstensz and Meren Glaciers in New Guinea (Reference Allison and KrussAllison and Kruss, 1977) and Lewis Glacier on Mount Kenya (Reference KrussKruss, 1984a, Reference Krussb). Only for Lewis Glacier has modeling been applied to prediction, and this effort was aimed at the relationships of climatic forcing and cryospheric response (Reference HastenrathHastenrath, 1989). Similar to earlier work (Reference BindschadlerBindschadler, 1980), the observations during 1974–86 were used to represent the climate, to construct a model of ice flow and mass budget, and to predict changes to the 1990, 1994, 1998 and 2000 epochs, given specific climatic forcings. The purpose of the present paper is to model the 1986–90 evolution from observations over this time span, to appraise the predictions for 1990 in this context and to project the changes of Lewis Glacier to 1994.

Fig. 1. Orientation map of Lewis Glacier. Arrow indicates north direction. Grid coordinates are local as in earlier maps (Reference Hastenrath and CaukwellHastenrath and Caukwell, 1987; Reference Hastenrath and RostomHastenrath and Rostom, 1990). The summit of Mount Kenya, to the northwest of Lewis Glacier (beyond map area) is at 0°09’ S, 37° 18’ E. Glacier boundaries are shown by heavy solid line for 1990 and by broken line for 1986. The dotted lines indicate ice-flow divides to the eastern part of Lewis Glacier and to Gregory Glacier in the north, respectively. Heavy dotted line denotes central longitudinal line with tick marks entered at 50 m intervals. Solid lines define 100 m wide bands.
2. Observations
Measurements during 1986–90 pertinent to the present study are as follows. A network of stakes served to determine the net balance for budget years starting 1 March, and to measure the surface ice-flow velocity over annual periods starting in late December. The 4 year (1986–90) mean vertical net-balance profile is plotted in Figure 2 as curve “b”. The glacier was mapped by aerial photogrammetry at a scale of 1 : 2500 in March 1986 and March 1990 (Reference Hastenrath and CaukwellHastenrath and Caukwell, 1987; Reference Hastenrath and RostomHastenrath and. Rostom, 1990), which allows the assessment of changes in ice thickness and volume over this 4 year time span for various domains of the glacier (Fig. 1). Further relevant are earlier determinations of the subglacial bedrock topography (Reference HastenrathHastenrath, 1989).

Fig. 2. Profiles of (geometric) net balance (m) as function of elevation: (a) 1978–86 broken; (b) 1986–90 solid.
3. Model of Ice Flow and Mass Budget
Reference KrussKruss (1984a, Reference Krussb) pioneered an ice-flow model specific to Lewis Glacier, adapting the model described by Reference Budd and JenssenBudd and Jenssen (1975) and also used by Reference Allison and KrussAllison and Kruss (1977). Reference KrussKruss’s (1984a, Reference Krussb) Lewis Glacier specific model has proven realistic in a series of earlier studies in producing ice thickness and flow velocity consistent with observation (Reference Bhatt, Hastenrath and KrussBhatt and others, 1980; Reference Hastenrath and KrussHastenrath and Kruss, 1981, Reference Hastenrath and Kruss1982; Reference HastenrathHastenrath, 1989), and is further used here. The basic theory and modeling are summarized from Reference HastenrathHastenrath (1989).
Directly pertinent are the relationships, described in Equations (5) and (6), between longitudinal volume flux φ, center-line surface velocity V s, ice thickness Z, surface width W, surface-slope angle α and various parameters, namely the constants n and k in a power flow law, stress-shape factor s, cross-section velocity ratio C v and valley power m; except for k all are dimensionless. These are introduced in the following equations.
In a power flow law, the vertically averaged deformational velocity
where T b is the center-line shear stress and Ζ is the ice thickness.
The stress-shape factor s is introduced by (Reference NyeNye, 1965a)
where T C ≈ T b is the center-line down-slope stress, ρ is the ice density (900 kg m−3) and g is the gravitational acceleration (9.8 ms−2).
The cross-sectional area

The cross-section velocity ratio
where V is the cross-section mean velocity.
The constants in the power flow law are set to n = 2 and k = 0.16 bar−2 a−1 for Lewis Glacier (Reference KrussKruss, 1984). The spacing of grid points is 100 m or larger than the ice thickness. Numerical modeling yielded best correspondence for C v = 0.7 and s = 0.9 in the upper glacier (longitudinal distances 0 m to about 450 m) and s = 0.8 further down-glacier, m → ∞ was used for longitudinal distances 0–450 m (Fig. 1), where the glacier boundaries are near to vertical as they are predominantly flowline or ice divide; and m = 2 further down-glacier. The changeover of m from grid points 400 m to 500 m corresponds to the change of the glacier bed from a wide basin in the upper to a narrow trough configuration in the lower glacier (Fig. 1). The center-line surface velocity, with a dimension m a−1,

or essentially a function of ice thickness Ζ and surface slope α.
The volume flux, in m3a−1, is

or essentially a function of center-line surface velocity V s, ice thickness Ζ and surface width W.
Equations (5) and (6) require information on the glacier morphology. The surface width W was evaluated from the maps of surface topography as lengths of height contours through the indicated points at 100 m spacing along the longitudinal axis (Fig. 1). For the same points, ice thickness Ζ was obtained from mapping the bedrock configuration and the surface topography (section 2). The surface-slope angle α representative of 100 m intervals was likewise read for these points from the maps of ice-surface topography.
From this basic theory, the ice flow and mass budget of Lewis Glacier were modeled, given a vertical net-balance profile (Fig. 2) representing the climatic forcing. The model for calculating ice thickness Z, center-line surface velocity V s and volume flux ϕ, at the equidistant grid points (Fig. 1) is illustrated in Figure 3. The vertical net-balance profile, constructed from monitoring during 1978–86 and used in the previous study, is plotted as curve “a” in Figure 2. The corresponding net-balance profile during 1986–90 is entered as curve “b”. From such profiles, net balance Β is interpolated for the grid points spaced at 100 m intervals along the center line and then for the 100 m wide bands (Fig. 1). As the surface elevation for these discrete longitudinal distances and the 100 m wide bands vary with time, the corresponding net-balance values are recalculated.
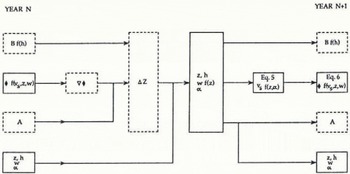
Fig. 3. Flow diagram illustrating the model for predicting ice thickness Z(m) center-line surface velocity Vs (ma−1) and volume flux ϕ (m3a−1), with bold symbols. Other symbols are as follows: Β is geometric net balance (m a−1) ; h is surface elevation (m); W is surface width (m); α is surface slope; A is area of bands (m2); ∇ϕ is net volume outflow from band (m3 a−1); ΔΖ is change in ice thickness over time step (m); f() is function of (); solid- and broken-line boxes enclose values for equidistant center-line grid points and 100 m bands (Fig. 1), respectively.
In addition to the net balance Β corresponding to the initial year (say 1986), surface elevations h and areas A of 100 m bands (Fig. 1), the initial (say 1986) status of volume flux ϕ center-line velocity V s, ice thickness Z, surface width W and slope α at the equidistant center-line points comprise the initial conditions. Regarding the surface width W, note that, in accordance with the ice-flow divide indicated in Figure 1, the eastern part of the glacier draining into Curling Pond is excluded here.
In a first 1 year time step, calculate for each 100 m wide band (Fig. 1) the volume change resulting from the prescribed net balance and lateral inflow and outflow of mass, and divide this volume by the area A of the band to obtain the corresponding change in surface elevation or ice thickness ΔZ. From the elevation changes in adjacent bands, calculate the change in surface slope α at the 100 m spaced grid points. Separately, obtain the surface width W at 100 m intervals from a table constructed on the basis of the measured glacier morphology and relating W to Z. Insert the new Ζ and α into Equation (5) to obtain a new V. Insert the new V s, Ζ and W into Equation (6) to obtain a new volume flux ϕ. Also calculate new areas A for the 100 m wide bands, multiplying the previous A by the ratio of arithmetic means of the new over the previous W at the upper and lower boundaries of the band.
For the next 1 year time step, interpolate new net-balance values corresponding to the new surface elevations of the 100 m bands. The new Z, W, α and ϕ values ascribed to the center-line grid points, as well as the new A, complete the input for the next iteration.
Time lags are pertinent to climate and glacier change. This issue has been studied by Reference NyeNye (1965b), Reference Untersteiner and NyeUntersteiner and Nye (1968), Reference Jóhannesson, Raymond and WaddingtonJóhannesson and others (1989), and by Reference KrussKruss (1984b) specifically for Lewis Glacier. In the present study, flow velocity in Equation (5) is calculated from ice thickness and surface slope. However, the slowing of the ice flow may lag behind the ice thinning. This reservation is further considered in section 4.
4. Observed and Modeled Changes
Table 1 summarizes the ice thickness, width, velocity and volume flux observed in 1986 and 1990. The results of various model experiments are compared here to the observed changes during 1986–90. Pertinent in this context is the fact that net balance was overall less negative in 1986–90 than during 1978–86 (curves “b” and “a” in Figure 2). Seven model experiments were performed and are in the following referred to as M1–M7 (refer to caption to Table 2).
Table 1. Observed ice thickness Z (m), width W (m), center-line surface velocity V (ma−1) and volume flux ϕ (102m3a−1) at indicated longitudinal distances DIST, m (Fig. 1) during 1986 and 1990

Table 2. Mass-budget characteristics during (A) 1986–90 and (B) 1990–94, as observed OBS, and as obtained by six model experiments
-
M1, 1978–86 net-balance profile (curve “a” in Figure 2) and 1986 observed velocity as initial condition;
-
M2, 1986–90 net-balance profile (curve “b” in Figure 2) and 1986 observed velocity as initial condition;
-
M3, 1986–90 net-balance profile (curve “b” in Figure 2) and 1986 observed velocity throughout;
-
M4, 1986–90 net-balance profile (curve “b” in Figure 2) and zero velocity throughout;
-
M5, 1986–90 net-balance profile (curve “b” in Figure 2) and 1990 velocity as initial condition;
-
M6, 1986–90 net-balance profile (curve “b” in Figure 2) and 1990 observed velocity throughout;
-
M7, 1986–90 net-balance profile (curve “b” in Figure 2) and zero velocity throughout.

Experiments M1“M4 pertain to the 1986–90 time span. Experiment M1 formed the basis for a prediction to 1990 and has been described by Reference HastenrathHastenrath (1989). In this experiment, the observed 1978–86 vertical net-balance profile (curve “a” in Figure 2) was used as climatic forcing, and the observed 1986 ice-flow velocities were input at the start, as also in experiment M2. This used as climatic forcing the observed 1986–90 average net-balance profile (curve “b” in Figure 2). Experiments M3 and M4 also had as input the observed 1986“90 balance profile (curve “a” in Figure 2); in M3 the 1986 observed velocity was kept constant throughout the 4 year simulation, while in M4 velocity was set to zero throughout.
Experiments M5–M7 concern 1990–94 and represent corollaries to experiments M2–M4 for 1986–90. Thus, M5 used the observed 1990 velocities as initial input, in M6 velocities were kept constant throughout at the observed 1990 values, and in M7 velocities were kept at zero throughout; all three of these experiments used as climatic forcing the observed 1986–90 average net-balance profile (curve “b” in Figure 2).
The observed topography, mass budget and flow conditions (Tables 1–3) represent no absolute standard and are themselves fraught with uncertainties. From the glaciological (net-balance stakes) and the geodetic (repeated mapping of ice-surface topography) methods, the uncertainty in the volume change of the entire glacier during 1986–90 is estimated at order 5 (range 69–73 × 104 m3. For the glacier as a whole, this translates into a thickness equivalent of 0.2 m. For an individual 100 m band or a particular grid point, the uncertainty in thickness change would be of order 0.5 m. For the vicinity of 400–500 m, small changes were in fact obtained from the 1986 to 1990 mapping; the effect may in part be real in this location just below a steep surface slope, and in part be a shortcoming due to the fresh snow cover in the 1990 mapping (Reference Hastenrath and RostomHastenrath and Rostom, 1990). The 1986–90 changes in flow velocity are determined to within 0.1 ma−1.
Results from experiments M1–M4 are in Tables 2 and 3 compared with the observed (OBS) changes to the year 1990. Comparison of M1 to OBS amounts to the testing of a forecast made under the premise of the 1978–86 climatic forcing. The decay of Lewis Glacier during 1986–90, in terms of the reduction of ice thickness, velocity and mass flux (Table 3), as well as area and volume (Table 2), was overall more moderate than expected from M1. The ways in which net balance and ice flow may have contributed to the decay of Lewis Glacier during 1986–90, and the differences from the M1 predictions, are explored in experiments M2–M4.
Table 3. Changes, 1986–90, of ice thickness ΔΖ (m) and of center-line surface velocity ΔV (ma−1) at indicated longitudinal distance DIST (m) (Fig. 1), as observed OBS and as computed from model experiments M1, M2, M3 and M4 (refer to caption to Table 2)

Experiment M2 produced 1986–90 decreases in thickness (Table 3), net balance (Table 2) and velocity (Table 3) smaller than for M1, consistent with the 1986–90 net-balance profile, being overall less negative than that of 1978–86 (Fig. 2). Thus, the thickness and mass-balance changes from M2 are closer to OBS than the results from M1 (Tables 2 and 3). As indicated in section 3, in a situation of progressive thinning and slow down of the ice flow, the flow velocity may be larger than calculated from Equation (5). Therefore, in experiment M3 using the same 1986–90 net-balance profile as M2 and M4, velocity was kept constant at the 1986 observed values. Results differ little from M2: mass flux is somewhat larger (Table 2) and volume decrease is larger in the upper and smaller in the lower glacier (Table 2). These differences of model results are in a sense consistent with the slightly faster flow in experiment M3 as compared to M2, which arises because the ice flux in M3 is not allowed to respond to the thinning glacier geometry. The opposite extreme of a completely stagnant Lewis Glacier is illustrated by experiment M4. Redistribution of mass by the ice flow is eliminated altogether. Compared to experiments M2 and M3, volume loss and thickness decrease is markedly mitigated in the upper but accentuated in the lower glacier (Tables 2 and 3).
In a synthesis from these simulations of the 1986–90 evolution, the net-balance forcing for the same period — rather than from the preceding 1978–86 interval — leads to a realistic reproduction of the actual mass budget and thickness changes, if input is in conjunction with approximate but realistic flow velocities; the behavior of a completely stagnant Lewis Glacier is substantially different.
In accordance with these experiences from the simulations for 1986–90, model experiments M5–M7 were conducted, and aimed at the future evolution during 1990–94. The 1986–90 vertical net-balance profile was used in all three, together with the observed 1990 velocities kept constant throughout for M6 and zero velocity throughout for M7. Results are summarized in Tables 2 and 4. All three simulations project a smaller volume loss for the glacier as a whole for 1990–94 than during 1986–90 (Table 2), essentially due to the decreased areas of the lower glacier during the later period. The overall somewhat faster flow in the average over 1986–90 in experiment M6 as compared to M5 is reflected in a larger volume flux at 600 m (Table 2), as well as different evolutions of the longitudinal profiles of ice thickness and volume flux (Table 4). Thus, the more effective redistribution of mass related to the faster ice flow in M6 as compared to M5 accentuates the thickness decrease in the upper and mitigates it in the lower glacier. Likewise, the smaller 1990–94 decrease of the volume flux in M6 as compared to M5 is primarily a consequence of the velocity kept invariant in M6. Both experiments M5 and M6 indicate an ice thinning of less than 1 m in the upper reaches of the glacier and a transition to thickness deficits of more than 7 m in the lower parts of the glacier. For a stagnant Lewis Glacier, experiment M7, the redistribution of mass by ice flow, is eliminated altogether. Consequently, the volume loss is mitigated in the upper, and accentuated in the lower glacier, as compared to experiments M5 and M6 (Table 2). This effect is further reflected in the changes of the longitudinal thickness profile (Table 4): indeed M7, as compared to M5 and M6, features over 1990–94 a more moderate thickness decrease in the upper glacier but a more pronounced ice thinning in the lower glacier.

5. Summary and Conclusions
As a follow-up to the earlier modeling study (Reference HastenrathHastenrath, 1989), this paper has examined quantitatively the evolution of an Equatorial glacier in response to recent climatic forcing. The observed glacier decay during 1986–90 proved to be less drastic than predicted from the prescribed climatic forcing in terms of the 1978–86 vertical net-balance profile. A series of model experiments was performed to explore ways in which net balance and ice flow contributed to the evolution of Lewis Glacier during 1986–90. The overall less negative net balance during 1986–90 is a major factor for the differences from the model predictions based on the 1978–86 net-balance forcing. For both the 1986–90 (experiments M1–M4) and the 1990–94 (experiments M5–M7) evolutions, the role of model simulations should be appreciated; with a given vertical net-balance profile, the progressive change of the ice surface in the various parts of the glacier still needs to be known, and this is obtained in the model through a budgeting of mass. Such a modeling of the mass budget is in order even for a stagnant glacier, because the elevation of the glacier surface exposed to the climatic forcing changes in the course of the years. Although the ice flow in Lewis Glacier has become slow, it is still instrumental in the redistribution of mass. However, an approximate estimate of ice-flow velocity, such as provided by observations at the beginning of the period, is sufficient for modeling purposes. Indeed, the observed 1986–90 net-balance profile together with the 1990 velocity measurements led to a realistic simulation of mass budget and thickness changes in the course of 1986–90. By contrast, a completely stagnant Lewis Glacier would be characterized by mitigated volume loss in the upper reaches and accentuated ice thinning in the lower parts of the glacier. On the grounds of the 1986–90 net-balance forcing and the observed 1990 ice-flow velocity, a substantial further decay of Lewis Glacier is projected to the 1994 epoch.
Acknowledgements
This study was supported by U.S. National Science Foundation grant EAR-9016657. I should like to thank two anonymous reviewers for helpful comments on an earlier version of this paper. The research was authorized by the Office of the President, Republic of Kenya.
The accuracy of references in the text and in this list is the responsibility of the author, to whom queries should be addressed.


