


Introduction
Turbidites are common components of Paleoproterozoic greenstone belts; they represent submarine mass flows along volcanic arcs and active and passive continental margins. We present field, petrographic and geochemical data demonstrating that different provenance areas can be distinguished in metaturbidites in the Paleoproterozoic greenstone belt of the Guiana Shield in Suriname, both laterally along the active margin and vertically in the stacked turbidite deposits. This may contribute to a better understanding of the paleogeography and sequence of events during the Amazonia–West Africa collision 2.2–2.1 Ga.
Geological setting
The Paleoproterozoic greenstone belt of the Guiana Shield stretches over more than 1500 km along the northern coast of South America, from northern Venezuela, through the Guianas to the Amapá State in northern Brazil (Fig. 1; Gibbs & Barron, Reference Gibbs and Barron1993; Delor et al., Reference Delor, Lahondère, Egal, Lafon, Cocherie, Guerrot and De Avelar2003a; Kroonenberg & De Roever, Reference Kroonenberg, De Roever, Hoorn and Wesselingh2010; Daoust et al., Reference Daoust, Voicu, Brisson and Gauthier2011; Kroonenberg et al., Reference Kroonenberg, De Roever, Fraga, Reis, Faraco, Cordani, Lafon and Wong2016). Like many other Archean and Paleoproterozoic greenstone belts, the Suriname part of the Guiana Shield greenstone belt, also called Marowijne Greenstone Belt (Kroonenberg et al., Reference Kroonenberg, De Roever, Fraga, Reis, Faraco, Cordani, Lafon and Wong2016), consists of a lower, metavolcanic series (Paramaka Formation), a middle metagreywacke series (metaturbidites, Armina Formation), and an upper series of epicontinental meta-arenites and metaconglomerates (Rosebel Formation) (Fig. 2). The tholeiitic character of the lowermost mafic volcanics suggests an ocean floor or back-arc basin origin, and the calc-alkaline character of the remainder of the volcanics is in harmony with a volcanic arc origin (Vanderhaeghe et al., Reference Vanderhaeghe, Ledru, Thiéblemont, Egal, Cocherie, Tegyey and Milési1998; Delor et al., Reference Delor, Lahondère, Egal, Lafon, Cocherie, Guerrot and De Avelar2003a,b). The greenstone belt has been metamorphosed under greenschist and locally amphibolite-facies conditions, and has been intruded by diapiric tonalite–trondhjemite–granodiorite (TTG) bodies resulting from subduction of ocean crust (Delor et al., Reference Delor, Lahondère, Egal, Lafon, Cocherie, Guerrot and De Avelar2003a) and by younger biotite and muscovite granite plutons (Bosma et al., Reference Bosma, Kroonenberg, Maas and de Roever1983). The main orogenic event that formed and deformed the greenstone belt is the Trans-Amazonian Orogenic Cycle as defined by Hurley et al. (Reference Hurley, De Almeida, Melcher, Cordani, Rand, Kawashita, Vandoros, Pinson and Fairbairn1967), now considered to be due to subduction and subsequent collision of the Amazonian Craton with the West-African craton between 2.2 and 1.9 Ga (Delor et al., Reference Delor, Lahondère, Egal, Lafon, Cocherie, Guerrot and De Avelar2003a,b). Late deformation events gave rise to the development of extensive gold mineralisation in several generations of quartz veins (Daoust et al., Reference Daoust, Voicu, Brisson and Gauthier2011).

Fig. 1. Simplified geology of the northern Guiana Shield with the Greenstone belt, Armina Formation and Rosebel Formation. Modified after Daoust et al. (Reference Daoust, Voicu, Brisson and Gauthier2011) (see there for other legend units).
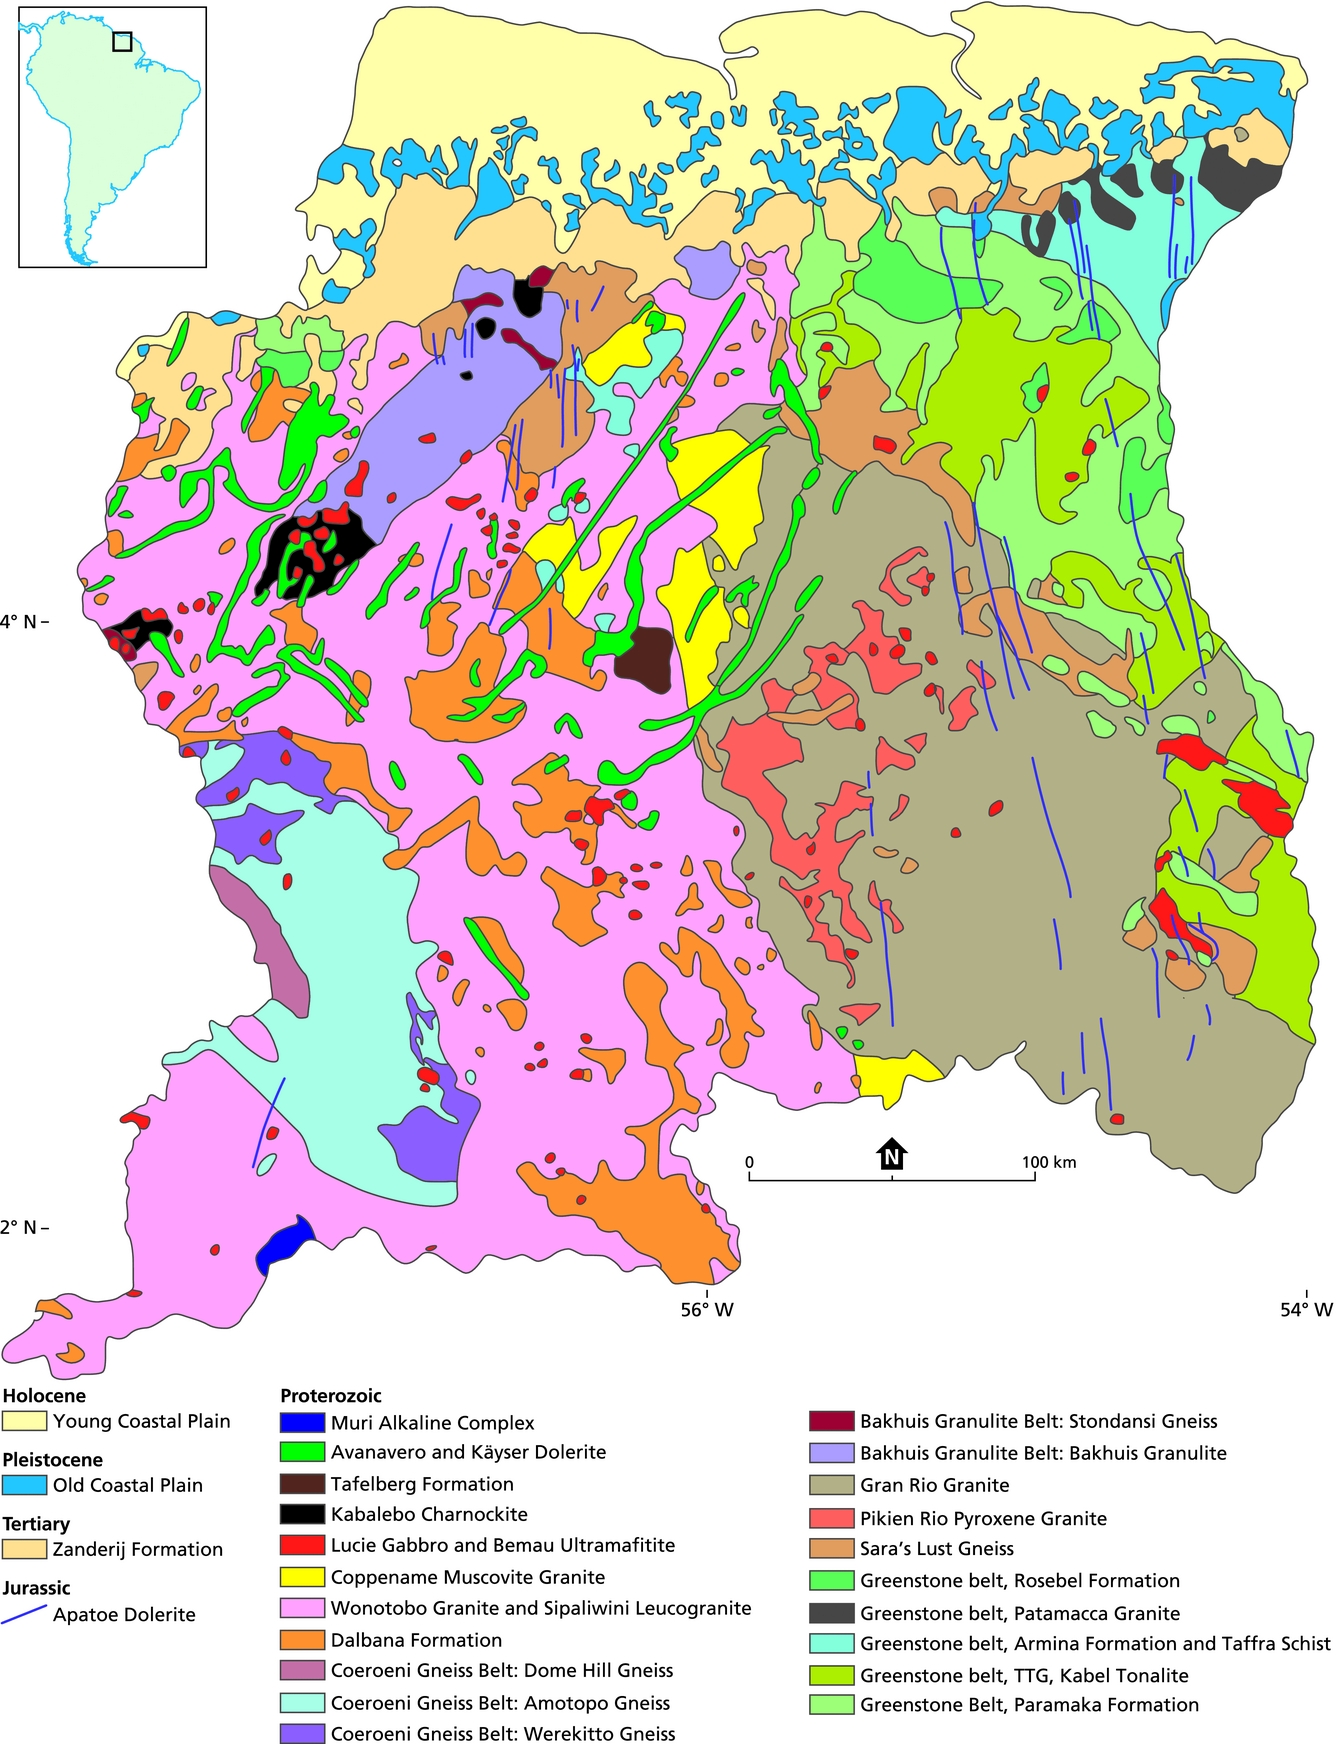
Fig. 2. Geological map of Suriname (Kroonenberg et al., Reference Kroonenberg, De Roever, Fraga, Reis, Faraco, Cordani, Lafon and Wong2016).
Study area
The Armina Formation is exposed mostly in northeastern Suriname and consists of low-grade metamorphic turbidite sequences with centimetre-scale alternations of metagreywacke, phyllite and/or schists and some quartzites. It was deformed and metamorphosed during the Paleoproterozoic Trans-Amazonian Orogenic Event, and intruded by bi-mica and biotite granite bodies (De Vletter, Reference De Vletter1984). It continues into French Guiana, where it is known as Bonidoro Group (Marot & Capdevila, Reference Marot and Capdevila1980; Delor et al., Reference Delor, Lahondère, Egal, Lafon, Cocherie, Guerrot and De Avelar2003a; Daoust et al., Reference Daoust, Voicu, Brisson and Gauthier2011). Most data from this area were collected during expeditions in the early 20th century (IJzerman, Reference IJzerman1931) and during the 1950s by the Geological and Mining Service of Suriname (GMD), published as the 1:100,000 sheets Java (De Munck, Reference De Munck1954a), Bigiston (De Munck, Reference De Munck1954b) and Nassau (De Munck, Reference De Munck1954c), and during later fieldwork by GMD in the 1970s. The turbiditic character of the Armina Formation was recognised by Bosma & Groeneweg (Reference Bosma, Groeneweg and Lee1970), who called it ‘flysch-type sedimentation’, and was later confirmed by Bosma et al. (Reference Bosma, Kroonenberg, Maas and de Roever1983) and De Vletter (Reference De Vletter1984). Metamorphism is restricted to greenschist facies conditions (chlorite or biotite subfacies). Due to the dense rainforest vegetation and deep chemical weathering, contacts with the underlying and overlying formations are nowhere exposed, but the cumulative thickness is at least 1000 m (Daoust et al., Reference Daoust, Voicu, Brisson and Gauthier2011). The Armina Formation is supposed to be overlain by the Rosebel Formation with an unconformity, but the distinction between the two formations is sometimes difficult, a point that will also be addressed in this paper. The Armina Formation is strongly folded with a generally NW–SE strike. No direct geochronological data are available, but in adjacent French Guiana the underlying tholeiitic lavas of the Paramaka Formation have been dated between 2.156 and 2.137 Ga, the associated TTG plutons 2.18–2.13 Ga, while detrital zircons from the overlying Rosebel Formation show ages around 2.115 Ga (Delor et al., Reference Delor, Lahondère, Egal, Lafon, Cocherie, Guerrot and De Avelar2003a; Daoust et al., Reference Daoust, Voicu, Brisson and Gauthier2011).
Data acquisition and methodology
Data were collected from two different areas. Fieldwork was carried out along the Marowijne River in eastern Suriname that forms the border between French Guiana and Suriname. Several outcrops over a distance of 100 km from Loka-Loka (south) to Bigiston (north) were described and sampled. The most extensive outcrops are at the Bonnidoro Falls, Paroe Tabiki and Armina Falls (Fig. 3).

Fig. 3. A general geological map of the sampling route, Marowijne River and the four different metagreywacke facies of the Armina Formation modified from Bosma et al. (Reference Bosma, Kroonenberg, Van Lissa, Maas and De Roever1977).
Turbidite sequences were logged and their sedimentary structures such as graded bedding, convolute lamination and climbing ripples were described. The coarsest rocks are coarse sandy greywackes, the finest beds consist of phyllites. Bedding planes have a general orientation of 75–170°, schistosity is sometimes parallel, sometimes at an angle to the bedding planes (140–170°), dipping subvertically to vertically, 75–90°. The second study area is the Rosebel Gold Mine (RGM) south of Paramaribo, some 100 km west of the Marowijne River outcrops. Drill cores from the JZone pit in the mine were logged and sampled at the core shack of the RGM.
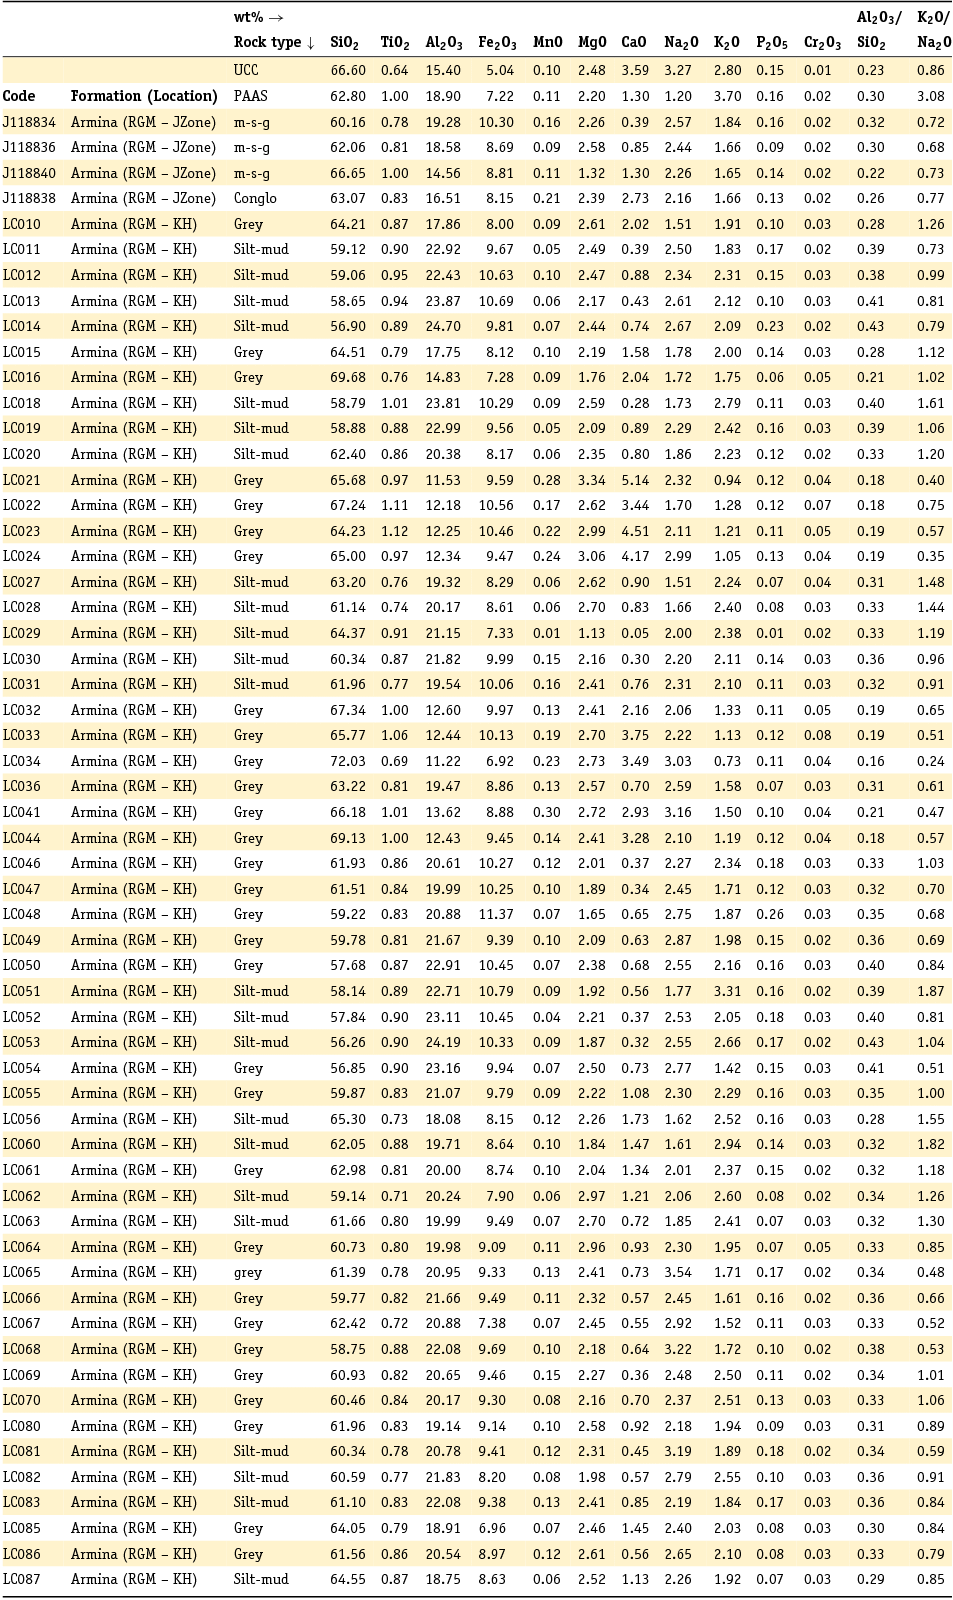
All samples were cut in two with a diamond blade. Half of the samples were pulverised in a ball mill and homogenised in a cone splitter by FILAB in Paramaribo. The prepared samples were analysed with X-ray fluorescence (XRF) for major elements in the ALS Environmental Laboratory in Lima, Peru. No trace elements were analysed. Thin sections were prepared from the other half of the samples at Utrecht University, the Netherlands. Six representative metagraywacke thin sections out of 19 were selected for point counting, as well as eight thin sections from earlier GMD surveys in the same area, giving 14 point-counted thin sections. Two hundred points were counted in each thin section in a grid of 1.5 × 2 mm. Only sand grains between 0.63 mm and 3 mm were counted, using the Gazzi–Dickinson point-counting technique (Dickinson, Reference Dickinson1970). All grains were counted as individual mineral grains regardless of whether they occur as free clasts or in rock fragments. Sand-sized grains resulting from metamorphism (e.g. garnet, biotite) were not counted.
Field data
Field, petrographic and geochemical data allowed the recognition of four different turbidite facies, three in the Marowijne area and one in the RGM.
Facies 1: Bonnidoro Turbidites. A sequence of about 18 m of turbidites (Fig. 4a) was described from the Bonnidoro Falls. Each turbidite unit consists of three repeating beds (Fig. 4b):
-
(a) Massive, dark-light grey, well-indurated, poorly sorted greywacke containing abundant medium- to coarse-grained, angular to sub-rounded quartz, feldspar and some rock fragments. This unit shows slight grading. The average thickness of an individual massive greywacke bed is approximately 1.6 m.
-
(b) Thin, less-competent phyllite beds approximately 0.1 m thick with visible sedimentary structures like convolutions, cross-bedding and climbing ripples. The climb and stoss side angles are both 30° (Fig. 5), which means these are critically climbing ripples with a general orientation of S 10° E (cf. Hunter, Reference Hunter1977).
-
(c) The upper part of a sequence consists of thin parallel-laminated layers; these are also less competent and finely laminated with an average thickness of 7 cm. A schematic view of the turbidite sequences is given in Fig. 6.

Fig. 4. A. The turbidite outcrop of the Bonnidoro Falls; B. Close-up view of the three different beds of the turbidites from the Bonnidoro Falls.

Fig. 5. Climbing ripples in the convoluted layers of the turbidites from the Bonnidoro Falls.
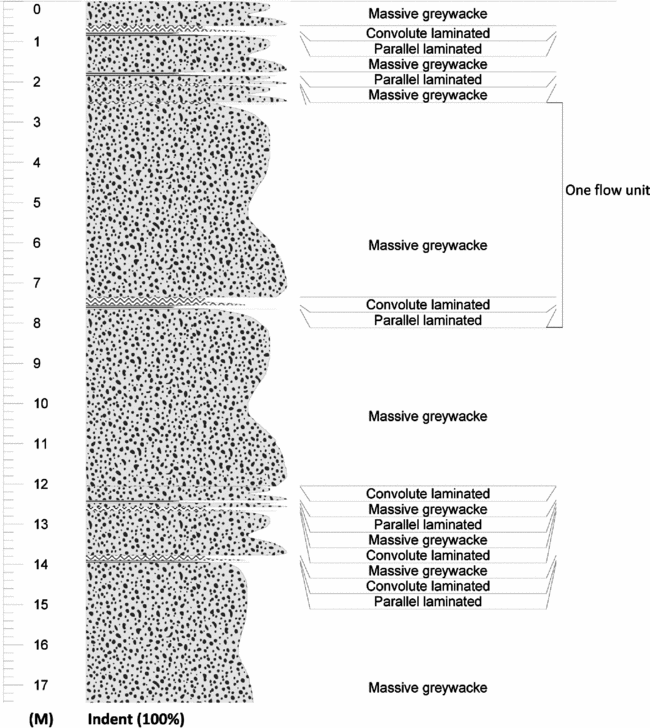
Fig. 6. Schematic view of the turbidite sequences of the Bonnidoro Falls: the x-axis is outcrop relief (proxy for grain size) and the y-axis is thickness of the layers (m).
Facies 2: Paroe Tabiki turbidites . In outcrops between Jedina Kondre and south of the Armina Falls typical greenish greywackes occur which differ from the greywacke found elsewhere in the research area. The turbidites of the Paroe Tabiki are comparatively thin beds of approximately 0.3 m in thickness. The sequence consists of two repeating lithological associations (Fig. 7):
-
(a) Massive, dark-grey, well-indurated, poorly sorted greywacke containing abundant medium- to coarse-grained, angular to sub-rounded quartz, feldspar and some rock fragments. This unit shows slight grading. The average thickness of an individual massive greywacke bed is approximately 0.2 m.
-
(b) Alternating thin-bedded schistose sequences: poorly indurated, fine-grained, schistose beds with an average thickness of 0.1 m. A schematic view of the turbidite sequences is given in Fig. 8. This unit contains numerous concentric calcsilicate concretions up to 10 cm in diameter. They are often hollow inside, likely due to dissolution of carbonate (Fig. 9). The bedding planes wrap around the concretions, suggesting that the concretions were formed diagenetically in the soft greywackes.

Fig. 7. The three repeating beds of the Paroe Tabiki.
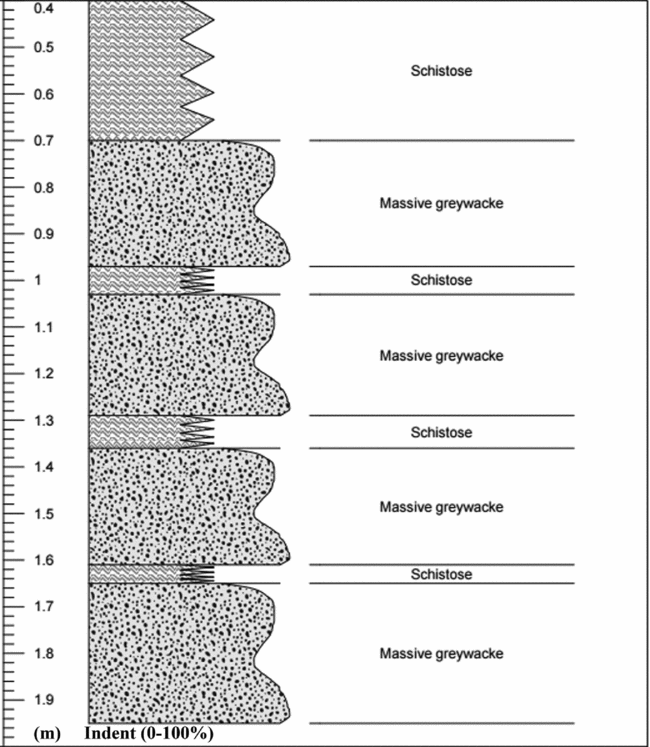
Fig. 8. Schematic view of the turbidite sequences of the Paroe Tabiki Falls: the x-axis is outcrop relief (proxy for grain size) and the y-axis is thickness of the layers (m).

Fig. 9. The calcsilicate concretions in the green turbidites.
Facies 3: Turbidites of the Armina Falls. Here a sequence of turbidites (Fig. 10a) is exposed over 15 m, consisting of five distinguishable beds (Fig. 10b): massive, coarse-grained greywacke, grey, well-indurated, poorly sorted greywacke with abundant medium to coarse, angular to sub-rounded quartz and feldspar CLASTS with some rock fragments and biotite porphyroblasts. (a) An individual, massive, coarse-grained greywacke 0.7 m thick; (b) massive medium- to fine-grained greywacke beds approximately 0.3 m thick; (c) a parallel-laminated phyllitic bed and (d) phylllitic beds with convolute laminations, greenish grey, fine-grained with an average thickness of 0.1–0.2 m. (e) The schistose layers are greenish grey, very fine-grained, shimmery and foliated, with a few biotite and opaque porphyroblasts. The average thickness of these layers is about 0.1 m. Fig. 11 gives a schematic view of the five units.

Fig. 10. A. The turbidite outcrop of the Armina Falls. B. Close-up view of the five different beds of the Armina turbidites.
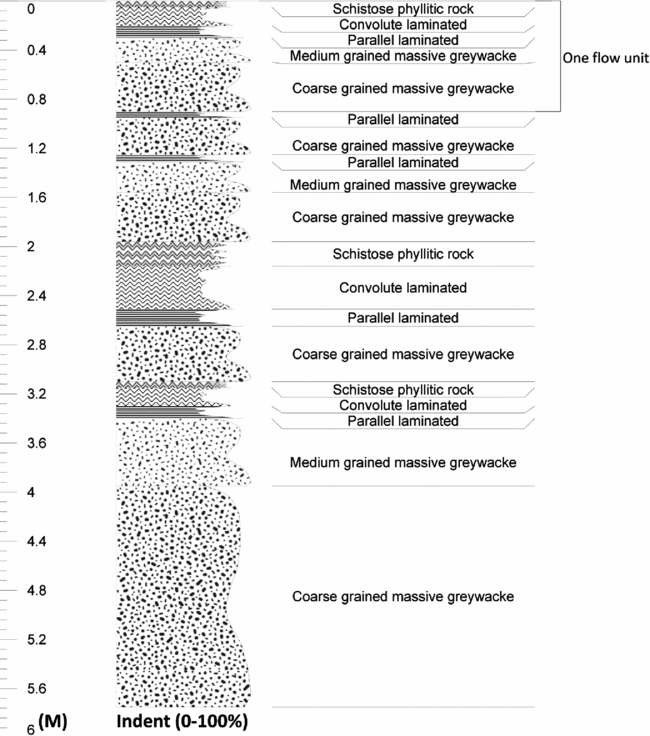
Fig. 11. Schematic view of the turbidite sequences of the Armina Falls: the x-axis is outcrop relief (proxy for grain size) and the y-axis is thickness of the layers (m).
Facies 4: Turbidites of the RGM area. The sequences in the RGM area consist of (1) rhythmic alternations of light and dark thinly laminated phyllite, (2) graded, greenish-grey and coarse-grained greywacke beds 0.3–0.4m thick, locally with scours at the bottom, and (3) a 4.4-m thick polymict conglomerate with elongated pebbles (Figs 12a,b and 13).

Fig. 12. A. Greenish-grey and coarse-grained greywacke drill cores of RGM. B. Scours at the bottom of the layers in the drill cores of RGM.

Fig. 13. Schematic view of the turbidite sequences of RGM: the x-axis is outcrop relief (proxy for grain size) and the y-axis is thickness of the layers (m).
Petrography
General characteristics
The fine- to coarse-grained metagreywackes consist predominantly of quartz and feldspar in a matrix of quartz and sericite. At some places carbonate, chlorite and/or biotite are also present. The metagreywackes in the Marowijne River Area are generally poorly sorted, texturally sub-mature (cf. Folk, Reference Folk1951), with sub-angular to sub-rounded clasts, and mineralogically immature (cf. Pettijohn et al., Reference Pettijohn, Potter and Siever1972; Blatt et al., Reference Blatt, Middleton and Murray1980; Herron, Reference Herron1988). They contain monomineralic quartz and feldspar clasts of 0.5–3.5 mm. Quartz occurs as monocrystalline and polycrystalline clasts, as veins, matrix cement and grains in rock fragments. Some quartz clasts contain embayments (Fig. 14a), typical for quartz phenocrysts of volcanic (rhyolitic) origin. The feldspar occurs as clasts as part of plutonic rock fragments. The feldspar group is dominated by plagioclase and only a few alkalifeldspar clasts were counted. Sericitization is common (Fig. 14b), and plagioclase clasts are often saussuritised (Fig. 14c) and locally show myrmekitic intergrowths with quartz (Fig. 14d).

Fig. 14. A. Embayments in the quartz clast (10X, XPL); B. Sericitation of plagioclase (10X, XPL); C. Saussurite in plagioclase (4X, XPL); D. Myrmekite.
The lithic fragments in the metagreywackes consist of very fine-grained, mafic volcanic fragments (Fig. 15a) and felsic plutonic fragments. The plutonic fragments are probably tonalites (Fig. 15b), composed of quartz, plagioclase laths and sericite grains. The largest plutonic clast counted is 3 mm, while the volcanic clasts range from 0.35 to 2 mm. Other rock fragments are quartzite, counted as quartz in the QFL diagrams and as rock fragments in the QmFLt diagrams (cf. Ingersoll et al., Reference Ingersoll, Bullard, Ford, Grimm, Pickle and Sares1984), and phyllite. The matrix consists of sericite, quartz, chlorite, epidote and carbonate. Zircon, opaque minerals and tourmaline are common accessory minerals.

Fig. 15. A. Sub-rounded, fine grained, mafic volcanic clast (10X, PPL); B. Sub-rounded, felsic plutonic fragments (10X, XPL).
Distinguishing characteristics of the four facies
Facies 1. Both metagreywackes and metapelites of facies 1 contain well-rounded 0.1–2 mm, orange–red poikiloblasts of probably oxidised siderite, which react strongly with HCl (Fig. 16a–c). The carbonate is often only present as rhombohedral skeletal remains around pelitic inclusions. They were probably formed during diagenesis or early metamorphism in the pelitic sediments, as they include finer-grained pelitic material than outside the poikiloblasts, and appear to have rotated during metamorphism (Fig. 16d).

Fig. 16. A. Carbonate poikiloblast in the Bonnidoro metagreywacke with quartz inclusions(4X, XPL); B. Fresh carbonate poikiloblasts in the Bonnidoro metagreywacke (4X, PPL); C. The powder substance disseminated over the phyllite sample with orange porphyroblasts (1X); D. The rotated poikiloblasts in the pelitic matrix, which have a high interference colour, probably due to the presence of carbonate.
Facies 2 : The green metagreywacke of facies 2, between Jedina Kondre and Kalfoe Kondre south of the Armina Falls, is very rich in quartz and contains feldspar, phyllite fragments, chlorite and epidote. The green colour is explained by the presence of typical green minerals like chlorite and epidote. The concentric concretions from Jedina Kondre and Paroe Tabiki consist largely of calcsilicate minerals: fan-shaped actinolite (Fig. 17a), biotite, chlorite, garnet poikiloblasts (andradite, a Ca-garnet) (Fig. 17b) with quartz and chlorite inclusions, epidote (Fig. 17c) and clinozoisite (Fig. 17c,d). This mineral association results from a chemical reaction between the original carbonate and the surrounding quartz-rich rocks during metamorphism.

Fig. 17. A. Actinoline (10X, XPL); B. Formation of garnet surrounded by epidote and clinozoisite (10X, XPL); C. Clinozoisite and epidote in a quartz matrix (10X, XPL); D. Concentration of epidote and clinozoisite near the core of the concretion.
Facies 3: The coarse-grained sample RN 48-1 and the medium-grained massive metagreywacke sample RN 48-2 contain abundant medium to coarse, angular to sub-rounded quartz and feldspar clasts, some rock fragments and tabular biotite porphyroblasts (Fig. 18). Thin-bedded laminated sample RN 48-3 and convolute layer sample RN 48-4 contain fine-grained clasts with opaque minerals and biotite porphyroblasts. The schistose layer sample RN 48-5 consists of very fine-grained minerals, and is laminated and schistose, with few biotite and opaque porphyroblasts. The matrix is very rich in quartz and consists further of chlorite, very fine fragments of sericite, some muscovite and porphyroblasts of biotite. Only one sample, RN 48-1, has been point counted because in the finer beds it is impossible to differentiate between the quartz clasts and matrix due to recrystallisation during metamorphism. The presence of biotite indicates a higher grade of metamorphism than in the other three turbidite facies.

Fig. 18. Biotite porphyroblasts (10X, XPL).
Facies 4 : The conglomerates of the RGM cores are polymictic, with more lithic fragments than free minerals. The lithic fragments consist of mafic volcanic rocks, fine-grained mafic, porphyritic rocks with feldspar laths and a fine-grained mafic matrix, and further phyllite and quartzite grains. The pebbles are rounded and elongated, evidencing deformation. The matrix is rich in carbonate, quartz and sericite. Other minerals found in the matrix are epidote, calcite and opaque minerals like oxides. The graded metagreywacke in the cores consists of angular quartz clasts of about 0.5 mm, opaque minerals and calcite crystals in a carbonate, sericite and chlorite matrix. The metagreywacke is greenish grey and contains many calcite–quartz micro-veins.
The finely laminated phyllites in the cores are rich in mafic minerals (especially chlorite) in the darker laminae, while the lighter laminae contain fewer mafic minerals.
Point-counting results
The results of all the point-counted thin sections are summarised in Table 1. Table 2 contains further processed data. The data of Table 1 are plotted in the QFL diagram (Fig. 19). Almost all the samples are categorised as feldspathic wacke except for the metagreywacke of a quartz-rich quartzwacke, and a lithic wacke in facies 4 with a high concentration of lithic fragments.
Table 1. Data from point counting for QFL diagram.
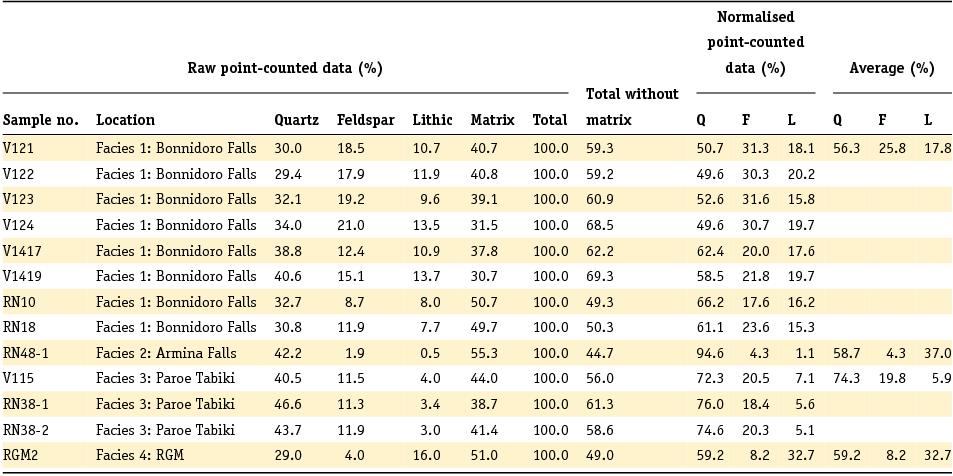
Q, total quartzose grains (mono- and polycrystalline), including lithic fragments such as chert and quartzite; F, feldspar; L, unstable, lithic grains (rock fragments).
Table 2. Data from point counting for the QmFLt diagram.
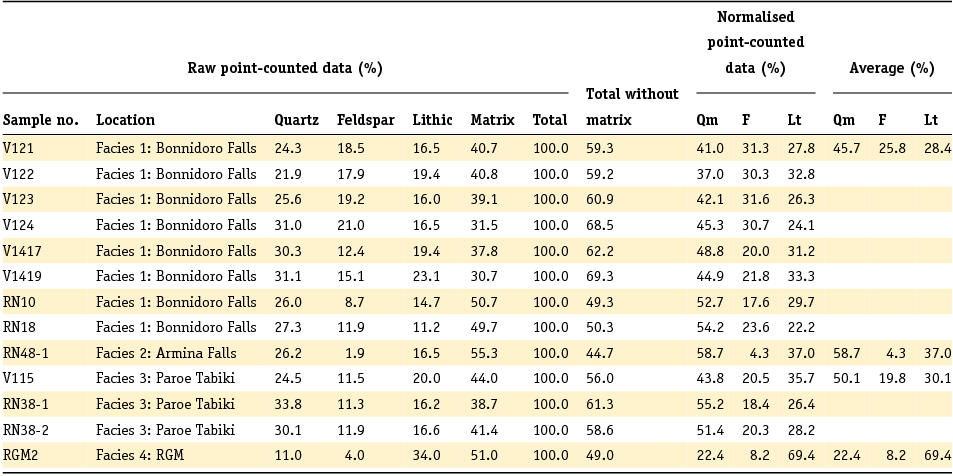
Qm, monocrystalline quartz; F, feldspar grains; Lt, total polycrystalline lithic fragments, including quartzose varieties.

Fig. 19. A QFL diagram showing the mineral composition of the four facies.
A comparison of the point-counting results of the four different facies clearly shows that the RGM samples are much richer in volcanic clasts, whereas the Marowijne facies are richer in quartz and plagioclase. This suggests that the two study areas may have different provenance areas. The possible stratigraphic and chronological implications are discussed below (Fig. 20).
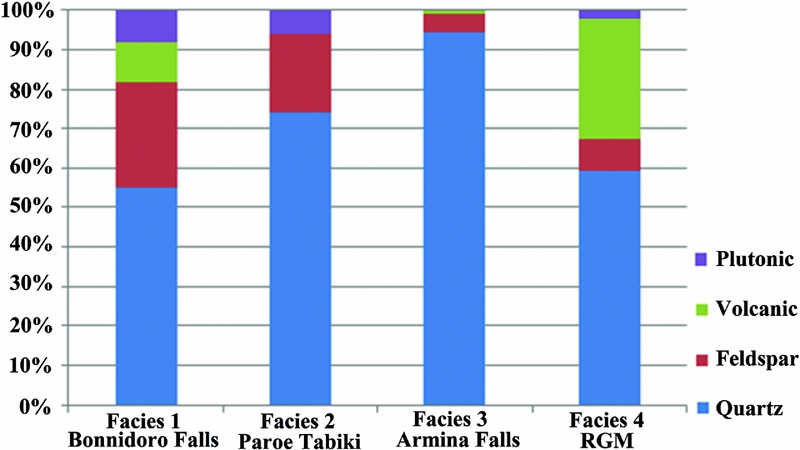
Fig. 20. A column diagram of the greywacke clasts of the Marowijne River and RGM.
Relationship between petrographic composition and tectonic setting
The tectonic provenance discriminating diagrams QFL and QmFLt (cf. Dickinson et al., Reference Dickinson, Beard, Brackenridge, Erjavec, Ferguson, Inman, Knepp, Lindberg and Ryberg1983) provide information about the tectonic settings of the associated provenance areas and the basins of deposition by modal percentage calculation. The point-counting data are summarised in Table 2 and plotted in the QmFLt triangle diagrams (Fig. 21).

Fig. 21. A. QFL ternary diagram of the metagreywacke from the Marowijne River and one of the RGM (J-Zone), with recycled orogenic, craton interior and transitional continental provenances (Dickinson et al., Reference Dickinson, Beard, Brackenridge, Erjavec, Ferguson, Inman, Knepp, Lindberg and Ryberg1983). B. QmFLt ternary diagram of the metagreywacke from the Marowijne River and one of the RGM (JZone), with mixed-dissected arc, recycled quartzose and recycled lithic provenances (Dickinson et al., Reference Dickinson, Beard, Brackenridge, Erjavec, Ferguson, Inman, Knepp, Lindberg and Ryberg1983).
These diagrams show that the comparatively high polycrystalline quartz and quartzite content of the rocks drags the samples into the mixed-dissected arcs and quartzose recycled category when the quartz is grouped with the lithic fragments (diagram on the right). The provenance is therefore more likely to be recycled orogenic than magmatic arc. The Armina Falls greywacke has a total quartzose framework mode, apparently composed of derivatives of the stable parts of the craton. The Paroe Tabiki samples are slightly more feldspathic, characteristic of the transitional group derived from the continental blocks. The source areas of the Paroe Tabiki suites had probably slightly greater relief than the cratonic provenance, but not enough to produce more feldspathic greywacke. The greywackes in the recycled orogenic block contain lithic fragments which may have been derived from rocks overlying the basement, local volcanic fields that may be related to rifting events or belts of metamorphic rocks associated with basement terranes. This is in harmony with the supposed tonalitic provenance derived from clast petrography. The RGM greywacke is of recycled orogenic and/or recycled lithic provenance. Reading ‘lithic’ as volcanic, this fits the more volcaniclastic nature of these greywackes.
Geochemistry
Major element data from the four facies
Major element data are summarised in Table 3 and plotted in the log (Na2O/K2O) versus log (SiO2/Al2O3) diagram of Pettijohn et al. (Reference Pettijohn, Potter and Siever1972), together with reference concentrations of post-Archean Australian average shales (PAAS) (Taylor & McLennan, Reference Taylor and McLennan1985) and upper continental crust (UCC) (Rudnick & Gao, Reference Rudnick and Gao2003) (Table 3, Fig. 22).
Table 3. Major elements of the samples from the Marowijne River with the PAAS and UCC values.
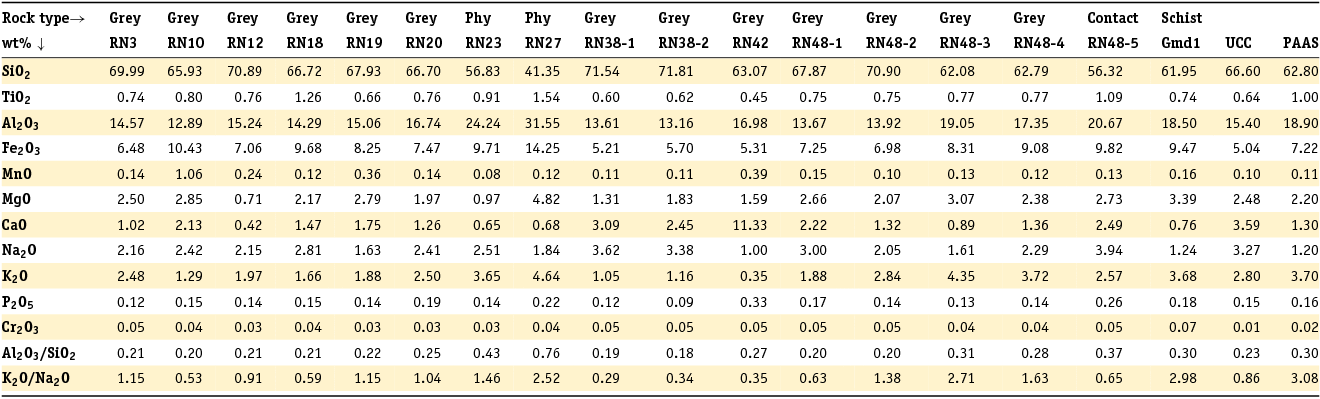
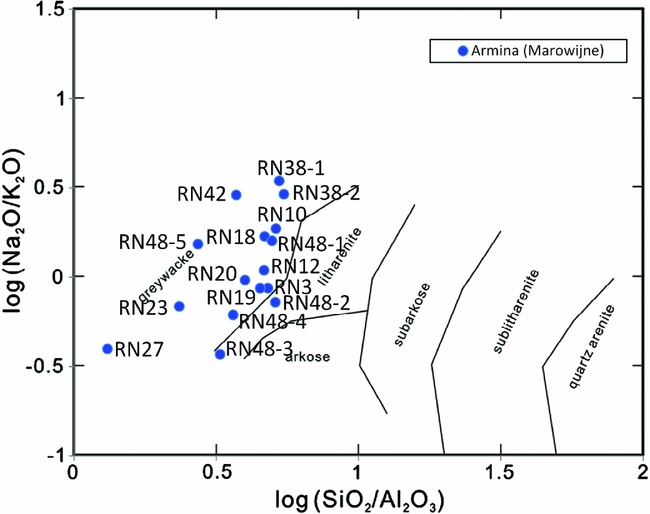
Fig. 22. Classification of the analysed Armina Formation metasedimentary rock samples from the Marowijne River according to their logarithmic ratios of SiO2/Al2O3 and Na2O/K2O after Pettijohn et al. (Reference Pettijohn, Potter and Siever1972).
All samples plot as greywacke except for RN48-2 and RN 48-3. These plot as litharenite. Coarser rocks are usually higher in SiO2 and lower in Al2O3 than finer rocks from the same turbidite unit, as is seen in RN48 1–5: this is the geochemical expression of upwards increasing clay content. The phyllites RN 23 and RN 27 have low SiO2, MgO and CaO, and high Al2O3. The calcsilicate rock RN 42 has high CaO, low Na2O and K2O, and has a low K2O/Na2O. The four facies do not differ much in their major element distribution, as grain size variations within the individual fining upwards sequences in each facies cause more geochemical differentiation than the petrographic differences between the facies.
Comparison with existing data from the RGM
Table 4 shows existing analytical data from Armina Formation samples from cores drilled in the J-Zone pit (Daoust et al., Reference Daoust, Voicu, Brisson and Gauthier2011) and in the Koolhoven pit in the RGM (Carlier, Reference Carlier2012). These also plot in the greywacke field in Pettijohn's diagram (Fig. 23). Some are phyllites, but these cannot be distinguished in the log SiO2/Al2O3 and Na2O/K2O plot.
Table 4. Major elements of the samples of the Armina Formation from RGM, with the J series samples (Daoust et al., 2011) and the LC series samples Carlier (2012).
RGM, Rosebel Gold Mine; KH, Koolhoven; UCC, Upper Continental Crust; PAAS, Post Archean Australian shales; m-s-g, mudstone-siltstone-greywacke; conglo, conglomerate; grey, greywacke; silt-mud, siltstone-mudstone.
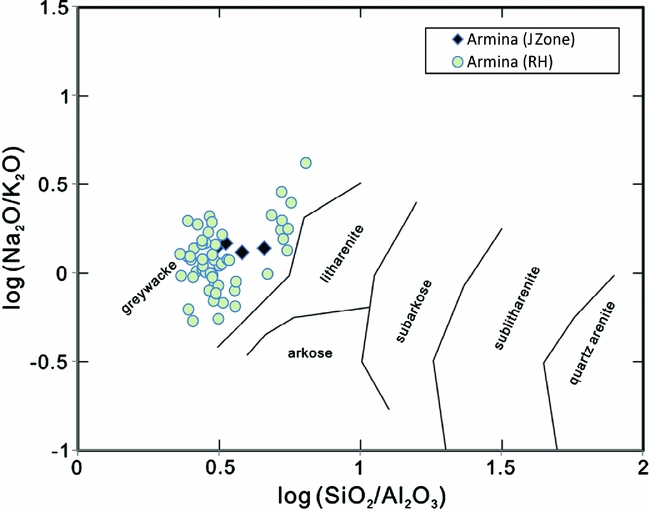
Fig. 23. Classification of the analysed Armina Formation metasedimentary rock samples from RGM according to their logarithmic ratios of SiO2/Al2O3 and Na2O/K2O after Pettijohn et al. (Reference Pettijohn, Potter and Siever1972).
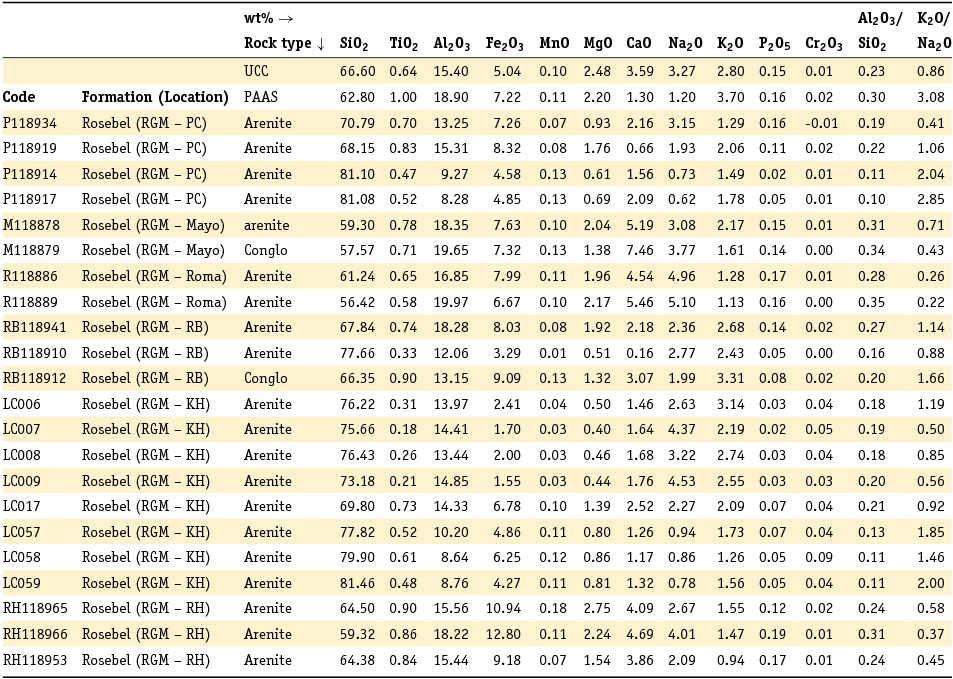
Core samples collected by Daoust et al. (Reference Daoust, Voicu, Brisson and Gauthier2011) and Carlier (Reference Carlier2012) from the Pay-Caro, Mayo, Royal Hill and Rosebel pits in the RGM were classified by them as Rosebel Formation arenites. However, the precise stratigraphic relations with the Armina Formation were not visible in the cores. The published major element results of these samples are summarised in Table 5 and plotted in the log (Na2O/K2O) versus log (SiO2/Al2O3) diagram (Fig. 24).
Table 5. Major elements of the samples of the Rosebel Formation from RGM, with the Pay Caro, Mayo, Roma, Rosebel and Royal Hill series samples from Daoust et al. (2011) and the LC series samples from Carlier (2012).
RGM, Rosebel Gold Mine; PC, Pay Caro; RB, Rosebel; KH, Koolhoven; RH, Royal Hill; UCC, Upper Continental Crust; PAAS, Post Archean Australian shales; conglo, conglomerate.
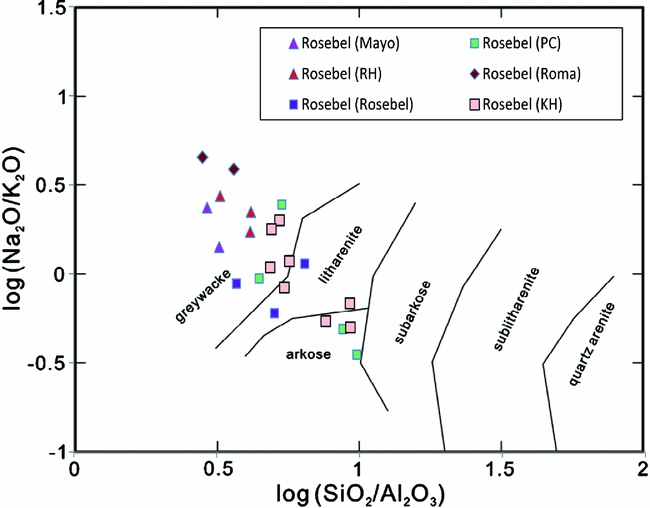
Fig. 24. Classification of the analysed Rosebel Formation metasedimentary rock samples from RGM according to their logarithmic ratios of SiO2/Al2O3 and NaO/K2O after Pettijohn et al. (Reference Pettijohn, Potter and Siever1972).
The Pettijohn plot of Fig. 24 shows the samples from Roma and Mayo plot as greywacke, those from Pay Caro as greywacke and arkose, those from the Rosebel pit as greywacke and litharenite, the Royal Hill samples as greywacke and the samples of Koolhoven as greywacke, litharenite and arkose. This raises the question of whether not part of those samples should rather have been classified as Armina instead of as Rosebel.
Factor analysis
In order to compare the RGM greywackes with those of the Marowijne, we used the complete dataset including our own samples and the existing data by Daoust et al. (Reference Daoust, Voicu, Brisson and Gauthier2011) and Carlier (Reference Carlier2012) to find distinguishing characteristics between our own four facies, and the Armina and Rosebel Formations within the RGM. Clearly the Pettijohn diagrams based only on few elements are insufficient for that purpose, therefore we applied factor analysis using all elements. From the rotated component matrix (Table 6) three factors are found, which in total explain 66.6% of the variability.
Table 6. Rotated component matrix.
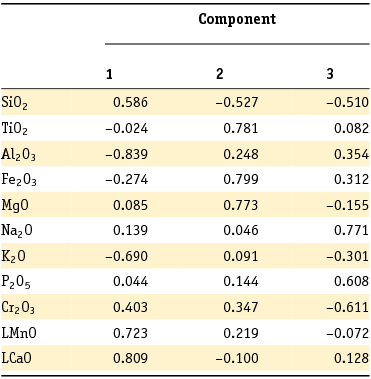
Table 6 shows that Factor 1 is dominated by positive loadings of SiO2, LMnO and LCaO (the logarithms of MnO and CaO are used because of irregularities in the data), whereas Al2O3 and K2O show high negative loadings. Factor 2 is dominated by positive loadings of TiO2, Fe2O3 and MgO, and Factor 3 by positive loadings of Na2O and P2O5. The factor scores of all samples from Marowijne and RGM are plotted in Figs 25, 26 and 27.

Fig. 25. Factor 1 vs. Factor 2. Factor 1 on the x-axis represents the quartz-rich greywackes on the right side and the aluminum-rich phyllites on the left side, while Factor F2 on the y-axis represents the mafic-rich rocks in the upper part of the plot and the mafic-poor rocks in the lower part.

Fig. 26. Factor 1 vs. Factor 3. Factor 3 on the y-axis represents the plagioclase-rich rocks in the upper part of the plot and the plagioclase-poor rocks in the lower part.

Fig. 27. Factor 2 vs. Factor 3, showing the separation of the Rosebel Formation rocks poor in mafic minerals and plagioclase and the Armina Formation rocks rich in mafic and plagioclase.
Fig. 25 (F1–F2) shows the separation along the x-axis (F1) between siliceous (quartz-rich) greywackes on the right side and the aluminum-rich phyllites on the left side. The coincidence of the Marowijne clusters illustrates that the geochemical differences between rocks of different grain size in the same turbidite facies are larger than the differences between the different turbidite facies. The y-axis (F2, representing positive loadings of TiO2, Fe2O3 and MgO) shows samples rich in mafic minerals (i.e. biotite, chlorite, magnetite, ilmenite, garnet) in the upper part of the plot and samples poor in these elements on the lower side. Against expectations, the green metagreywacke and its concretions plot in the Fe2O3, MgO, TiO2-poor and SiO2-rich regions of the factor analysis. The differences in the results are probably because the selected samples for the analysis are not very rich in chlorite. Only the most mafic-poor samples in the red ellipsoid are considered as belonging to the Rosebel Formation. The others are chemically indistinguishable from Armina Formation rocks.
Fig. 26 (F1–F3) shows the same separation along the x-axis as in Fig. 26, but now the y-axis distinguishes Na-rich (plagioclase) and P-rich (apatite) samples from samples poor in these elements. The role of Cr, a typical element concentrated in mafic igneous rocks, is not clear.
The F2–F3 plot in Fig. 27 is the best plot to show differences between the factor scores of individual samples irrespective of their grain size. It shows a clear separation in Armina Formation samples, which are comparatively rich in plagioclase and mafic minerals, and Rosebel Formation samples (in the red ellipsoid), which are poor in these minerals. This suggests indeed that a large part of the samples which previously was classified as Rosebel Formation by Daoust et al. (Reference Daoust, Voicu, Brisson and Gauthier2011) and Carlier (Reference Carlier2012) in fact may belong to the Armina Formation.
Discussion
Provenance differences between the three facies along the Marowijne River
The point-counting data summarised in Fig. 20 suggest that the three facies exposed along the Marowijne River show subtle differences in composition. From south to north, the greywackes from Bonnidoro Tabiki to Armina Falls increase in quartz content, while the feldspar content decreases. The more resistant quartz is enriched in the northern areas, while the southern areas have more of the less-resistant feldspar. Plutonic fragments decrease also from south to north while monomineralic grains increase in quantity. This may indicate that the differences between the three facies are not caused by different provenance areas, but probably by differences in weathering and transport of the source rocks. This may imply that the more immature southern Bonnidoro turbidites are older than the northern Armina Falls turbidite. However, the increase in sand-sized quartz content in the metagreywackes of the Armina Falls might also be influenced by the higher grade of metamorphism, as metamorphic recrystallisation increases the size of the crystals.
Provenance differences between metagreywackes from the Marowijne River and RGM
Fig. 20 shows that the metagreywackes from the Marowijne River contain more plutonic fragments than the metagreywackes from RGM, which contain more volcanic fragments. This suggests different source areas. The grain size of the quartz and feldspar clasts in the metagreywackes of the Marowijne River are up to 3 mm; this is a very important indicator for a plutonic instead of a volcanic source area. The plutonic fragments in the metagreywackes of the Marowijne River are probably tonalites (quartz-plagioclase-biotite), which are derived from the TTG plutons. The presence of tonalite fragments in the metagreywackes of the Marowijne River indicates that probably the TTG plutons are older than the metagreywackes. This is supported by age and isotope data from French Guiana (Delor et al., Reference Delor, Lahondère, Egal, Lafon, Cocherie, Guerrot and De Avelar2003a). The metagreywackes of RGM, on the other hand, contain both mafic and felsic volcanic fragments, which means that these have different source areas.
Differences between Armina and Rosebel Formations
Factor analysis gives a good distinction between the Armina and Rosebel Formations. The arenite samples from Koolhoven of Carlier (Reference Carlier2012), and from Pay Caro and Royal Hill of Daoust et al. (Reference Daoust, Voicu, Brisson and Gauthier2011) (Fig. 27) seem to be the only ‘real’ Rosebel Formation arenites. Probably Royal Hill pit is still in the transition zone of Armina and Rosebel because some samples of the Royal Hill pit are plotted as Armina. The other samples from Mayo and Roma of Daoust et al. (Reference Daoust, Voicu, Brisson and Gauthier2011) are very rich in Fe and poor in Na, which means these ’arenites’ are probably greywackes of the Armina Formation. The very mature arenites are poor in Fe2O3, MgO and TiO2, which represent the mafic minerals, and very high in SiO2. It is suggested that the name Rosebel Formation should only be used for the very mature quartz-rich rocks. The ‘real’ quartzarenites and the other immature greywackes of Daoust et al. (Reference Daoust, Voicu, Brisson and Gauthier2011) (Fig. 27) might be better grouped as Armina Formation. The difference in interpretation might be due to the fact that the contact between these two formations is not clear, and RGM is situated on the contact of the Armina and Rosebel Formations, not in the middle of the syncline basin where probably the very mature arenites predominate. The mature Rosebel arenites have probably been deposited in an epicontinental fluvial environment, from a source area that was much more weathered than any of the source areas of the turbidites.
Conclusions
The Armina Formation metagreywackes show features of deposition by turbidity currents: coarse-grained, poorly sorted graded greywackes, covered by fine-grained, parallel-laminated phyllites, often with convolute structures and climbing ripples. Their immature composition suggests deposition in an arc-trench environment. The predominance of quartz and plagioclase clasts and tonalite lithic fragments suggests an exhumation of the TTG plutons before deposition of the turbidites. Three facies of metagreywackes can be distinguished along the Marowijne River on the basis of their mineralogy, siderite nodules and calsilicate concretions. Metagreywackes in the southern part of the studied stretch of the Marowijne River might be slightly older than those in the north, on the basis of their more immature character. The metagreywackes of RGM have a predominantly volcanic source area, probably the Paramaka Formation volcanics. This shows that alongstrike the greenstone belt, areas of different surface geology have contributed to the composition of the turbidites, suggesting a more varied paleogeography of the source areas than previously thought. Many rock samples classified in the past as Rosebel Formations might belong on account of their major elements chemistry to the Armina Formation. This requires a reappraisal of the surface geology and sequence of events in the greenstone belt.
Acknowledgements
This research has been supported by a fund from IAMGOLD-Rosebel Gold Mine. We would also like to thank Rosebel Gold Mines for the permission to visit the core-shack and compile the necessary information for this project, with a special note of thanks to Nicole Houle and Caroline Daoust. Louis Carlier is thanked for his willingness to share the data of his research for this project. The Geological and Mining Service of Suriname, especially the head, Mahinder Autar, is thanked for permission to use available data. Professor Theo Wong and Nicole Kioe-A-Sen of the Anton de Kom University are thanked for their support. We would also like to thank the field crew, including Mr Ewald Poetisi of de Anton de Kom University, Benny Pinas and Dwight Lawrence. Otto Stiekema and Leonard Dik of Utrecht University are thanked for preparing the thin sections. Henk Naarendorp and Stephen Essed of FILAB Suriname are thanked for the geochemical analysis. We very much appreciated the willingness of Dr Vriend to help with the factor analysis using SPSS. Kees de Jong and Arike Gill of Naturalis, Leiden, are thanked for their help in tracing the samples collected during early expeditions (1902–1926) along the Marowijne River, and the thin sections prepared from them. Last but not the least the reviewers Professor Poppe de Boer and Dr Dennis LaPoint are thanked for their critical and constructive comments.


