


Hypertension and diabetes represent a threat to global health due to their growing trend and increased impact in developing countries(1). Hypertension currently affects one billion people, while diabetes affects nearly 500 million people worldwide(2,3) . In Peru, the prevalence of hypertension is estimated at 14·8 % and that of diabetes is between 3·6 and 7 %(4,Reference Carrillo-Larco and Bernabé-Ortiz5) . The complications of these conditions represent a significant burden of disease in terms of mortality and disability as well as a high economic burden at the country level(Reference Mutowo, Lorgelly and Laxy6–8). Thus, it is relevant to implement prevention strategies and timely screening in higher risk populations.
Overweight is one of the main risk factors for the onset of hypertension and diabetes. The World Health Organisation (WHO) proposed the use of the body mass index (BMI) for the diagnosis of obesity and waist circumference (WC) for measuring the risk of metabolic complications(9). For this reason, the BMI is currently the most widely used measure in clinical and epidemiological contexts, although there is a concern about its low accuracy in detecting cardiovascular risk in specific populations(Reference Wollner, Paulo Roberto and Alysson Roncally10).
Others indices such as the waist:hip ratio (WHR), the waist:height ratio (WHtR) and the conicity index (C-index) are currently performed to provide information about body composition and to predict morbidity and mortality at the population level(Reference Zazai, Wilms and Ernst11). Some of the indices such as WC, WHtR and WHR are better predictors than BMI of the risk of developing hypertension and type 2 diabetes mellitus in different countries(Reference Caminha, Ferreira and Costa12–Reference de Souza, Rodrigues and Muraro14). However, the WHO concluded that cut-off points for WC and WHR must be identified according to the anthropometric characteristics of specific populations(Reference Nishida, Ko and Kumanyika15). Moreover, others indices such as the C-index are in the exploratory stage, and accurate cut-off points have not yet been defined.
In Peru, through the Ministry of Health, the National Institute of Health has suggested the use of BMI for the detection of obesity and WC for the detection of the risk of hypertension and diabetes(16,17) . However, there is controversy about the cut-off points of WC for Latin America, since the cut-off points for the Asian population have been adopted(Reference Alberti, Zimmet and Shaw18). This is relevant because some studies in Latin America show that the internationally proposed cut-off for WC provides a poor estimate of cardiometabolic risk(Reference Aschner, Ruiz and Balkau19–Reference Sánchez-Castillo, Velázquez-Monroy and Berber21), thereby demonstrating the need for regional limit values(Reference Aschner, Buendía and Brajkovich22).
In contrast to this controversy, there are other anthropometric indicators such as the WHtR that incorporates the size of the individual in the measurement, improving the precision of the estimation of risks(Reference Ashwell, Gunn and Gibson23). This is very important in the Peruvian population because it has one of the lower heights worldwide(24). Furthermore, a genetic variation has even been postulated in a recently published study that would explain the short stature on this population(Reference Asgari, Luo and Akbari25). The presence of this genetic variation would produce a reduction of 2·2 to 4·4 cm in height and is more frequent in the population from the coast - one of the three natural regions of Peru which comprises 55·9 % of the total population - than in the highlands or the Jungle.
To date, compared with the BMI, the cut-off points and the level of prediction of risk of hypertension and diabetes of the WC, WHtR and C-index in the Peruvian population are unknown(Reference Ninatanta-Ortiz and Romaní26,Reference Chirinos, Morey-Vargas and Goldberg27) . Therefore, considering that the last Demographic and Family Health Survey (ENDES, in Spanish) 2018 has incorporated WC measurement, we aimed to determine the optimal cut-off points of the BMI, WC, the WHtR and the C-index to predict the probability rates of hypertension and diabetes in the Peruvian population according to sex and age groups.
Methods
Settings
Peru is a South American country made up of three regions: the Coast, Highlands and Jungle, with 55·9 % of the population residing on the Coast, 29·6 % in the Highlands and 14·5 % in the Jungle(28). Likewise, Peru has a population of more than 35 million inhabitants, among which about 6·5 million live in rural areas of the Peruvian territory, especially in the Highlands and Jungle regions(29). Unlike countries with a marked predominance of a race, such as Caucasian or Asian, these regions have a diversity of mixtures with a series of genotypes and phenotypes that hinder the ethnic classification of the population and explain some nutritional characteristics of these populations(Reference Harris, Song and Shetty30,Reference Guio, Poterico and Levano31) .
Study design and subjects
A cross-sectional study was conducted based on the data obtained by ENDES 2018, which is an annual population-based survey performed by the Demographic and Health Survey Programme that provides information on maternal and child health indicators and communicable and non-communicable diseases(4,Reference Hernández-Vásquez and Chacón-Torrico32) . The survey is supervised by the National Institute of Statistics and Informatics of Peru and contains three questionnaires on households, women’s health and health characteristics. The sampling and analysis units were households and individuals, respectively. A detailed description of the sampling method, enrolment procedure and ENDES objectives has been reported previously(4,Reference Hernández-Vásquez and Chacón-Torrico32) .
A total of 33 794 people over the age of 15 years were interviewed in the ENDES 2018 survey. The sample selected for this study included subjects >18 years of age (31 553). Questionnaires and physical examinations were performed to register socio-demographic and biophysical variables by trained staff according to a standard protocol(33).
Hypertension, diabetes and anthropometric measurements
Individuals were considered to have hypertension if their average (two readings) systolic blood pressure was ≥140 mmHg or diastolic blood pressure was ≥90 mmHg(Reference Chobanian, Bakris and Black34) using a digital blood pressure monitor, or a self-reported diagnosis of hypertension by a doctor.
Diabetes was defined through self-reporting of whether an individual had been diagnosed with diabetes mellitus previously by a doctor (Has a physician ever diagnosed you with diabetes or high blood sugar?).
Four anthropometric indices were used in the study: the BMI, WC, the WHtR and the C-index. BMI was calculated according to the Quetelet index as weight (kg) divided by height squared (m2). WC was measured at a midway point between the lower rib margin and the iliac crest. The WHtR was calculated as WC (cm) divided by height (m), and the C-index was determined applying the following formula proposed by Valdez et al. (Reference Valdez35)
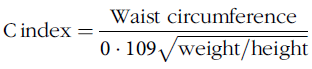 $${\rm C}\, {\rm index} = {{\rm Waist\ circumference}\over {0 \cdot 109 \sqrt {{\rm weight}/{\rm height}}}}$$
height and WC should be recorded in metres and the weight in kilograms; the constant of 0·109 is to convert volume and mass to height.
Contrary to the previously mentioned anthropometric indices, the C-index is considered an exploratory measurement, and therefore, its cut-off points have not been accurately defined. However, this index has been developed taking into account that the human body changes from a cylindrical shape (C-index equals 1·0) to a ‘double cone’ (C-index up to 1·73) when adiposity is accumulated in the waist(Reference Valdez35). This fact makes this index potentially usable in certain populations, since it takes into account the relationship between weight, height and waist circumference at a time, allowing the comparison of people with different measurements of body weight and height(Reference Almeida, Almeida and Araújo36).
For analytical purposes, the BMI was classified into four categories: <18·5, 18·5–24·9, 25·0–29·9 and ≥30 kg/m2 according to the WHO classification(37). WC was classified as a risk indicator when ≥90 cm for men and ≥ 80 cm for women according to the International Diabetes Federation of Ethnic South and Central Americans(Reference Alberti, Zimmet and Shaw18). The WHtR was defined as a risk indicator when ≥0·5 for both men and women(Reference Browning, Hsieh and Ashwell38). Currently, the C-index does not have established cut-off points, and therefore, it was classified as a risk indicator when ≥1·29 for men and ≥1·25 for women according to a study conducted in Brazil(Reference Dutra, Reis and Martins39).
Covariates
Sex (male; female) and age groups (18–24, 25–44, 45–64, 65 or more years) were considered to stratify the selected population. To describe the population characteristics, the following variables were reported: current smokers (smoked in the last 30 d) (yes/no), alcohol consumption in the last 12 months for 12 or more days (yes/no) and area of residence (urban/rural).
Data analysis
Continuous variables were presented as means and standard deviations (sd), and categorical variables were expressed as absolute numbers and weighted proportions with 95 % confidence intervals (CI). Prevalence and age-standardised prevalence were estimated based on the WHO reference population(Reference Ahmad, Boschi-Pinto and Lopez40) for anthropometric measures for hypertension and diabetes. Age-standardised prevalence allows more accurate comparisons between structurally different populations(Reference Naing41). The mean differences between groups (men and women) and age-adjusted proportions were tested by linear combination of weighted means and the χ 2 test. In addition, alluvial diagrams to visualise relations among anthropometric indices were also carried out. We included the ENDES 2018 sampling specifications, including stratification, and ponderation factor. The Youden’s index ((sensitivity + specificy) − 1) (YIndex) was used to identify optimal cut-off points according to sex and ages of the BMI, WC, the WHtR and the C-index for the prediction of hypertension and diabetes(Reference Fluss, Faraggi and Reiser42,Reference Clayton43) . The area under the curve (AUC), sensitivity (S) and specificity (Sp) values were calculated using the cutpt command. CI at 95 % of the AUC were also estimated using bootstrapping with 1000 replications.
All statistical analyses were performed using Stata v14·2 (Stata Corporation). The level of statistical significance was P < 0·05.
Ethical considerations
This study did not require the approval of an ethics committee because it is an analysis of aggregated secondary data that are in the public domain (http://iinei.inei.gob.pe/microdatos/) and does not identify any participants.
Results
Socio-demographic and clinical characteristics of the sample
Of the 31 553 subjects evaluated, 57 % were women. The most frequent age group was 25 to 44 years (51·57 % of men and 53·06 % of women), and the mean age was 41·66 years (sd 15·96) for men and 40·02 years (sd 16·14) for women. The average heights were significantly different according to natural region and were lower, both for men and women, in the rural Highlands. The mean BMI, WHtR and C-index values were higher in women at 27·49 (sd 4·82), 0·61 (sd 0·08), 1·30 (sd 0·08), respectively, while the mean WC was higher in men with 92·12 cm (sd 11·28) (Table 1).
Table 1 Socio-demographic and clinical characteristics of Peruvian adults, Demographic and Family Health Survey (ENDES) 2018*
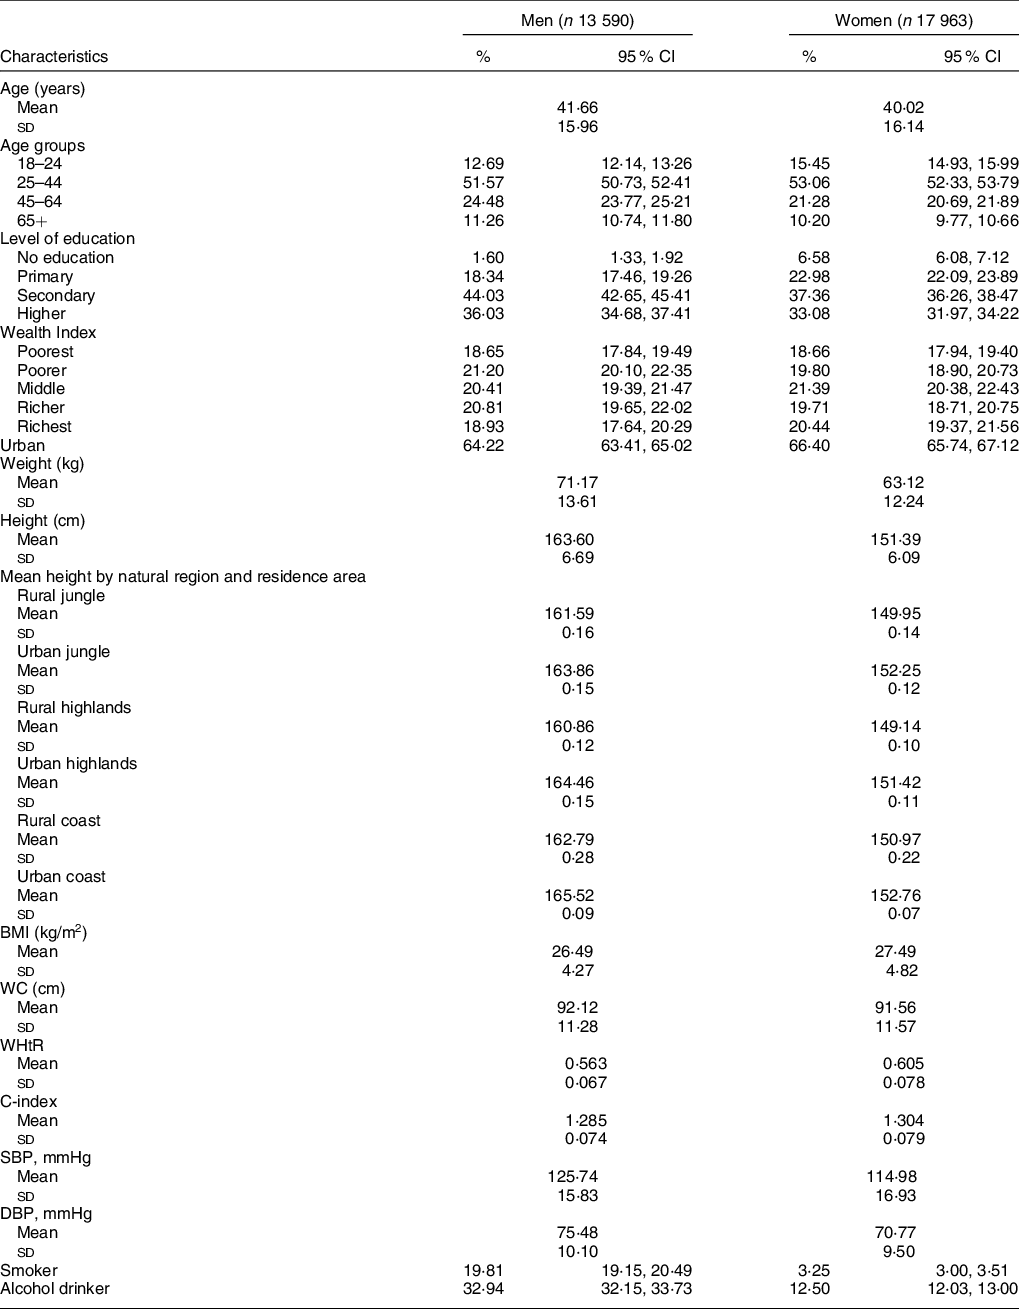
WC, waist circumference; WHtR: waist:height ratio; C-index, conicity index; SBP, systolic blood pressure; DBP, diastolic blood pressure.
* Weights and sample specifications of the ENDES 2018 were included (except for continuous variables).
Prevalence of obesity, cardiometabolic risk, hypertension and diabetes
The standardised prevalence of obesity calculated with the BMI was 21·05 % in men and 27·78 % in women (P < 0·001). The prevalence of cardiometabolic risk calculated with the WC, WHtR and C-index was statistically higher in women (84·91 %, 92·16 % and 76·93 %) compared with men (60·77 %, 82·78 % and 50·50 %) (P < 0·001), respectively.
In addition, the standardised prevalence of hypertension was 23·15 % in males and 18·41 % in females (P < 0·001), while the prevalence of diabetes was 3·25 % and 4 %, respectively (P = 0·017) (Table 2).
Table 2 Anthropometric indices and clinical characteristics of Peruvian adults, Demographic and Family Health Survey (ENDES) 2018*
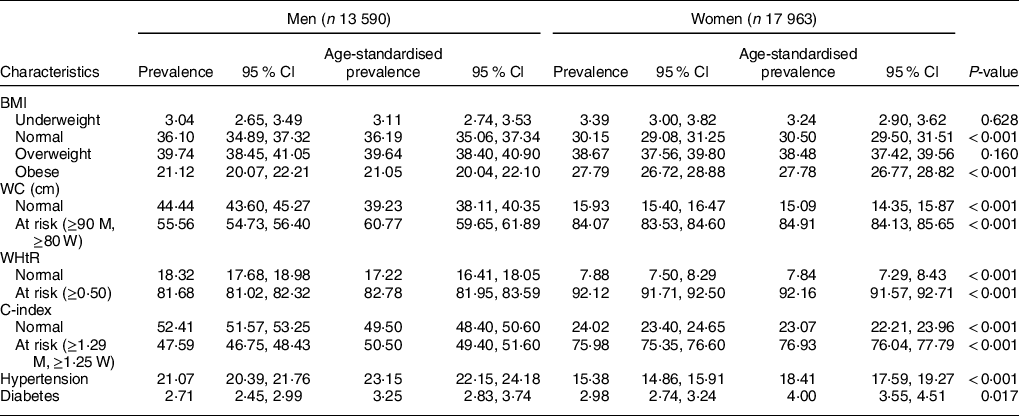
WC, waist circumference; WHtR, waist:height ratio; C-index, conicity index; M, men; W, women.
* Weights and sample specifications of the ENDES 2018 were included.
Figure 1a-c shows the differences in risk estimation using the BMI v. the WC, WHtR, and C-index. A considerable group of males and females considered as normal according to the BMI were considered at risk with the WC, WHtR and C-index, respectively.
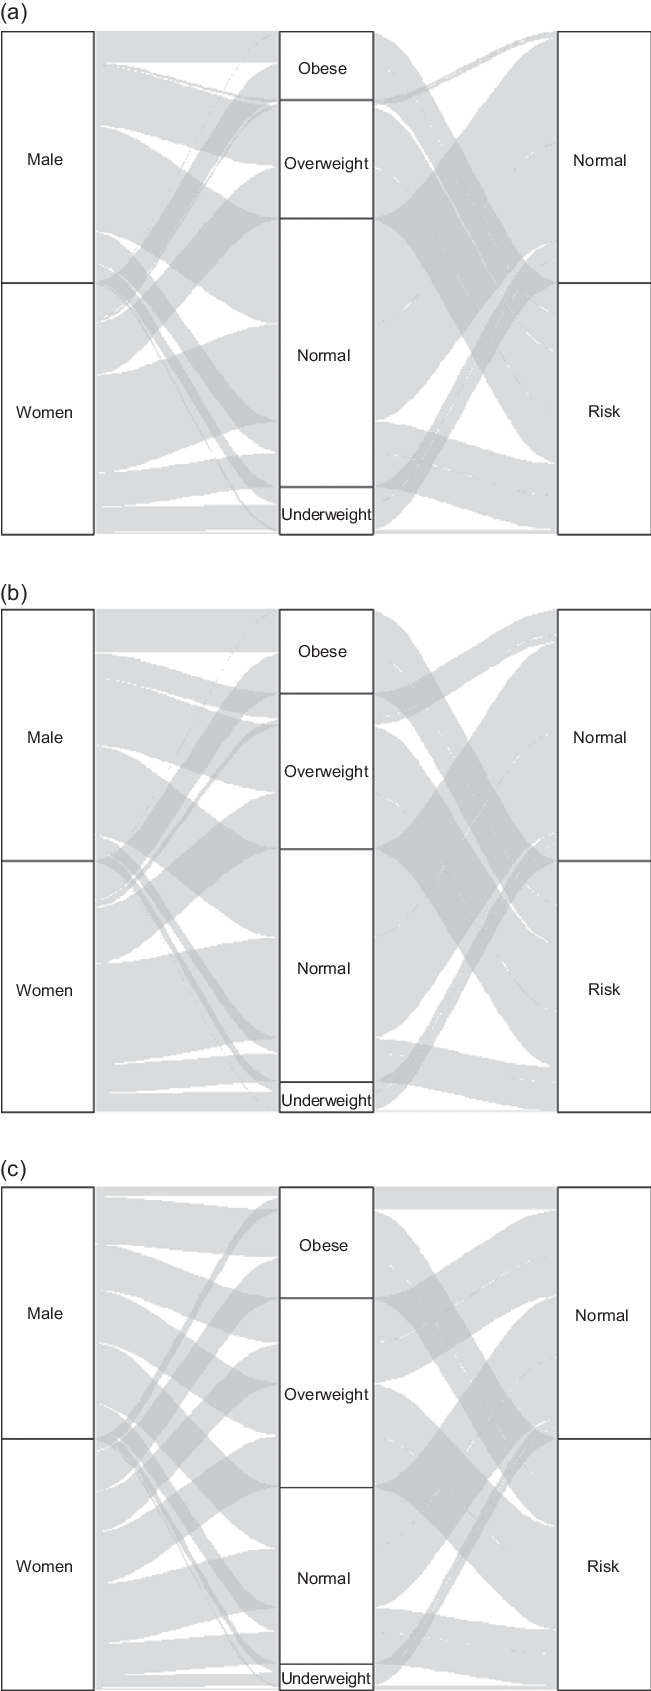
Fig. 1 (a) Comparison of the estimation of risk of BMI against WC. (b) Comparison of the estimation of risk of BMI against WHtR. (c) Comparison of the estimation of risk of BMI against C-index
Accuracy and optimal cut-off points of anthropometric indices to predict hypertension and diabetes
Table 3 shows the cut-off points, S, Sp and AUCs estimates. The most accurate indices for predicting hypertension in males were the WHtR (AUC 0·64) and the C-index (AUC 0·64). In addition, the optimal cut-offs for these measures were 0·57 (YIndex 0·284) and 1·301 (YIndex 0·284), respectively. Likewise, the most accurate indices to predict hypertension were the WHtR (AUC 0·63) and the C-index (AUC 0·61) for women, with the optimal cut-off points for these measures being 0·61 (YIndex 0·236) and 1·323 (YIndex 0·225) (Table 3).
Table 3 Anthropometric indices and hypertension in Peruvian adults, Demographic and Family Health Survey (ENDES) 2018
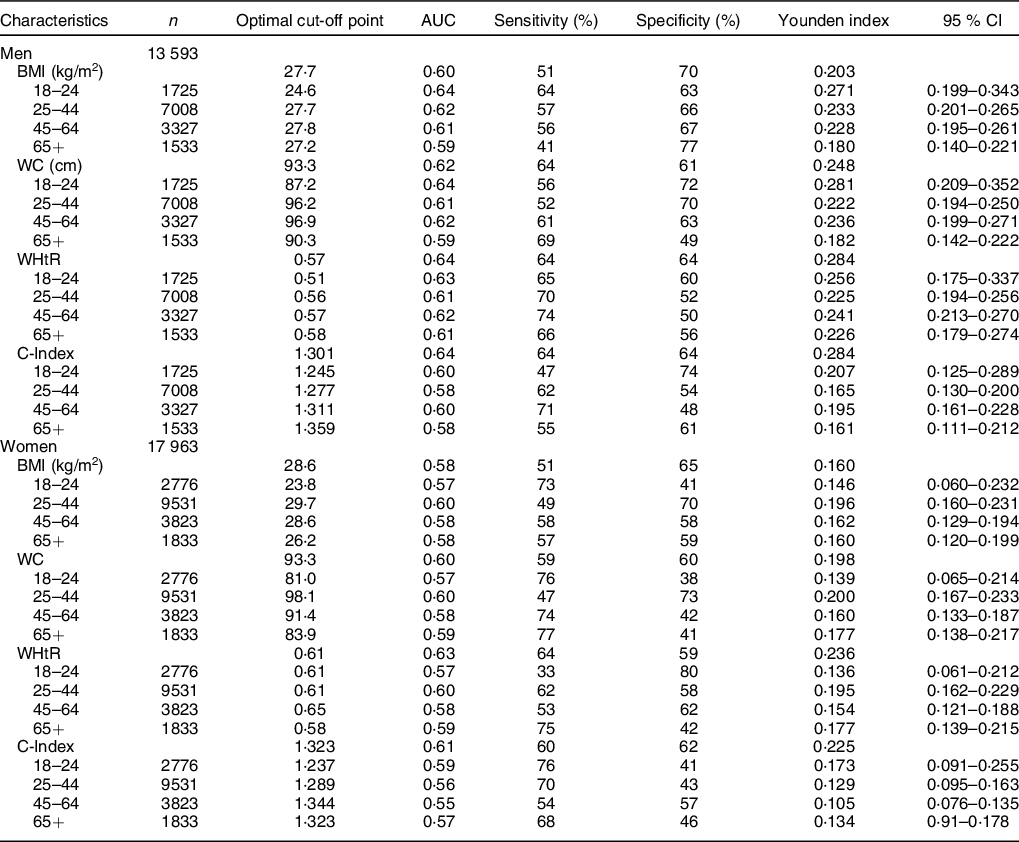
WC, waist circumference; WHtR, waist:height ratio; C-index, conicity index.
For diabetes, the C-index showed the highest accuracy in men (AUC 0·67), with an optimal cut-off of 1·337 (YIndex 0·346), compared with women (AUC 0·66), who had an optimal cut-off of 1·313 (YIndex 0·319) (Table 4).
Table 4 Anthropometric indices and diabetes in Peruvian adults, Demographic and Family Health Survey (ENDES) 2018
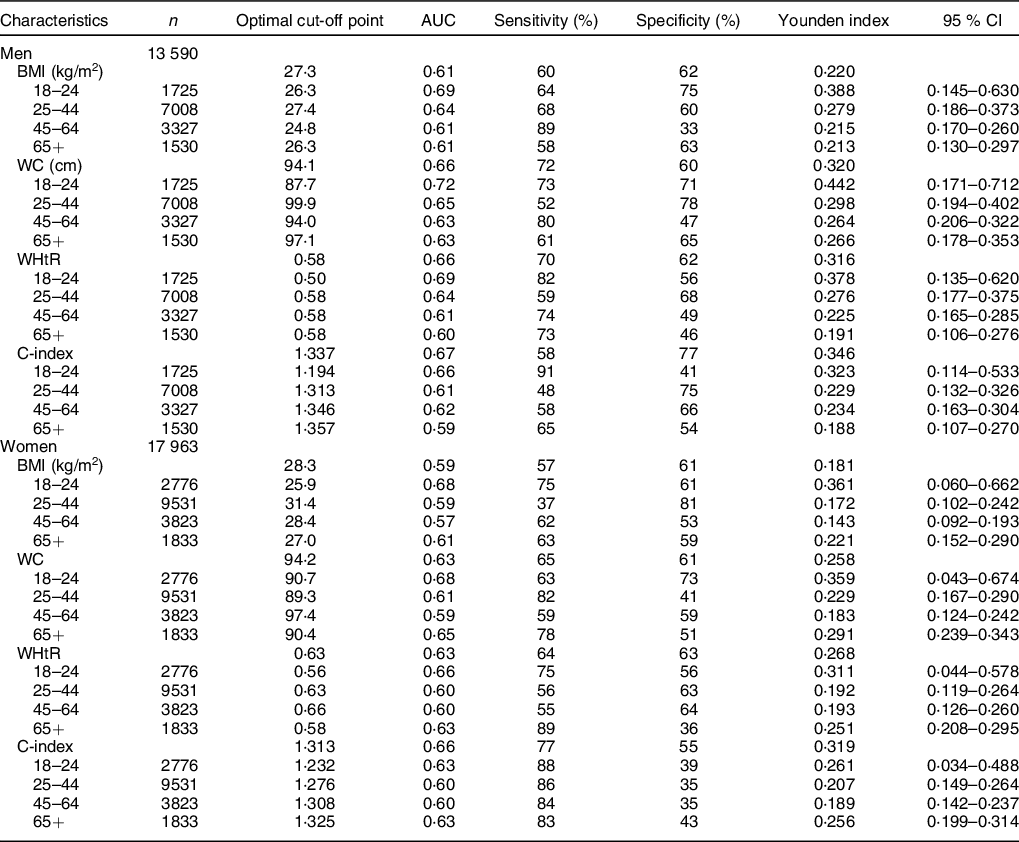
WC, waist circumference; WHtR, waist:height ratio; C-index, conicity index.
Optimal cut-offs of the anthropometric indices by age group
The optimal cut-offs for the WHtR in men to predict the risk of hypertension ranged from 0·51 (AUC –0·63, S 65, Sp 60) in the 18–24-year-old group to 0·58 (AUC 0·61, S 66, Sp 56) in the 65-year-old group. In relation to the C-index, the optimal cut-offs for predicting hypertension ranged from 1·245 (AUC 0·60, S 47, Sp 74) in 18 to 24 years of age group to 1·359 (AUC 0·58, S 55, Sp 61) in the 65-year-old group. In women, the optimal cut-offs of the WHtR ranged from 0·58 (AUC 0·59, S 75, Sp 42) in the 65-year-old group to 0·65 (AUC 0·58, S 53, Sp 62) in the 45–64-year-old group. In addition, the optimal cut-offs for the C-index were 1·237 (AUC 0·59, S 76, Sp 41) for the 18–24-year-old group and 1·344 (AUC 0·55, S 54, Sp 57) for the 45–64-year-old group (Table 3).
The optimal cut-offs of the C-index to predict the risk of diabetes in men ranged from 1·194 (AUC 0·66, S 91, Sp 41) in the 18–24-year-old group to 1·357 (AUC 0·59, S 65, Sp 54) in the 65-year-old group. In women, the optimal cut-offs for the C-index ranged from 1·232 (AUC 0·63, S 87·5, Sp 38·6) in the group of 18–24 years old to 1·325 (AUC 0·63, S 83·13, Sp 42·5) in the 65-year-old group (Table 4).
Discussion
In this study, we estimated the optimal cut-off points for the BMI, the WC, the WHtR, and the C-index in Peruvian men and women for predicting the development of hypertension and diabetes. We found that in Peruvian adults, the WHtR and the C-index have the strongest association with hypertension in both sexes. Likewise, the C-index had the strongest association with diabetes. To our knowledge, this is the first study to estimate optimal anthropometric cut-off points using representative populational data in Peru.
Several systematic reviews and primary studies have reported better performance of the WHtR to predict hypertension and diabetes compared with other anthropometric indicators such as the BMI and WC(Reference Caminha, Ferreira and Costa12,Reference Ashwell, Gunn and Gibson23,Reference Savva, Lamnisos and Kafatos44–Reference Corrêa, Tomasi and Thumé46) . In this regard, it should be specified that both the WHtR and WC better identify abdominal obesity than the BMI(Reference Després, Moorjani and Lupien47,Reference Foster and Pagliassotti48) , but the better predictive capacity of the WHtR over WC could be explained because WC is a simple measure that does not take into account the size and proportions of the individual, assuming that individuals of short stature have the same risk as subjects of tall stature(Reference Han, Sattar and Lean49). Unlike other anthropometric indicators, such as the BMI, the WHR, the WHtR and the C-index, which construct ratios, by incorporating height or another dimensions in their formulas(Reference Ashwell, Gunn and Gibson23,Reference Hsieh and Yoshinaga50) . For this reason, some authors have reported that WC is biased by the height of the individual and that people of short stature with high WC would be more at risk than people with high stature and the same WC(Reference Waterland and Garza51).
In this regard, the WHtR, by incorporating the patient’s height in the formula, overcomes the limitation of assuming the same cut-off point for individuals with different heights and body proportions(Reference Ashwell, Gunn and Gibson23,Reference Waterland and Garza51) . This fact is important in the Peruvian context since a large proportion of the population of this country have a low height, and a measurement taking into account this characteristic would give a better estimation of risk(Reference Asgari, Luo and Akbari25). In addition, an inverse association of height with morbidity and mortality due to CVD has been described(Reference Hsieh and Yoshinaga50), which could be explained by adult height reflecting the nutritional situation in early childhood. Thus, inadequate nutrition during pregnancy and during early life stages ‘programme’ a metabolic imprint that predisposes the individual to obesity, resistance to insulin and other cardiovascular risk factors as well as short stature in adulthood(Reference Ashwell, Gunn and Gibson23,Reference Pitanga and Lessa52) .
Regarding the C-index, our findings may be considered as preliminary, since, to date, no cut-off points to diagnose obesity or risk of metabolic diseases have been defined for this indicator. In our study, we applied the criteria defined by Pitanga et al. in Brazil(Reference Pitanga and Lessa52).
The prevalence of cardiometabolic risk and abdominal obesity estimated by the WHtR, WC and the C-index was very high and has not been reported previously in the Peruvian population. Thus, abdominal obesity calculated with the WHtR was 83 % in males and 92 % in females, while the BMI reported overweight and obesity in 61·3 % and 66 % of males and females, respectively. These differences between indicators indicate that the BMI could underestimate the risk of CVD, because it is an indirect measure of obesity, it does not allow assessment of fat distribution in the body(Reference Pitanga and Lessa52) and is influenced by body proportions, so that subjects with lower height have a higher BMI(Reference Bagust and Walley53,Reference Garn, Leonard and Hawthorne54) .
The prevalence of self-reported diabetes was low in our study (3·5 % in males and 4 % in females); however, a systematic review by Carrillo-Larco et al. reported that the prevalence of diabetes had risen from 5·1 % to 7 % in national and subnational studies(Reference Carrillo-Larco and Bernabé-Ortiz5). This difference may be due to an underestimation of diabetes in undiagnosed subjects in our study, which is not consistent with the growing trend of diabetes in developing countries(Reference Krug55).
The anthropometric indicators that best predicted hypertension in the Peruvian population were the WHtR and the C-index. However, they are the least used by health care personnel, who routinely perform the BMI and WC as recommended by the WHO. Other studies in Brazil agree with the performance of the WHtR found in our study, as it has been reported as the best predictor for hypertension when compared with other indicators such as the WC, WHR, body fat percentage, BMI and C-index(Reference Caminha, Ferreira and Costa12,Reference Dutra, Reis and Martins39) . However, another study in Nigeria reported BMI as the best predictor of hypertension in the study population when compared with metabolic risk indicators(Reference Ononamadu, Ezekwesili and Onyeukwu56). In this regard, it should be taken into account that the average height of the sample in this study was 169·81 cm in men and 162·45 cm in women, which is greater than the Peruvian population, in which the average height was 163·60 cm in men and 151·39 cm in women according to our estimations presented in Table 1. Compared with the Nigerian population, the WC was higher in the Peruvian population for both men (88·37 v. 92·12) and women (90·03 v. 91·56), which suggests a more uniform distribution of body fat in the Nigerian population, making the BMI the best predictor of risk in Nigerians. These results highlight the need for re-evaluation of these indicators in different population groups, as this would allow identification of which indicators best predict the risk of hypertension at clinical and population levels.
The WHtR showed good performance for predicting the risk of hypertension in the Peruvian population as did the C-index for men, being very similar in women. The C-index was also the indicator which best predicted diabetes in men and women in our study. However, as described above, the results of the C-index in our study should be considered with caution, and further studies are needed to validate these findings. In this sense, the use of WHtR would be useful in the clinical and epidemiological setting for the detection of abdominal obesity, since it would substitute the use of two independent risk indicators such as BMI for obesity and WC for hypertension and diabetes. Using a single indicator, which according to our results, has greater precision in detecting cardiovascular risk factors, and by not involving other measurements, it would not generate additional costs for the health system. Likewise, its use would grant greater accuracy than WC for the detection of cardiometabolic risk in the Peruvian population since it incorporates height, considering the great variability of height in our population. In addition, there is a need for further research to investigate the use of the C-index, as although it was the best-performing indicator for predicting the risk of diabetes, it has shown different results in other populations(Reference Ononamadu, Ezekwesili and Onyeukwu56–Reference Wang, He and Chen58).
One of the main limitations of this study was its observational design which does not allow causality to be inferred between anthropometric markers and hypertension/diabetes. Furthermore, we considered the diagnosis of hypertension and diabetes through self-reporting the estimates could be underestimated, although self-reporting of both diseases has shown good accuracy compared with clinical measures(Reference Chun, Kim and Min59). Moreover, the cut-offs for the C-index were taken from a study in Brazil, without being validated in our country, and therefore, the estimates might have been different if other cut-offs had been applied. Likewise, it should be borne in mind that the prediction of disease risk of some anthropometric measures may be inadequate in populations with a low prevalence of the disease, such as young adults. Also, due to the cross-sectional nature of the study, some individuals with hypertension or diabetes might have improved their lifestyle and reduced weight after diagnosis; therefore, some of the anthropometric indices could actually have been similar or lower than healthy participants. In addition, information bias could happen by pollsters who participated in ENDES 2018, although they were trained to reduce the probability of this bias. Despite these limitations, it is worth highlighting the strengths of the study, such as the representativeness of the results with the use of data from the ENDES survey. In addition, this survey has the technical support of the well-recognised Demographic and Health Survey Programme.
The present study is the first to highlight that the WHtR and the C-index are the best predictors for hypertension and diabetes in the Peruvian population, thereby justifying their use in the health system for health personnel training and for population risk assessment and behaviour changing.
The results of this study show that the WHtR and the C-index were the best predictors for hypertension and diabetes in the Peruvian population. However, given the exploratory nature of the C-index, the use of the WHtR is recommended. Optimal cut-off points were also established to identify the risk of hypertension and diabetes, based on sex and age. According to our results, the WHtR may be considered as the principal indicator for the detection of these conditions in clinical and epidemiological fields in our country. In addition, we encourage the adoption of the optimal cut-off points identified in our study.
Acknowledgements
Acknowledgements: The authors are grateful to Elaine Pringle Donna for reviewing the language and style. Financial support: None. Conflict of interest: None. Authorship: A.H.V. and J.P.A. conceived the idea for the study; A.H.V. and RV.F. collected the data and did the statistical analysis; A.H.V., D.A., R.V.F. and J.P.A. drafted the manuscript; all authors contributed to the interpretation of data, writing and preparation of the manuscript. R.M.C.H. did the technical editing of the manuscript. All authors critically reviewed and approved the final manuscript. Ethics of human subject participation: The study has not required the approval of an ethics committee because it is an analysis of aggregated secondary data that is in the public domain (http://iinei.inei.gob.pe/microdatos/) and does not identify any participants.


