


Adequate nutrition during the first 2 years of life is important to ensure optimal physical and mental development of infants and young children. In order to meet adequate nutrition during this period, complementary food with high energy and nutrient density should be provided, as young children have limited gastric capacity( Reference Brown, Dewey and Allen 1 ). The World Health Organization/United Nations International Children’s Emergency Fund( 2 ) have urged all countries to promote improved complementary feeding practices to ensure optimal health, growth and development of young children. In Indonesia, however, there are still poor complementary feeding practices as characterised by inadequate nutrient density( Reference Fahmida, Kolopaking and Santika 3 ).
Food-based strategies are most sustainable in the long-term, as compared with the other alternatives such as micronutrient supplements and fortified and processed complementary foods alone, especially if incorporating behavioural and environmental factors. Complementary feeding recommendations (CFR), which promote culturally acceptable and affordable changes to local complementary feeding practices and also include local nutrient-dense foods, including low-cost fortified products( Reference Dibari, Diop and Collins 4 , Reference Soekarjo and Zehner 5 ), will enhance chances for sustainable improvements in the nutritional status of children under 2 years of age.
The importance of consuming nutrient-dense foods has been supported by our previous studies on optimisation of local complementary foods using a procedure called linear/goal programming (LP). The studies found that, with the current income level and the feasible portion size consumed by the young children, even when the diet is optimised, it is difficult to achieve adequate Fe, Zn and Ca intakes, that is, the ‘problem nutrients’( Reference Santika, Fahmida and Ferguson 6 , Reference Harper 7 ). Other analyses, involving cost-to-nutritional benefit (i.e. nutrient adequacy), suggest that the use of fortified foods (in urban settings) and mixed dishes comprising nutrient-dense foods (in rural settings) is a potential approach to improve nutrient adequacy, especially for these three problem nutrients( Reference Fahmida, Santika and Harper 8 ). Local CFR that include nutrient-dense foods (locally available fortified foods, recipes using nutrient-dense foods) should therefore enhance practise of the CFR. As household socio-economic situation (SES) has an influence on food expenditure and access to nutrient-dense foods, assessment of food pattern, food list and finally the local CFR in the different socio-economic levels will provide recommendations and solutions that are more suitable for different SES groups.
The aims of this study were to develop and compare CFR for children aged 12–23 months in lower and middle socio-economic classes of an urban area in Indonesia and to evaluate the contribution of fortified foods to meet the nutrient requirements.
Methods
Study design and population under study
The present study was a cross-sectional survey to obtain indicators required to develop the CFR (input variables) as well as other indicators relevant to child feeding care. The population under study included children aged 12–23 months who lived in three sub-districts in Kota Bandung district (Bandung Kulon, Kiara Condong, Regol) West Java, Indonesia. These sub-districts were selected on the basis of population density and socio-economic profiles. Exclusion criteria for subjects were sickness/illness on the day of weighed diet record measurement (which influenced the child’s appetite) and severely wasted children (weight-for-age Z-score<−3·00).
Sample size and sampling procedure
The sample size (n 114/group) was calculated on the basis of expected prevalence of inadequate intake in the three problem nutrients (Ca, Fe, Zn) based on a previous study in a peri-urban area in Bogor, West Java, with 10 % absolute precision, 95 % power and 10 % allowance for non-response rate( Reference Santika, Fahmida and Ferguson 6 ). In the selected sub-district, two to four villages/Kelurahan – or minimally 15 % of the number of villages in the Kelurahan sub-district – were randomly selected, and all children aged 12–23 months in these villages were listed as the sampling frame. The households in the sampling frame were first visited to assess the SES category they belonged to on the basis of monthly household expenditure categories, that is, A, B, C1, C2, D, E (The Nielsen Company Indonesia, 2010). The households were then classified into three SES strata of high (A and B), medium (C1 and C2) and Low (D), and finally simple random sampling was used to select 114 respondents per SES group for the study. This report is confined to analysing the middle (MSES) and the low (LSES) socio-economic groups.
Data collection
Household socio-economic conditions, mother’s nutrition knowledge and feeding practices were assessed using structured interview. Children’s dietary intakes were assessed using 1-d weighed diet records, 1-d 24-h dietary recall and 5-d food tally, as reported earlier( Reference Santika, Fahmida and Ferguson 6 ), which altogether provided data on food pattern, that is, 7-d or weekly frequency of food consumption. Food portion was based on weighed portion for those who consumed the food. Dietary intake data were entered into Nutrisurvey software (www.nutrisurvey.de) for conversion into nutrient data using Indonesian Food Composition Tables. A market survey was carried out in representative markets in the study area to determine the cost of foods consumed per 100 g edible portion. For cooked foods, raw ingredients were purchased from the markets and cooked to obtain cost per edible portion of cooked food, similar to the portion measured in the survey.
Linear/goal programming: data input preparation and analysis
LP analyses from Optifood were used to (1) check model parameters, that is, food items, food portions and food patterns (module I analyses); (2) formulate the nutritionally ‘best diet’ for each target group, given local food availability, food pattern and food affordability (module II analyses); (3) evaluate nutrient adequacy and identify absolute or partial ‘problem nutrients’ by minimising and maximising the nutrient content of modelled diets for each nutrient (module III analyses); and (4) identify locally available nutrient-dense foods including fortified products to fill the nutrient gap and compare among alternatives of CFR, based on the comparative cost and nutritional benefits after successful adoption of each of the intervention foods (module III analyses)( Reference Ferguson, Darmon and Fahmida 9 , Reference Daelmans, Ferguson and Lutter 10 ).
The nutrient goals, that is, percentage of recommended nutrient intakes (RNI) fulfilment (module II analyses) and dietary adequacy (module III analyses), were defined using the Food and Agriculture Organization/World Health Organization RNI( 11 , 12 ). Moderate bioavailability was assumed for Zn, and 10 % absorption was assumed for Fe. Energy and protein requirements used in the model were calculated on the basis of the FAO equation, that is, energy (kJ/d (kcal/d))=82·5×body weight (kg) and protein (g/d)=1·03×body weight (kg) with mean body weight of 12 kg. A fixed quantity of breast milk (532 g/d) was included, which was derived from the difference between the estimated average energy requirements of the study subjects (3535 kJ/d (845 kcal/d))( 13 ) and the observed mean energy intakes from complementary foods among the subjects in this study (2180 kJ/d (521 kcal/d)), and by assuming breast milk energy density of 2·5 kJ/g (0·6 kcal/g)( Reference Dewey and Brown 14 ).
The Excel programme was used to calculate the minimum, average and maximum (10th, 50th, 90th percentiles, respectively) weekly food frequency of each food item, food sub-group and food group. Food sub-groups and food groups were categorised on the basis of the grouping in Optifood. The median portion for children who consumed the food was used as the standard portion size for each food.
In total, two best diets were modelled using LP: (1) best diet with food pattern goal (FP), the most optimal diet that conformed as closely as possible to the food pattern (i.e. median weekly frequency of each food item, food sub-group and food group), and (2) best diet with no food pattern goal (No FP), the most optimal diet that allowed more flexibility to the food pattern (i.e. may deviate from median weekly frequency of each food item, food sub-group and food group but remains within the minimum–maximum range of its weekly frequency). The No-FP best diet is therefore more likely to achieve higher %RNI than the FP best diet.
Problem nutrients were categorised in two ways: (1) partial problem nutrient, a nutrient that is <100 % of its RNI among the two best diets but exceeds 100 % of its RNI in the diet with the highest levels achievable for that nutrient (best-case scenario); thus, for a partial problem nutrient, the requirement can be achieved using local foods but at the cost of achievement of at least one other nutrient requirement; and (2) absolute problem nutrient, a nutrient with fulfilment<100 % RNI in the two best diets and in the best-case scenario; thus, this nutrient requirement cannot be achieved using the existing food pattern. To assess the contribution of fortified foods, in this study, we reported LP analyses with and without fortified foods in the study area. The final CFR selected was the one in which the worst-case scenario nutrient intakes were ≥65 % of their RNI (value closest to the estimated average requirement) for as many nutrients as possible.
The present study was conducted after receiving an approval from the Ethics Committee of the Faculty of Medicine, University of Indonesia (no. 59/PT02.FK/Etik/2011). Permission was obtained from the local authority, district health offices and Puskesmas at the respected sub-district. Subjects or care givers of subjects were assessed only after they gave their informed consent. Participation of the subjects in the study was voluntary. All data were treated confidentially and were used only for study purposes.
Results
There were significant differences between SES groups in terms of parental level of schooling and father’s occupation. More fathers and mothers in the LSES group had only primary education (fathers: 18·6 v. 3·6 %; mothers: 19·3 v. 2·6 %, in LSES and MSES, respectively). Most fathers in the LSES group worked as labourers (34·5 %), whereas most of them in the MSES group worked as a private employees (42·9 %). SES groups were comparable in terms of mother’s occupation (71·6 % housewives), child’s age (median 18·3 months) and sex (53·2 % boys).
The medians of daily per capita food expenditure were Indonesian Rupiah (IDR) 3300 (25th–75th percentiles 2000–6100) in LSES and IDR 5000 (25th–75th percentiles 2500–6700) in MSES (P<0·05). The weekly food pattern frequency of children in MSES was characterised by more frequent intake of plant and animal proteins and sweetened snacks and desserts (higher median frequency/week), as well as fruits and milk products (higher upper frequency/week). On the other hand, grains and grain products were more frequently consumed by children in the LSES group, Table 1. In line with this food pattern difference, when the best diets between LSES and MSES were compared, more frequent consumption of plant proteins (legumes, nuts and seeds), animal proteins (meat, fish or egg products), fruits and bakery products – which included fortified biscuits – was observed in the MSES group, given their higher intake in the survey data. In addition, the number of staples that indicated the number of main meals could be as low as 14 times/week (<3 times/d) in the LSES (Table 2).
Table 1 Food pattern (times/week) of food groups, by socio-economic levels
LSES, low socio-economic situation; MSES, middle socio-economic situation; Min, minimum weekly frequency (5th percentile); Me, median weekly frequency (50th percentile); Max, maximum weekly frequency (95th percentile).
Table 2 Comparison of the food patterns (frequency/week) in the two best diets with fortified foods, with food pattern goal (FP) and with no food pattern goal (No FP), by socio-economic levels
LSES, low socio-economic situation; MSES, middle socio-economic situation.
Table 3 shows the percentage RNI fulfilment from the two best diets. The problem nutrients in the CFR (‘with fortified foods’ models) were thiamin in the LSES group and thiamin and folate in the MSES group. Table 4 shows the maximised %RNI achievement for each nutrient. The problem nutrients that maximised %RNI achievement remained <100 % – thiamin and folate – in the MSES groups, and therefore these were regarded as absolute problem nutrients. Surprisingly, no absolute problem nutrient was found in LSES, and thiamin was only a partial problem nutrient in the LSES group. When fortified foods were excluded, more problem nutrients were identified in LSES (i.e. best-case scenario <100 %RNI), namely (in the order of severity), Fe, thiamin, Zn, niacin and Ca (Fig. 1). The model without fortified foods cannot be generated with LP analysis for the MSES given the unfeasible goal model energy. As the MSES group consumed more fortified foods, excluding fortified foods caused most of the micronutrient-dense food to be removed from their food basket and a feasible solution could not be reached.
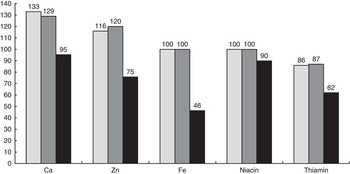
Fig. 1 Percentage recommended nutrient intakes in the best diet with no food pattern goal, by socio-economic levels and inclusion of fortified foods (FF). The model without fortified foods cannot be generated with linear programming analysis for the middle socio-economic situation (MSES) given unfeasible goal model energy. ![]() , MSES with FF;
, MSES with FF; ![]() , low socio-economic situation (LSES) with FF;
, low socio-economic situation (LSES) with FF; ![]() , LSES without FF.
, LSES without FF.
Table 3 Percentage recommended nutrient intakes achievable with the two best diets with fortified foods, with food pattern goal (FP) and with no food pattern goal (no FP), by socio-economic levels
LSES, low socio-economic situation; MSES, middle socio-economic situation; N/A, not analysed; RA, retinol equivalent; RAE, retinol activity equivalent.
* Problem nutrients, that is, nutrient which does not meet 100 % in No-FP diets.
Table 4 Worst (minimised) and best (maximised) case scenario percentage recommended nutrient intakes (RNI) of each nutrient in the complementary feeding recommendations with fortified foods, by socio-economic levels
LSES, low socio-economic situation; MSES, middle socio-economic situation; Min, minimum; Max, maximum; RE, retinol equivalent; RAE, retinol activity equivalent.
* Problem nutrients, that is, nutrient that does not meet 100 % in at least one of the two best diets.
† Partial problem nutrient (<100 %RNI in two best diets, Table 3, but ≥100 % in maximised RNI).
‡ Absolute problem nutrient (<100 %RNI in two best diets and <100 % in maximised RNI).
To identify and select nutrient-dense foods that had the potential to increase intake of the problem nutrients, (1) the best food sources, that is, foods that provided >5 % of any micronutrient in the best diet No FP, were identified; and (2) the number of nutrients for which each of those foods provided >5 % of any nutrient was tallied, with special attention given to its contribution in terms of the problem nutrients. Milk products, fortified biscuits and manufactured infant cereals were the most locally available fortified products in the market. Powder and liquid milk had the most brands/types that were fortified (forty-six brands), followed by biscuits, crackers and wafers (thirty-three brands), drinks (thirteen brands), baby cereals (ten brands), noodles (nine brands), chips (seven brands), cakes (four brands) and condensed milk (four brands). The fortified foods (portion sizes) commonly consumed by the children were liquid milk (130 g), manufactured infant cereal (32 g), powder milk (22 g), biscuits (8 g) and baby biscuits or rusk (5 g).
Fortified foods and other nutrient-dense foods that contributed >5 % of the nutrient intake, for each of the ‘with fortified foods’ and ‘without fortified foods’ LP models, were banana, chicken liver, mungbean, papaya, tempe, tofu and several fortified foods including fortified biscuits, manufactured infant cereals, fermented milk, follow-on milk and ultra-high temperature-treated milk. These nutrient-dense foods were tested individually as well as in combination in alternative CFR (Table 5). The selected CFR (Table 6) was that in which as many nutrients as possible achieved at least 65 % of RNI. The best alternative combination of CFR for LSES was alternative CFR no. 23, specifying mungbean, chicken liver, fortified biscuits and tempe in which eight out of eleven nutrients had %RNI ≥65 % in their worst-case scenario with the cost of IDR 6157; three nutrients that remained inadequate (worst-case scenario <65 %RNI) were thiamin, niacin and Fe. For the MSES, the best alternative was alternative no. 13 specifying fortified biscuits, chicken liver, banana and mungbean, which also met adequacy for eight out of eleven nutrients with the cost of IDR 9634. Vitamin C, thiamin, folate and Fe were still inadequate (worst-case scenario <65 %RNI) in this best alternative combinations of MSES, despite the cost, which was 1·5 times higher than LSES.
Table 5 Percentage recommended nutrient intakes (RNI) and diet cost for the optimised diet, the best and worst-case scenario results and the worst-case scenario results of alternative complementary feeding recommendations

RE, retinol equivalent; IDR, Indonesian Rupiah; LSES, low socio-economic situation; FP, food pattern goal; MSES, middle socio-economic situation.
* Nutrients that in the worst-case scenario met at least 65 % of RNI; therefore, their adequacy was ensured.
† Final selected complementary feeding recommendation.
Table 6 Draft complementary feeding recommendations for low socio-economic situation (LSES) and middle socio-economic situation (MSES) groups

* Fermented soyabean cake.
Discussion
Our study explored the contribution of fortified foods in meeting nutrient requirements of children under 2 years of age from different socio-economic status backgrounds. The findings showed a difference in dietary patterns between LSES and MSES; however, nutrient adequacy and problem nutrients were comparable, as fortified foods contributed to adequacy of nutrients with complementary feeding in LSES groups. Exclusion of fortified foods in LSES was associated with more problem nutrients in the complementary feeding diet.
Fe, Zn and Ca have been found to be typical problem nutrients in complementary feeding in developing countries( Reference Santika, Fahmida and Ferguson 6 , Reference Skau, Bunthang and Chamnan 15 ). However, with LP, we showed that it is possible to meet adequacy of these nutrients. This applies even for Fe, which is often the most inadequate nutrient in complementary feeding( Reference Vossenaar and Solomons 16 ). On the other hand, we found that LP can also help identify other problem nutrient(s) besides Fe, Zn and Ca. In the MSES group, we found that folate was a problem nutrient, which was not found in our previous study in a peri-urban lower-SES area in Indonesia( Reference Santika, Fahmida and Ferguson 6 ) but is similar to the finding among Cambodian 6–11-month-old infants( Reference Skau, Bunthang and Chamnan 15 ).
The fact that Fe, Zn and Ca were not identified as problem nutrients, even in the LSES group, was attributable to the contribution of fortified foods in the complementary feeding diet of this urban population. When fortified foods were excluded from the diet of the LSES group, the nutrients that were compensated were Fe, thiamin, Zn, niacin and Ca. These findings suggest that for the LSES, given their existing food pattern, fortified foods were important to meet the adequacy of Ca, Fe, Zn and niacin. The older age of the children may have also contributed to this, due to more varied foods and bigger portion sizes. Using national dietary data of Indonesia, we have shown previously that Fe, Zn, Ca and niacin, which were the problem nutrients found in younger age groups, were no longer problem nutrients among the 12–23 months age group( Reference Fahmida, Santika and Kolopaking 17 ). Fortified milk and fortified biscuits were the most available fortified foods in the study area. National data showed that fortified milk was consumed by 30 % (rural) and 40 % (urban) of 6–59-month-old children; whereas our study on infants showed that 20–44 % of infants consumed fortified biscuits( Reference Fahmida 18 ). Both fortified milk and biscuits are commonly fortified with Fe and this supports the WHO recommendation to feed 6–23-month-old children Fe-rich or Fe-fortified foods. This strategy has been proven effective, where consumption of fortified milk and noodles among 6–59-month-old children in Indonesia was associated with lowered risk of anaemia( Reference Semba, Moench-Pfanner and Sun 19 ).
Our results also suggest that, under the existing dietary pattern for children, recommended intakes of the absolute problem nutrients will not be achieved unless there is change in the dietary pattern of the children to improve thiamin (in both SES groups) and folate (in MSES group) intakes. In the MSES group, promotion of fruit and vegetable intakes as source of folate should be one of the messages, as well as other strategies, including increasing level of thiamin in the fortified products, given the limited portion sizes that can be consumed per day by these 12–23-month-old children( Reference Fahmida 20 ). The optimised CFR resulting from this LP analysis identified similar messages in general for both SES groups, but also specific messages for each SES pertaining to the problem nutrients in each group. For the LSES Fe-rich foods (e.g. chicken liver) and for the MSES folate-rich foods (e.g. mungbean) should be specifically highlighted in the final message. The draft final CFR obtained from the LP analysis should be pre-tested for its acceptability in the community, for instance, following Trials for Improved Practices (TIPS) Guideline ( 21 ).
In this study, the LP model without fortified foods could not be run for the MSES group, as goal model energy could not be met. This suggests that fortified foods contributed significantly to energy intake in children from the MSES group. A survey on different socio-economic levels in this area showed that fortified foods contributed 24 and 33 % of daily energy in lower and middle SES groups, respectively( Reference Santika, Februhartanty and Ariawan 22 ). An LP model could be produced for both LSES and MSES groups when we ran the LP model excluding only fortified milk, as the most commonly available fortified foods in the study area (data not shown). The result showed that, without fortified milk, niacin was a problem nutrient in this MSES group, whereas in LSES niacin, Ca and Fe became the problem nutrients. Zn was the only nutrient in LSES that became a problem nutrient when other fortified foods, besides fortified milk, were excluded. A previous study showed that, in older breast-fed infants, Zn requirements are unlikely to be met without the regular consumption of either meat or Zn-fortified foods( Reference Krebs, Westcott and Culbertson 23 ). In LSES, where meat, especially red meat, consumption, is low, Zn-fortified foods have an important role in contributing to Zn adequacy. In our study, the selected alternative CFR, which included daily consumption of fortified snacks, were associated with lower cost, that is, by 36 % in LSES and by 13 % in MSES.
In summary, we showed using LP that, in this study population, fortified foods contributed to meeting adequacy of typical problem nutrients (Fe, niacin, Zn, Ca), as well as thiamin in LSES group. Inclusion of fortified foods in CFR was associated with fewer problem nutrients in the diets of LSES groups. Our study demonstrated the usefulness of LP to formulate CFR and to assess the role of fortified foods in two urban populations, of different socio-economic status, in Indonesia. The implication of this finding on infant and young child feeding policy is that, for children from lower socio-economic urban families, fortification is important to fill the gap of problem nutrients in their complementary feeding diet.
Acknowledgements
The authors thank the children, the mothers, families, voluntary health workers and local government of Bandung city, West Java province, for their cooperation and participation. We thank Ratna Wulanti for her assistance with data collection and LP input preparation.
This work was supported by PT Sarihusada Generasi Mahardhika and PT Nutricia Indonesia Sejahtera. The sponsors had no involvement in the study design, data collection, analysis and interpretation of data, as well as in the writing of the manuscript and in the decision to submit it for publication.
The authors’ responsibilities were as follow – U. F. and O. S.: conceptualised the study, supervised data collection and conducted LP and statistical analyses; U. F.: wrote the first draft of the manuscript. All the authors edited the manuscript and approved the final version.
The authors declare that there are no conflicts of interest.


