


Functional disability, defined as ‘limitation in performance of socially defined roles and tasks within a sociocultural and physical environment’(Reference Guralnik and Ferrucci1), is a major public health issue receiving growing attention. In America, the percentage of older adults with disability ranged from 25·4 % of adults aged 65–74 years to 49·8 % of adults aged 75 years and over in 2015(Reference Erickson, Lee and von Schrader2). Functional disability contributes to several adverse health outcomes such as hospitalisations(Reference Fried, Bradley and Williams3) and death(Reference Lyyra, Leskinen and Heikkinen4) and also increases the health burden(Reference McGrath, Al Snih and Markides5) and cost of health care systems(Reference Fried, Bradley and Williams3). Thus, exploring the potential factors that influence functional disability is essential to increase life expectancy of older adults and achieve healthy ageing.
Previous epidemiological literature has examined the effects of dietary factors on functional disability, such as dairy consumption(Reference Kim and Lee6,Reference Yoshida, Ohara and Hata7) , fruit and vegetables(Reference Ribeiro, Morley and Malmstrom8). Healthy dietary patterns could contribute to prevention or delay of functional disability(Reference Parsons, Papachristou and Atkins9). Coffee, as one of the most popular consumed beverages worldwide, is considered as part of a healthy diet(Reference Grosso, Godos and Galvano10) due to its numerous underlying benefits to reduce the risk of type 2 diabetes(Reference Mirmiran, Carlstrom and Bahadoran11), CVD(Reference Rodriguez-Artalejo and Lopez-Garcia12), sarcopenia(Reference Dirks-Naylor13), falls(Reference Machado-Fragua, Struijk and Ballesteros14) and mortality(Reference Ding, Satija and Bhupathiraju15), which predispose individuals to functional disability. However, few studies have investigated the association between coffee consumption and functional disability. To our knowledge, only a cohort study has investigated the association in older Spanish adults and found the protective association between coffee consumption and functional impairment just among women, hypertensive, diabetic and obese patients(Reference Machado-Fragua, Struijk and Graciani16).
Therefore, we conducted a cross-sectional study using a large population-based sample derived from the National Health and Nutrition Examination Survey (NHANES) (2007–2016) to estimate the association between coffee consumption and functional disability in older American adults.
Methods
Study sample
NHANES is an ongoing biennial cross-sectional survey of the non-institutionalised, civilian US population. Based on the complex stratified multistage probability sampling design, NHANES collected demographic, socio-economic, health and nutritional data on approximately 5000 participants every 2 years. Participants completed health interviews at home and then performed the health examination at mobile examination centres that included medical, dental and physiological measurements. Details about survey design and data collection procedures were available elsewhere(17). The Centers for Disease Control and Prevention National Center for Health Statistics institutional review board approved the NHANES, and all participants provided written informed consent.
Data from NHANES 2007–2016 were combined for the present study, including 50 588 participants. The study sample was restricted to adults aged ≥60 years (n 9760). About 2053 participants who had ineligible dietary recall status including ‘not reliable or not met the minimum criteria’ and ‘not done’ were excluded. After excluding the three participants with incomplete functional disability data, 7704 individuals were included in this study (Fig. 1).
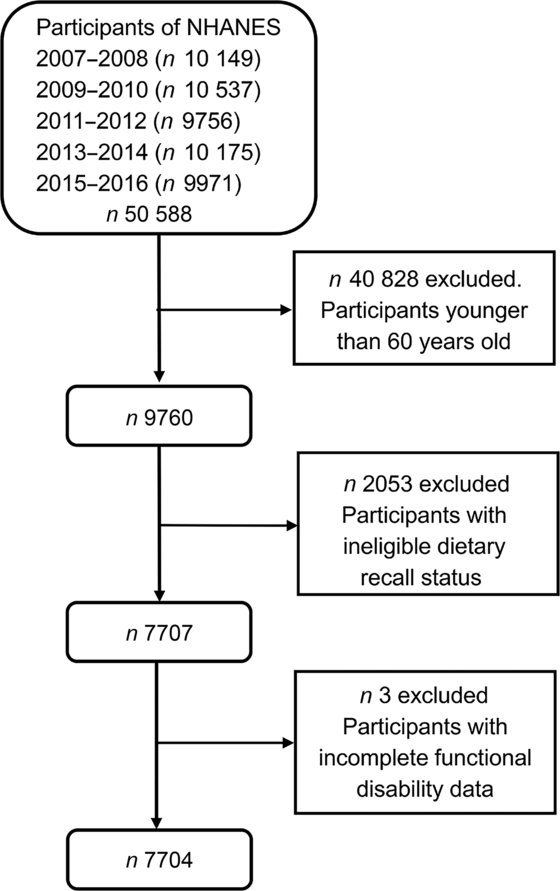
Fig. 1. Study participant flow. NHANES, National Health and Nutrition Examination Survey.
Study variables
Functional disability
In NHANES, five domains of functional disability(Reference Chen and Guo18), including lower extremity mobility (LEM), general physical activity (GPA), leisure and social activities (LSA), activities of daily living (ADL) and instrumental activities of daily living (IADL), were evaluated by asking participants about their ability to perform nineteen routine tasks in the Physical Functioning Questionnaire without special equipment (online Supplementary Table S1). Participants were provided five options: ‘no difficulty’, ‘some difficulty’, ‘much difficulty’, ‘unable to do’ or ‘don’t do this activity’. For each domain, disability status was defined as having any difficulty in performing one or more activities within a given domain(Reference Kalyani, Saudek and Brancati19,Reference Egede20) .
Coffee consumption
The dietary interview component of NHANES was conducted as a partnership between the US Department of Agriculture and the US Department of Health and Human Services. All participants were eligible for two 24-h dietary recalls administered by trained interviewers. The first recall was collected in person through mobile examination centres, and the second one was collected via telephone 3–10 d later. The food intake data, which were collected and processed by the automated methods described elsewhere(Reference Raper, Perloff and Ingwersen21), were used to measure the type and quantity of consumed food and beverages as well as the daily total consumption of nutrients, energy and other components from those food and beverages.
Caffeinated and decaffeinated coffee consumption was assessed according to the food code, and total coffee consumption was the sum of those two. Caffeine consumption was estimated from the intake of all caffeine-containing foods and beverages. As the high agreement of two dietary recalls (interclass correlation coefficient 0·71 for total coffee, 0·71 for caffeinated coffee, 0·65 for decaffeinated coffee and 0·67 for caffeine, P < 0·001), we chose the average coffee intake of two dietary recalls for our main analysis. In order to visualise the coffee consumption, total, caffeinated and decaffeinated coffee consumption (in g) was divided by one cup size (10 oz or 283·5 ml)(Reference Xiao, Sinha and Graubard22) and classified into four groups: none, <1 cup/d, 1 to <2 cup/d and ≥2 cup/d. Caffeine intake was divided into quartile.
Other variables
Covariates recorded in this study included age, sex (male and female), race and ethnicity, marital status (‘single’ and ‘married’), educational level, annual household income, BMI, physical activity, cigarette smoking, alcohol drinking, energy intake, tea intake, soft drink intake, depression, hypertension, diabetes, arthritis, gout, stroke and cancer. Race and ethnicity were self-reported and allocated into five categories: Mexican American, other Hispanic, non-Hispanic White, non-Hispanic Black and another race. Education was grouped as ‘below high school’, ‘high school’ and ‘above high school’. Annual household income was categorised as ‘<$20 000’, ‘$20 000 to <$45 000’, ‘$45 000 to <$75 000’ and ‘≥$75 000’. BMI was grouped into four categories: underweight (<18·5 kg/m2), normal (18·5–24·9 kg/m2), overweight (25–29·9 kg/m2) and obesity (≥30 kg/m2). Energy intake, tea intake and soft drink intake were calculated based on the two 24-h dietary recalls. Based on the Global Physical Activity Questionnaire(Reference Armstrong and Bull23), physical activity was calculated and classified as ‘none’, ‘not meeting WHO recommendations’ and ‘meet WHO recommendations’. Cigarette smoking was categorised as ‘never’, ‘former’ and ‘current’. Alcohol drinking was defined as ‘none’, ‘light’, ‘moderate’ and ‘heavy’(Reference Gay, Tran and Paquette24). Depressive symptom was assessed by using the Patient Health Questionnaire(Reference Zhang, Jackson and Merritt25). Hypertension, diabetes, arthritis, gout, stroke and cancer were dichotomised as ‘yes’ or ‘no’ based on answers of the question ‘Has a doctor ever diagnosed you with “this problem”?’
Statistical analysis
Participants’ characteristics were presented as numbers and percentages for categorical variables and mean values and standard deviations for continuous variables according to total coffee consumption groups. The χ 2 test or ANOVA was used to determine descriptive statistics differences across groups. Age-adjusted and multivariate-adjusted binary logistic regression models were used to explore the associations of total, caffeinated, decaffeinated coffee and caffeine consumption with each functional disability’s domain. Linear trend across categories of coffee consumption was evaluated by Stata’s ‘contrast’ command assigning orthogonal polynomial coefficients(Reference Brighthaupt, Schneider and Johnson26,Reference Frenk, Kit and Lukacs27) . Moreover, the multivariable-adjusted models were repeated with strata of sex. After 1 % abnormal values before and after were rejected, non-drinkers occupied 28·0 %; thus, we used restricted cubic spline analyses with three knots located at the 30th, 50th and 70th percentiles of the exposure distribution to assess dose–response relationships between total coffee consumption and functional disability. The multivariate-adjusted and restricted cubic spline models were adjusted for these potential confounders: age, sex, race and ethnicity, marital status, educational level, annual household income, BMI, physical activity, cigarette smoking, alcohol drinking, energy intake, tea intake, soft drink intake, depression, hypertension, diabetes, arthritis, gout, stroke and cancer. When caffeinated coffee was tested, decaffeinated coffee was adjusted as covariates and vice versa.
Considering that diseases might influence the association between coffee consumption and functional disability and adjusting them as covariates might not completely remove residual confounding, we conducted the sensitivity analyses after excluding participants with CVD and cancer.
All analyses were accounted for the complex survey design of NHANES conducted on Stata version 15 (StataCorp LP). NHANES 10-year sampling weights, primary sampling unit and strata information were used to obtain unbiased, nationally representative estimation. Statistical significance was defined as two-sided P values ≤0·05.
Results
After filtering, 7704 participants aged 60 years and above were eligible for this study (Fig. 1). Total, caffeinated and decaffeinated coffee consumption weighted mean and standard deviations were 1·35 (sd 1·46) cups/d, 1·10 (sd 1·41) cups/d and 0·25 (sd 0·70) cups/d, respectively. Online Supplementary Table S2 summarises the characteristics according to the categories of total coffee consumption.
Table 1 shows the weighted OR (95 % CI) of each functional disability’s domain according to categories of total coffee consumption. In the age-adjusted models, higher total coffee consumption was associated with decreased odds of all domains of functional disability. After adjusting the multivariate confounders, the lower odds of LEM disability were observed among total coffee drinkers of 0 to <1 cups/d (OR 0·74, 95 % CI 0·57, 0·96) and ≥2 cups/d (OR 0·67, 95 % CI 0·50, 0·91) with respect to non-coffee drinkers (P trend = 0·03). Compared with non-drinkers of total coffee, those who consumed 2 cups or more per d had OR of 0·65 (95 % CI 0·47, 0·88) and 0·61 (95 % CI 0·45, 0·83) for disability of GPA (P trend = 0·02) and LSA (P trend = 0·006), respectively. And the intakes of 1 to <2cups and ≥2 cups of coffee/d were linked to reduced odds of IADL disability (OR1 to <2cups/d 0·72, 95 % CI 0·54, 0·95; OR≥2 cups/d: 0·59, 95 % CI 0·44, 0·78, P trend = 0·001). Although total coffee drinkers ≥2 cups/d were also inversely associated with lower odds of reporting ADL disability (OR 0·70), the CI (0·50, 1·01) was wide as a result of the small number of participants.
Table 1. Age- and multivariate*-adjusted associations between categories of total coffee intake and functional disability, National Health and Nutrition Examination Survey (NHANES) (2007–2016)
(Numbers and percentages; weighted odds ratios and 95 % confidence intervals)

LEM, lower extremity mobility; Ref., reference; GPA, general physical activity; LSA, leisure and social activities; ADL, activities of daily living; IADL, instrumental activities of daily living.
* Adjusted for age, sex, race and ethnicity, marital status, educational level, annual household income, BMI, physical activity, cigarette smoking, alcohol drinking, energy intake, tea intake, soft drink intake, depression, hypertension, diabetes, arthritis, gout, stroke and cancer.
The weighted associations between caffeinated coffee and functional disability are displayed in Table 2. In the age-adjusted models, participants with higher caffeinated coffee consumption tended to have lower odds of all domains of functional disability except LEM. In the fully adjusted models, compared with non-drinker of caffeinated coffee, drinkers ≥2 cups/d showed lower odds of reporting disability in GPA (OR 0·67, 95 % CI 0·48, 0·92, P trend = 0·01) and LSA (OR 0·66, 95 % CI 0·46, 0·93, P trend = 0·02). The odds of IADL disability was decreased across all other categories of caffeinated coffee consumption with respect to non-coffee drinkers (OR0 to <1 cups/d 0·71, 95 % CI 0·55, 0·93; OR1 to <2 cups/d 0·69, 95 % CI 0·52, 0·91; OR≥2 cups/d 0·57, 95 % CI 0·43, 0·75, P trend < 0·001). A lower odds of ADL disability was also observed among caffeinated coffee drinkers ≥2 cups/d with respect to non-coffee drinkers, although the association was not statistically significant (OR 0·72, 95 % CI 0·52, 1·01). In Table 3, we report the weighted age- and multivariate-adjusted associations between categories of decaffeinated coffee intake and functional disability. The higher decaffeinated coffee intake was only related to disability in LEM and LSA after adjusting all confounders. Comparing drinkers of 0 to <1 and ≥2 cups/d to non-drinkers of decaffeinated coffee consumption, the corresponding OR was 0·65 (95 % CI 0·47, 0·89) and 0·43 (95 % CI 0·23, 0·81) for LEM disability (P trend = 0·02) and 0·64 (95 % CI 0·50, 0·82) and 0·39 (95 % CI 0·16, 0·94) for disability in LSA (P trend = 0·08).
Table 2. Age- and multivariate*-adjusted associations between categories of caffeinated coffee intake and functional disability, National Health and Nutrition Examination Survey (NHANES) (2007–2016)
(Numbers and percentages; weighted odds ratios and 95 % confidence intervals)
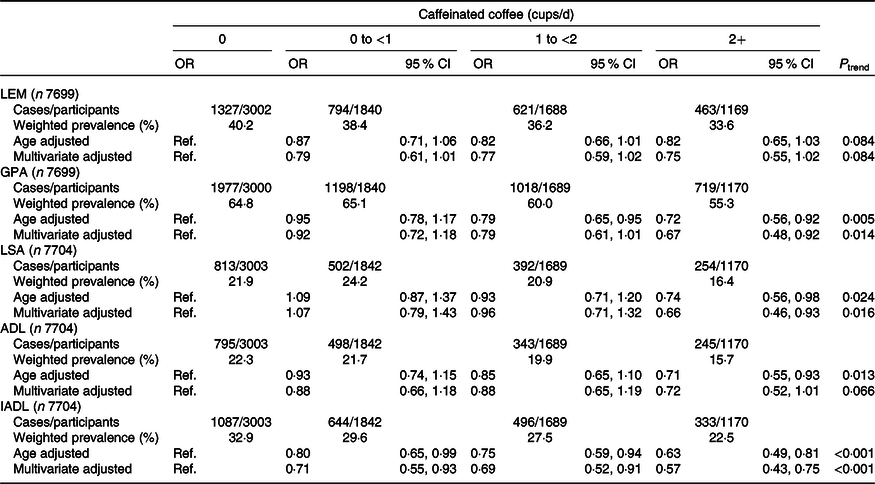
LEM, lower extremity mobility; Ref., reference; GPA, general physical activity; LSA, leisure and social activities; ADL, activities of daily living; IADL, instrumental activities of daily living.
* Adjusted for age, sex, race and ethnicity, marital status, educational level, annual household income, BMI, physical activity, cigarette smoking, alcohol drinking, energy intake, tea intake, soft drink intake, depression, hypertension, diabetes, arthritis, gout, stroke, cancer and decaffeinated coffee consumption.
Table 3. Age- and multivariate*-adjusted associations between categories of decaffeinated coffee intake and functional disability, National Health and Nutrition Examination Survey (NHANES) (2007–2016)
(Numbers and percentages; weighted odds ratios and 95 % confidence intervals)
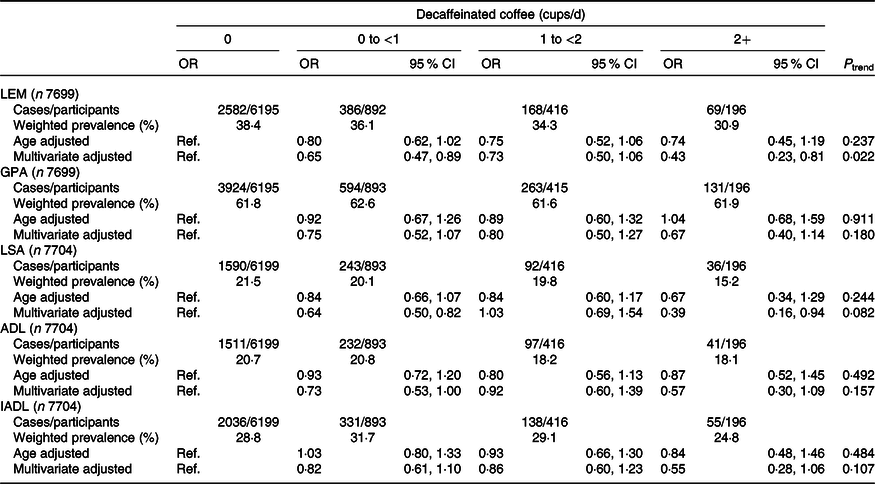
LEM, lower extremity mobility; Ref., reference; GPA, general physical activity; LSA, leisure and social activities; ADL, activities of daily living; IADL, instrumental activities of daily living.
* Adjusted for age, sex, race and ethnicity, marital status, educational level, annual household income, BMI, physical activity, cigarette smoking, alcohol drinking, energy intake, tea intake, soft drink intake, depression, hypertension, diabetes, arthritis, gout, stroke, cancer and caffeinated coffee consumption.
The weighted associations between caffeine intake (mg/d) and functional disability are presented in online Supplementary Table S3. Participants in the highest quartile of caffeine intake had lower odds of reporting disability in GPA (OR 0·76, 95 % CI 0·59, 0·99, P trend = 0·04) than those in the lowest quartile. Also, the odds of reporting disability of ADL was reduced among participants in the third quartile of intake (OR 0·71, 95 % CI 0·53, 0·97, P trend = 0·08). Compared with the participants with lowest quartile of caffeine intake, those with the second and third quartiles had OR of 0·65 (95 % CI 0·48, 0·87) and 0·63 (95 % CI 0·47, 0·84) of IADL disability (P trend < 0·001).
The associations between total, caffeinated, decaffeinated coffee and functional disability stratified by sex are displayed in online Supplementary Tables S4 and S5. For males, total, caffeinated coffee and caffeine intakes were inversely linked to four domains of functional disability (adjusted OR ranged from 0·48 to 0·67) except LSA disability, and the intake of decaffeinated coffee was negatively associated with four domains of functional disability (adjusted OR ranged from 0·35 to 0·64) except IADL disability. While for females, there was inverse association of total coffee intake with LSA and IADL disability (adjusted OR ranged from 0·51 to 0·53), the inverse association was observed between caffeinated coffee consumption and LSA, ADL and IADL disability (adjusted OR ranged from 0·47 to 0·75), decaffeinated coffee consumption was negatively linked to LEM, GPA and LSA disability (adjusted OR ranged from 0·58 to 0·67) and the caffeine intake was inversely associated with IADL disability (OR 0·56, 95 % CI 0·40, 0·79). In the sensitivity analysis, the results were almost unchanged when we excluded participants with CVD and cancer (online Supplementary Tables S6 and S7).
Fig. 2 depicts dose–response relationship between total coffee consumption and each domain of functional disability except ADL. We found that with increasing intakes of total coffee consumption, the OR of the disability of LEM (P for non-linearity = 0·06), GPA (P for non-linearity = 0·36), LSA (P for non-linearity = 0·44) and IADL (P for non-linearity = 0·11) decreased in dose relationship manner. The does–response relationship of total coffee consumption was not carried out because no statistically significant association was observed between total coffee consumption and ADL in the multivariate logistic regression model.

Fig. 2. (a) Examination of the dose–response relationship between total coffee consumption and lower extremity mobility (LEM) disability (P for non-linearity = 0·06); (b) examination of the dose–response relationship between total coffee consumption and general physical activity (GPA) disability (P for non-linearity = 0·36); (c) examination of the dose–response relationship between total coffee consumption and leisure and social activities (LSA) disability (P for non-linearity = 0·44) and (d) examination of the dose–response relationship between total coffee consumption and instrumental activities of daily living (IADL) disability (P for non-linearity = 0·11). No total coffee consumption was used as the reference group. The solid line and dashed line represent the estimated odds ratio and its 95 % confidence interval.
Discussion
In this large-scale cross-sectional study, after adjusting confounders, older adults with high total coffee consumption had lower odds of reporting disability in LEM, GPA, LSA, as well as IADL, and the dose–response relationship was detected. For different types of coffee, higher intake of caffeinated coffee was associated with reduced prevalence of GPA, LSA and IADL disability. And the decaffeinated coffee showed meaningful inverse association only on the disability of LEM and LSA. The association between different types of coffee and five domains of functional disability was discrepant in males and females.
Limited studies have evaluated the association between coffee consumption and functional disability. Machado-Fragua et al.(Reference Machado-Fragua, Struijk and Graciani16) conducted a cohort study with 3289 Spanish adults aged ≥60 years and found that although without significant interaction of coffee intakes and subgroups, coffee consumption was associated with lower risk of functional disability in women and adults with hypertension, obesity or diabetes. But the protective effect of coffee was not significant in all adults. Whereas our study suggested that older American adults who consumed higher total, caffeinated and decaffeinated coffee were associated with reporting lower odds of different domains of functional disability after adjusting the risk factors like hypertension, diabetes and so on. The inconsistent conclusions could possibly due to different study designs, studied samples, types of coffee consumed and measurements of functional disability.
Our findings supported that coffee consumption was associated with functional disability. What remains unknown is what components of coffee confer such benefits. We examined the relationship of caffeinated, decaffeinated coffee and caffeine intake on the functional disability and found that although caffeinated coffee and decaffeinated coffee were both inversely related to functional disability, those relationships differ across domains of functional disability. Caffeinated coffee and caffeine ntake both have beneficial associations on GPA and IADL disability, which means the caffeine might be the beneficial component of coffee. In consistent with the present results, previous studies have demonstrated that the protective association between caffeinated coffee and falls might be due to the caffeine(Reference Machado-Fragua, Struijk and Ballesteros14). A randomised controlled trial assessed the effect of caffeine ingestion on functional performance and found that acute caffeine ingestion positively enhanced functional performance in apparently healthy older adults(Reference Duncan, Clarke and Tallis28). While we also found that higher decaffeinated coffee was related to the lower odds of LEM and LSA disability. Decaffeinated coffee contains many non-caffeine compounds, such as chlorogenic acid and diterpenoids. Chlorogenic acid, as the most common compounds, improves many aspects of cognition such as sustained attention, reaction time and alertness(Reference Camfield, Silber and Scholey29); those ability was essential for older adults to maintain their physical function(Reference Wang, Wu and Li30). Therefore, the beneficial effects of decaffeinated coffee might be partially due to chlorogenic acid which enhanced sustained attention and reaction time.
The mechanism about the inverse association of coffee on functional disability is unclear. Previous findings, along with those from our study, may suggest that the inverse association of coffee consumption against functional disability might be due to the beneficial effects of coffee on muscle strength(Reference Guo, Niu and Okazaki31), cognition(Reference Eskelinen, Ngandu and Tuomilehto32,Reference Buchman, Boyle and Leurgans33) and anti-inflammatory effect(Reference Loftfield, Shiels and Graubard34). Guo et al.(Reference Guo, Niu and Okazaki31) examined the effect of coffee on the skeletal muscles used aged mice in vivo and detected that total coffee treatment was benefit to the prevention of age-related sarcopenia in mice. These results provided the evidence to support the protective effect of coffee on functional disability that might be caused by the loss of skeletal muscles. Moreover, cognition is essential for planning and monitoring performance. Lower levels of cognition have been reported to be related to self-reported disability(Reference Buchman, Boyle and Leurgans33). Meanwhile, coffee drinkers at midlife had better cognition later in life with respect to those drinking no or only little coffee(Reference Eskelinen, Ngandu and Tuomilehto32). Thus, the inverse associations of coffee in our study might be related to better cognition. Additionally, anti-inflammatory effects of coffee might attenuate many health-related outcomes such as disability. Many previous studies have reported that coffee consumption was associated with lower levels of inflammatory markers such as IL-8(Reference Kempf, Herder and Erlund35), fetuin-A(Reference Wedick, Brennan and Sun36) and 8-isoprostane levels(Reference Kempf, Herder and Erlund35), which were risk factors of incident mobility limitation(Reference Penninx, Kritchevsky and Newman37) and ADL disability(Reference Sujarwoto and Tampubolon38). The mechanism of coffee on functional disability needs to be explored by more research considering the potential hypothesis of muscle strength, diabetes and anti-inflammatory effects.
A major strength of this study is the large number of participants from the NHANES, which could generate nationally representative estimates of older American adults. Furthermore, we used five domains to measure the functional disability, including LSA which has not been investigated in the previous studies. Moreover, the correlation coefficients of two 24-h dietary recalls are 0·71, which proved the high reliability of habitual coffee consumption in this study. In addition, we detected the dose–response relationships between total coffee consumption and functional disability. Finally, our study investigated the association of diverse type of coffee on each functional disability domain. However, there were also some limitations in our study. First, owing to the cross-sectional design of this study, the causal inferences of coffee consumption and functional disability cannot be inferred, the possibility of reverse causality also cannot be excluded. Participants may drink less coffee due to the reduced mobility (unable to prepare or buy coffee) and reduced social activities (less reason to drink coffee). Therefore, longitudinal cohort study is necessary to investigate the prospective association between coffee consumption and functional disability in older American adults in the future. Second, the coffee consumption and functional disability were self-reported, which might introduce recall bias. Finally, although numerous potential confounders have been adjusted, some residual confounding might still persist. Yet, we hope these results may stimulate interest in achieving a better understanding of the associations between coffee consumption and functional disability.
In conclusion, our results show that coffee consumption is inversely associated with the lower odds of functional disability in older American adults. The inverse associations of diverse coffee type differ across the different domains of functional disability. Further research is essential to confirm these results in prospective design in older American adults and explore the mechanism of the inverse associations.
Acknowledgements
The authors appreciate the American Centers for Disease Control and Prevention for conducting the survey and making it available online freely, and all the participants for providing these data.
This research received no specific grant from any funding agency, commercial or not-for-profit sectors.
Study concept and design: T. W. and D. Z.; acquisition of data: T. W.; analysis and interpretation of data: T. W. and D. Z.; drafting of the manuscript: T. W. and D. Z. and critical revision of the manuscript for important intellectual content: T. W., Y. W., W. W. and D. Z.
The authors declared no conflicts of interest with respect to the authorship or publication of this article.
Supplementary material
For supplementary material referred to in this article, please visit https://doi.org/10.1017/S0007114520003153


