


Depressive disorders are one of the major public health problems globally. According to the 2015 Global Burden of Disease study, depressive disorders are the third leading cause of disability( Reference Vos, Allen and Arora 1 ). A systematic review in low- and lower-middle-income countries showed that about one in six pregnant women and one in five women who had recently given birth experienced common perinatal mental disorders( Reference Fisher, Cabral de Mello and Patel 2 ). That review revealed different determinants of common perinatal mental disorders, such as financial difficulties, unemployment, difficulties in an intimate partner relationship, insufficient social support and adverse reproductive outcomes. Furthermore, in developing countries a high prevalence of maternal common mental disorders (CMD), ranging from 21 % in Vietnam to 33 % in Ethiopia, is reported( Reference Harpham, Huttly and De Silva 3 ).
In Ethiopia, although there are no nationally representative data, maternal depression ranging from 5 to 37 % was reported from different pocket studies( Reference Deyessa, Berhane and Alem 4 – Reference Hadley, Tegegn and Tessema 8 ). In a systematic review of twelve studies conducted from 1990 to 2012 in Ethiopia, the population prevalence of depression was estimated to be 11 %( Reference Bitew 9 ). Female gender, marital loss, poor social support, low wealth index, tobacco smoking, hazardous use of alcohol, older age, having a co-morbid illness, living alone, stressful life events and increasing age were associated with CMD in Ethiopia( Reference Fekadu, Medhin and Selamu 10 , Reference Molla, Sebhat and Hussen 11 ).
In 2001, the FAO defined food security as: ‘a situation that exists when all people, at all times, have physical, social and economic access to sufficient, safe and nutritious food that meets their dietary needs and food preferences for an active and healthy life’. According to FAO estimates, 795 million people remained undernourished in 2015( 12 ). The estimate showed that East African countries had a bigger share the problem. In Ethiopia the prevalence of household food insecurity was estimated to be as high as 70 %( Reference Endale, Mengesha and Atinafu 13 ). Although Ethiopia has made significant progress against undernutrition, 40 % of children in the country are stunted( Reference Headey 14 ).
The health consequences of food insecurity go beyond undernutrition. There is accumulating evidence that shows a positive association between CMD and food insecurity( Reference Hadley, Tegegn and Tessema 8 , Reference Hadley and Patil 15 – Reference Weaver and Hadley 18 ). The association between depression and food insecurity is complex. A bidirectional causal relationship between household food insecurity and depression is documented( Reference Huddleston-Casas, Charnigo and Simmons 17 ). Food insecurity is indicated as a risk factor for depression. Different mechanisms such as psychological distress and micronutrient deficiency are reported( Reference Weaver and Hadley 18 – Reference Patel and Kleinman 22 ). On the other hand, depression can be a risk factor for food insecurity through unemployment, lost productivity and increased health expenditure( Reference Beck, Crain and Solberg 21 – Reference Stewart, Ricci and Chee 23 ).
However, there is limited evidence on the association between food insecurity and depression among women in Ethiopia, where the problem of food insecurity is rampant( Reference Endale, Mengesha and Atinafu 13 ). In addition, the exiting literature has limitations in terms of study size, representativeness and the use of locally validated tools( Reference Maes, Hadley and Tesfaye 24 , Reference Jebena, Taha and Nakajima 25 ). In the present study, we hypothesized that maternal depression is associated with food insecurity in a highly food-insecure setting and tested this using a large representative sample and robust analytic method. Understanding maternal depression is very important since studies have reported that maternal depression could be one of the pathways through which household food insecurity could impact child undernutrition( Reference Harpham, Huttly and De Silva 3 , Reference Hadley, Tessema and Muluneh 26 – Reference Wemakor and Mensah 28 ).
Materials and methods
Study setting
The study was conducted in Meskan and Mareko districts, in the Gurage Zone of the Southern Nations and Nationalities regional state. Butajira, located 135 km south of Addis Ababa (the capital city of Ethiopia), is the districts’ capital and has an estimated population of 199 771.
The agroecology of the district is characterized by an elevation ranging from approximately 1500 to 3500 m above sea level, with an average temperature ranging from 10 to 24°C and an average annual rainfall ranging from 900 to 1400 mm. The main means of livelihood in the district is rain-fed agriculture, which is characterized by production of subsistence crops (primarily enset, cereals, legumes, vegetables, fruits) and some cash crops such as khat (Catha edulis). Most of the households are affected by chronic food insecurity and are prone to drought.
Butajira Health and Demographic Surveillance Site, located in Butajira, is one of the oldest surveillance sites in Africa, being established in 1986. It consists of nine rural and one urban kebeles (the smallest administrative unit in Ethiopia) from different ecological zones. Each kebele has one or two permanent enumerators who are residents of the respective kebeles. Seven health centres, forty health posts and two hospitals serve the residents in the district.
Study design and period
The present study employed a cross-sectional design. The data were collected during the postharvest season, i.e. between December 2013 and April 2014.
Sample size and sampling
The analytical sample for the study was based on a sample size calculated for another objective that aimed to examine spatial variations in the distribution of undernutrition in southern Ethiopia( Reference Seid, Tadesse and Gebremedhin 29 ). The sample size available for the present analysis was 3091 women with children between the ages of 0 and 59 months. We recalculated the power of the analytic sample for its adequacy to answer the present research question. The power based on normal approximation with continuity correction was 98·8 %.
The health extension workers provided us with a list of houses, names of the household head and the family profile. This was obtained from the family registry forms and used simple random sampling to select eligible houses that have one or more children under the age of 5 years. We visited all houses with support from the health extension workers, local guides and study supervisors.
Outcome measures
The main outcome of the study was maternal depression. Maternal depression was measured using the Patient Health Questionnaire-9 (PHQ-9)( Reference Kroenke and Spitzer 30 ). The PHQ-9 is a self-report measure used to screen major depressive disorders. The PHQ-9 has been found to be valid in two studies from Ethiopia in different treatment settings: tertiary hospital medical outpatients( Reference Gelaye, Williams and Lemma 31 ) and primary-care outpatients in the study area( Reference Hanlon, Medhin and Selamu 32 ). The PHQ-9 is composed of nine items asked with a recall period of two weeks. The items inquire how often respondents have been bothered by depressive symptoms, with response categories of 0=‘not at all’, 1=‘several days’, 2=‘more than half the days’ and 3=‘nearly every day’.
In the present study, the internal consistency of the PHQ-9 was moderate (Cronbach’s α value of 0·65). Validation work in another study has shown evidence of construct validity: factor analysis indicated a unidimensional scale. Core depression items (feeling down, little interest) were among the items most strongly related to the underlying construct( Reference Gelaye, Williams and Lemma 31 ).
Other measures
The main explanatory (exposure) variable considered was the level of household food insecurity. Secondary variables measured in the analytic sample were woman’s age, marital status, religion, ethnicity, education, husband’s occupation, household head’s gender, household wealth and dietary diversity. Socio-economic status was measured using a customized questionnaire asking about ownership and size of land; type of house and construction materials; availability of radio, television, house telephone, mobile phone, bed, chair, refrigerator, electric stove, clock/watch and electricity; possession of domestic animals; and sanitation facilities and source of water.
Household food insecurity and dietary diversity
We used the Household Food Insecurity Access Scale (HFIAS) to measure the magnitude of food insecurity at household level( Reference Swindale and Bilinsky 33 ). The HFIAS tool was validated and has been shown to perform well with minor adaptations in the same setting( Reference Gebreyesus, Lunde and Mariam 34 ). The HFIAS is a nine-item scale with self-reported items using a recall period of four weeks and response categories relating to the frequency of occurrence.
We collected data on food groups eaten by the respective household during the day and night preceding the survey. A dietary diversity score for each household was generated using the sum of all food groups consumed. The total number of food groups consumed by households could range from 0 to 12. Based on the reported number of food groups consumed, we classified households into lowest, medium and high dietary diversity( Reference Kennedy, Ballard and Dop 35 ).
Data collection
We recruited twenty research assistants and two supervisors who had experience in data collection and supervision. We conducted a comprehensive training on the administration of the questionnaire and interviewing skills. One of the authors (S.H.G.) translated the questionnaire into the Amharic language (official language) and reviewed it together with the research assistants who were residents in the study district. We conducted a pre-test in a nearby district with socio-economic characteristics similar to those in the study district.
Data analysis
We used the software EpiData version 3.1 for data entry and the statistical software package Stata version 13.0 for data cleaning and initial analysis. Data were cleaned for inconsistencies and missing values. All variables with missing data were reported. Descriptive analysis was done on explanatory variables using frequency distributions and summary statistics. We evaluated the comparability between the women in the food-secure and food-insecure groups using χ 2 and t tests as appropriate. Maternal depression was indicated by categorization of total PHQ-9 score as follows: 5–9, mild depression; 10–14, moderate depression; 15–19, moderately severe depression; and ≥20, severe depression.
We used the HFIAS tool to classify households into four levels of food insecurity: food secure, mildly food insecure, moderately food insecure and severely food insecure. The nine items in the HFIAS are ordered in such a way to reflect an increasing severity of food insecurity. A food-secure household experiences none of the nine items in the HFIAS or experienced the first item only (worry about food), but rarely. A severely food-insecure household experiences one of the last three items (items 7–9: running out of food, going to bed hungry, or going a whole day and night without eating). The complete procedure used to categorize a household to one of the four food insecurity levels is described elsewhere( Reference Seid, Tadesse and Gebremedhin 29 ).
We used principal component analysis to construct a household wealth index. The variables used in the principal component analysis included ownership and size of land, type of house and construction materials, availability of fixed assets such as radio, television, phone, bed, chair and other household items, possession of domestic animals, type of water source for drinking and cooking, and availability and type of latrine. The resulting scores were divided into quintiles that indicated poorest, poor, medium, rich and richest.
A logistic regression model was fitted using the statistical software package Stata version 11.0 to identify variables for Bayesian modelling. Explanatory variables such as the level of household food insecurity, maternal age, ethnicity, religion, husband’s occupation, household wealth and gender of the household head were statistically significant at the 20 % significance level (at P<0·2) and considered as potential explanatory variables for the Bayesian modelling.
Bayesian logistic regression modelling was undertaken using WinBUGS version 1.4.3 (MRC Biostatistics Unit, Cambridge and Imperial College London, UK; see online supplementary material). We started with non-informative prior and 10 000 iterations. We checked for convergence of parameters visually using history plot and kernel density. Convergence was successfully achieved after 10000 iterations. After convergence, a further 10000 iterations were run, and values were thinned by 10 and stored. The stored samples were used to calculate summary statistics (mean, sd and 95 % Bayesian credible interval (BCI)) of the parameters.
Dose–response analysis
We ran a dose–response analysis to evaluate if the prevalence of depression increased with increasing severity of household food insecurity. A test was performed using the extended Mantel–Haenszel χ 2 for linear trend using OpenEpi software.
Results
Participant characteristics
The analytic sample included a total of 3091 mothers with one or more children under the age of 5 years. Only fifteen (0·35 %) households (i.e. mothers) were not included in the study because of unavailability after repeated visits.
The mean age of the mothers at the time of the interview was 33 (sd 6·08) years. Most of the respondents were illiterate (74·4 %) and housewives (69·7 %). The great majority (94·0 %) were married. Table 1 shows the differences in the background characteristics of the respondents who lived in food-secure and food-insecure households. Women who lived in the food-insecure households were illiterate (χ 2=37·8, P<0·001), poor (χ 2=62·2, P<0·001) and had a lower dietary diversity score (χ 2=30·3, P<0·001) compared with women who lived in food-secure households.
Table 1 Sociodemographic characteristics of women (n 3091) according to household food security status in south central Ethiopia, 2014

PHQ-9, Patient Health Questionnaire-9.
Magnitude of household food insecurity and maternal depression
The overall prevalence of food insecurity was 80·8 (95 % CI 79·4, 82·2) %. Of the women, 1087 (35·2 %) lived in mildly food-insecure households, 1352 (43·7 %) lived in moderately food-insecure households and thirty-eight (1·2 %) lived in severely food-insecure households.
The overall prevalence of depression (PHQ-9 score of ≥5) was 4·7 (95 % CI 4·1, 5·6) %. The overall prevalence of depression at the mild, moderate and severe threshold levels was 3·9 (95 % CI 3·3, 4·6) %, 0·9 (95 % CI 0·6, 1·2) % and 0 %, respectively.
The overall mean PHQ-9 score was 1·27 (sd 1·87; 95 % CI 1·20, 1·34), ranging from 0 to 14 points. The mean PHQ-9 score was 1·48 (95 % CI 1·40, 1·56) in women who lived in food-insecure households and 0·38 (95 % CI 0·29, 0·48) in women who lived in food-secure households (i.e. 1·08 points lower (95 % CI −1·26, −0·93)).
The distribution of responses to the PHQ-9 items by household food security status is presented in Table 2. The responses to the problems were categorized into two groups: (i) those without any problems (none); and (ii) those with the problems occurring in any frequency (several days, more than half the days or nearly every day) over the past two weeks. PHQ-9 item frequency ranged from 0·3 to 12·0 % and from 1·0 to 45·1 % among women in the food-secure and food-insecure groups, respectively. ‘Thoughts of being better off dead’ received the lowest affirmative responses in both groups of women.
Table 2 Patient Health Questionnaire-9 (PHQ-9) item responses of women living in food-secure and food-insecure households, south central Ethiopia, 2014
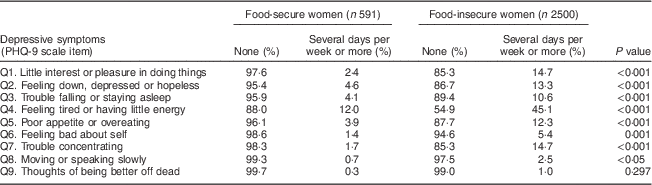
All individual depressive symptoms had a significantly higher prevalence in the food-insecure group, except for suicidal ideation (but small numbers; P<0·001). For example, women in food-insecure households, compared with the food-secure group, reported seven times more on item 1 (‘little interest or pleasure in doing things’) and eight times more on item 7 (‘trouble concentrating’; Table 2).
Household food insecurity and depression
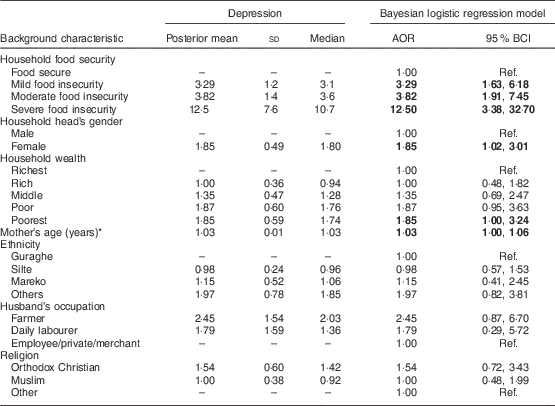
In the Bayesian logistic regression model, women who live in food-insecure households had higher odds of depression than women who lived in food-secure households (Table 3). The model adjusted for mother’s age, household wealth, husband’s occupation, household head’s gender, religion and ethnicity.
Table 3 Bayesian logistic model for the relationship between food security and maternal depression, south central Ethiopia, 2014
AOR, adjusted odds ratio; BCI, Bayesian credible interval; Ref., reference category.
Significant results are indicated in bold font.
* Maternal age is treated as a continuous variable.
The adjusted OR (AOR) for depression for differing levels of food insecurity were: mild food insecurity, AOR=3·29 (95 % BCI 1·63, 6·18); moderate, AOR=3·82 (95 % BCI 1·91, 7·45); and severe, AOR=12·50 (95 % BCI 3·38, 32·70).
Other variables were also associated with depression: female-headed households (AOR=1·85; 95 % BCI 1·02, 3·01) and women who lived in the poorest households (AOR=1·85; 95 % BCI: 1·00, 3·24) were more likely to be depressed. Women’s age was also associated with depression; those women who were older were more likely to be depressed than women who were younger (AOR=1·03; 95 % BCI 1·00, 1·06).
Dose–response relationship
The magnitude of depression increased as the level of household food insecurity increased (Fig. 1). We found a significant dose–response linear relationship between household food insecurity and women’s depression (dose–response extended Mantel–Haenszel χ 2 for linear trend=20·54, P<0·01).
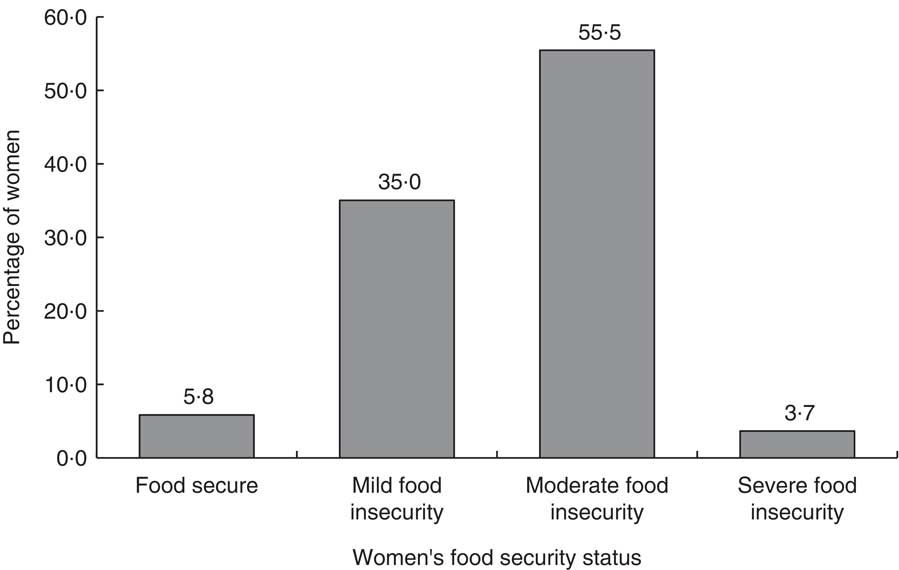
Fig. 1 Percentage of women (n 3091) with depression by household food security status, south central Ethiopia, 2014 (dose–response extended Mantel–Haenszel χ 2 for linear trend=20·54, P<0·01)
Discussion
The present analysis employed a large cross-sectional study to evaluate the association between household food insecurity and maternal depression in southern Ethiopia. We used validated measures for both depression and food insecurity. After adjustment for a range of confounders, women who lived in food-insecure households had significantly higher odds of depression compared with women who lived in food-secure households.
The relationship between food insecurity and depression may be explained through different mechanisms. One of the mechanisms could be related to increased psychological stress associated with food insecurity. Household food insecurity is likely to be associated with worries about not having enough food for the family in general and for children in particular. Furthermore, shame because of eating a socially unacceptable diet may lead to stress. Due to these and other psychological stressors, women will be at higher risk of developing CMD( Reference Weaver and Hadley 18 ). Another possible mechanism that could explain why food-insecure women are at higher risk of CMD is related to nutritional deficiencies. There is an emerging evidence base indicating that deficiencies of specific nutrients, such as folate, vitamin D, vitamin B12, Zn and n-3 fatty acids, are associated with CMD( Reference Jacka, Maes and Pasco 19 , Reference Rao, Asha and Ramesh 20 ).
The finding of higher odds of depression in women who lived in food-insecure households is consistent with a number of previous studies( Reference Hadley, Tegegn and Tessema 8 , Reference Hadley and Patil 15 – Reference Huddleston-Casas, Charnigo and Simmons 17 , Reference Jebena, Taha and Nakajima 25 , Reference Sorsdahl, Slopen and Siefert 36 , Reference Whitaker, Phillips and Orzol 37 ). Furthermore, the present study’s finding is in agreement with a systematic review of eleven qualitative and sixteen quantitative studies conducted in low- and middle-income countries which confirmed a positive association between food insecurity and CMD( Reference Weaver and Hadley 18 ). We also found that the odds of depression increased as the level of household food insecurity increased( Reference Whitaker, Phillips and Orzol 37 , Reference Dewing, Tomlinson and le Roux 38 ).
Our analysis found that women who lived in the poorest households were more likely to be depressed than those who lived in the richest households. Although a similar finding is documented elsewhere( Reference Patel and Kleinman 22 , Reference Brown and Moran 39 , Reference Martikainen, Adda and Ferrie 40 ), the relationship between depression and poverty is complex( Reference Lund, Breen and Flisher 41 ). According to the social causation hypothesis, poverty raises the risk of mental illness through different pathways including increased stress, social segregation, violence and trauma. On the other hand, according to the social selection hypothesis, people with mental illness are at increased risk of poverty through increased health expenditure, reduced productivity, stigma, and loss of employment and associated earnings. The social causation pathway might be more relevant to CMD such as depression, whereas the social selection hypothesis might be more appropriate to disorders such as schizophrenia and intellectual disabilities( Reference Hudson 42 ).
The findings of the present study should be interpreted within the context of the following limitations. Due to the cross-sectional nature of the study, we cannot rule out the possibility of reverse causality, i.e. depression may cause household food insecurity. Second, the study did not account for different determinants of depression including poor social support, recent stressful life events, previous depressive illness, violence and physical illness, which might not be evenly distributed among households of different levels of food insecurity. Moreover, respondent bias with the anticipation of some form of support might overestimate the prevalence of food insecurity, although this may not affect the association between depression and food insecurity as the anticipation of support might not differ between depressed and non-depressed women. In addition to these limitations, we admit that the present analysis is subjected to recall bias. It has been documented that depressed women have negative cognitive distortion and may be more likely to give affirmative responses to the household food insecurity questions.
The use of locally validated tools to measure depression (PHQ-9) and food insecurity (HFIAS) are important strengths of the present study. In addition, we used large sample size with adequate power and this helped us to analyse the dose–response trend among different levels of food insecurity and depression. Moreover, we applied a robust statistical analysis in a Bayesian framework which enabled us to get robust estimates.
Conclusion
In conclusion, household food insecurity was found to be an important determinant of maternal depression in rural Ethiopia. However, further research employing robust research designs is recommended to answer the relationship between food security and depression. For this, we recommend a prospective study design with a cohort of food-secure and food-insecure households that are screened for depression at a baseline. Furthermore, we recommend a study that aims to evaluate the mechanism(s) explaining the relationship between food insecurity and depression. This might involve testing the hypothesis that some micronutrient deficiencies could explain the relationship between food insecurity and depression. In addition, intervention studies are required to test whether interventions to reduce food insecurity lead to decreased maternal depression.
Acknowledgements
Acknowledgements: The authors would like to thank the Centre for International Health at the University of Bergen for funding the study and all study participants for their willingness to participate in the study. Financial support: This work was supported by the Centre for International Health at the University of Bergen. The funding body had no role in designing the study, in the collection, analysis and interpretation of data, in the writing of this manuscript and in the decision to submit for publication. Conflict of interest: The authors declare that they have no competing interests. Authorship: S.H.G. and B.L. designed the study. S.H.G., B.L., B.S.E. and C.H. participated in the data analysis and drafting of the manuscript. All authors read and approved the final manuscript. Ethics of human subject participation: The study protocol was approved by institutional review boards from Addis Ababa University, College of Health Sciences. The study was also approved by the Regional Committee for Medical and Research Ethics, Western Norway (REK Vest). Information on the research objective was read to the participants and verbal informed consent was received. Privacy and confidentiality of respondents were also maintained.
Supplementary material
To view supplementary material for this article, please visit https://doi.org/10.1017/S1368980017003056


