


INTRODUCTION
Norovirus is the commonest cause of outbreaks of infectious intestinal disease (IID) with around 50% of all IID outbreaks attributed to this pathogen [Reference Patel1, Reference Yen2]. Norovirus outbreaks are most frequently reported in healthcare settings such as nursing homes, other long-term care facilities and hospitals [Reference Patel1, Reference Hauri3, Reference Johnston4]. Nosocomial outbreaks of norovirus impose a heavy cost on institutions. For example, the economic impact of an outbreak in a US hospital in 2004 was estimated to be over US$650 000 [Reference Johnston4]; one outbreak in a Swiss hospital cost over US$40 000 [Reference Zingg5]; in one health region in Scotland from 2007 to 2009 the estimated excess costs of norovirus outbreaks was around US$1.8 million [Reference Danial6]. The public health and financial impact of norovirus outbreaks in English hospitals was first illustrated by a study conducted in the county of Avon, in South West England, between 2002 and 2003 [Reference Lopman7]. Researchers estimated that IID outbreaks (62% of which were due to norovirus) cost the National Health Service (NHS) in Avon US$1.01 million per 1000 beds due to bed-days lost and staff sickness. Extrapolating this to the whole of the NHS in England this equated to approximately US$184 million.
Following a recommendation of the UK Government's Committee on the Microbiological Safety of Food [8] standardized surveillance of general outbreaks of IID was introduced in 1992 [Reference Wall9]. A review of the surveillance data for the period 1992–2000 on hospital outbreaks of IID provided the first indications of the impact of norovirus infections in hospitals in England [Reference Meakins10]. Over a quarter of all general outbreaks of IID reported occurred in hospitals. Almost 80% (1097/1396) of these were confirmed or suspected to be due to norovirus.
It was recognized by the UK Department of Health that more detailed systematically collected information on the epidemiology of norovirus infection in hospitals was required in order to develop a rigorous evidence base to inform national infection control policies. The Hospital Norovirus Outbreak Reporting System (HNORS) was launched in January 2009.
In this paper we present data from the first 3 years of HNORS (2009–2011) in England and contrast it with analyses of data drawn from the national surveillance system for general outbreaks of IID (GSURV) prior to dedicated hospital surveillance (1992–2008). As the previous system (GSURV) is the only benchmark available, this would provide a measure of change, if any occurred, in ascertainment of norovirus outbreaks in hospitals from the introduction of the new system. Routinely gathered laboratory data from positive specimens of norovirus in individuals were used to compare the seasonality of reported outbreaks. Laboratory data from specialist centres (SCs), where samples from outbreaks in hospitals are referred, was used to assess the completeness of the new surveillance scheme (HNORS).
METHODS
Surveillance of general outbreaks of infectious intestinal disease 1992–2008 (GSURV)
Systematic national surveillance of general outbreaks of IID in England and Wales has been in continuous operation since 1992. This system is described elsewhere [Reference Meakins10]. Briefly, summary data on outbreaks of IID were reported using standardized paper forms after the outbreak had concluded and were entered onto a database. The items requested on the form included: mode of transmission, place of outbreak, number of cases; number laboratory-confirmed cases; first and last dates of onset of illness. Data for outbreaks of suspected/confirmed norovirus infection in English hospitals from 1992 to 2008 were extracted. Only sparse data on the types of wards affected were available. No data were collected on the numbers of patients vs. staff affected in outbreaks, ward closures (number or duration) or bed-days lost.
Hospital outbreak reports 2009–2011 (HNORS)
A standard dataset, with specifications and definitions agreed by consensus, was designed to collect information describing key epidemiological characteristics of each outbreak including: first and last onset dates, number of patients/staff affected, ward/bay closures and bed-days lost. Data were entered onto a secure web-based database (http://www.hpa-bioinformatics.org.uk/noroOBK/) by infection preventionists at NHS hospitals (see Appendix 1 for full list of data items collected). Each NHS TrustFootnote † was contacted, via the Director of Infection Prevention and Control (DIPC), to invite them to participate in the reporting system. Each Trust was provided with a log in and password in order to participate. Participation was voluntary.
Definitions
The HNORS reporting system utilizes previously developed definitions of cases and outbreaks [Reference Lopman7, Reference Lopman11].
Case definition
A suspected case of norovirus is defined as (a) vomiting: ⩾2 episodes of vomiting of suspected infectious cause occurring in a 24-h period; (b) diarrhoea: ⩾2 loose stools in a 24-h period; or (c) diarrhoea and vomiting: ⩾1 episodes of both symptoms occurring within a 24-h period, where neither criteria (a), (b) or (c) are associated with prescribed drugs or treatments, and are not associated with reaction to anaesthetic or an underlying medical condition or existing illness. A confirmed case of norovirus was defined as: (a), (b) or (c) above with microbiological confirmation.
Norovirus outbreak definition
Suspected outbreak: two or more cases, as defined above, occurring in a ward or bay within the hospital without laboratory confirmation. Confirmed outbreak: as above with laboratory confirmation, i.e. with at least one positive specimen.
Reports of both suspected and laboratory-confirmed norovirus outbreaks were requested. Outbreaks of diarrhoea and vomiting can be caused by pathogens other than norovirus. In the absence of laboratory confirmation, the following criteria are provided as guidance to hospitals as indicators of a norovirus outbreak: average duration of illness of 12–60 h; average incubation period of 24–48 h; more than 50% of people with vomiting; no bacterial agent found [Reference Kaplan12]. Outbreaks are considered to be over if no new cases arise more than 7 days after the last case was reported to be symptom-free.
Laboratory reporting
Two sets of laboratory data were analysed. First, the HPA maintains a well-established laboratory reporting system, described in detail elsewhere, which routinely collects data from laboratories around the UK on positive specimens for many organisms (LabBase2) [Reference Wall9]. These data were used to compare the pattern of norovirus activity, i.e. laboratory reports of individuals who are diagnosed with norovirus [in the period for analysis the majority of whom are tested by polymerase chain reaction (PCR)], with the hospital outbreak reporting system (HNORS). Second, each of the five SCs in HPA regional laboratories and two collaborating centres in London that are routinely sent specimens from patients involved in outbreaks in hospitals, were requested to provide monthly returns on the number of outbreaks for which they had received specimens, with details of the hospital, ward, and dates the outbreaks occurred. The laboratory data from SCs were used to assess the level of ascertainment of outbreaks in hospitals in HNORS using capture–recapture analyses described below.
Estimating the number of unreported outbreaks
Data from SCs were used to estimate the level of under-/overreporting of hospital outbreaks. Hospital-reported outbreaks (HNORS) were matched to those provided by SCs. For details of the matching algorithm, see Appendix 2. The capture–recapture analysis was performed only for regions where there were reports from both systems (six of the nine regions).
Data analysis
We first examined the whole HNORS dataset for all 3 years. The occurrence of norovirus outbreaks peaked during the winter. Therefore, to capture the impact of norovirus over the winter, we designated the beginning of July as the start of a new norovirus season with the end of the following June as its conclusion. We then compared the impacts on hospitals in terms of length of outbreaks, patients/staff affected, ward/bay closures and bed-days lost, which represents an examination of the epidemiology of two consecutive seasons, 2009–2010 and 2010–2011.
Analyses were undertaken using Microsoft Excel 2007 (Microsoft Corporation, USA). All statistical analyses were performed using Stata v. 12 (StataCorp., USA).
RESULTS
Surveillance of general outbreaks of infectious intestinal disease 1992–2008 (GSURV)
National surveillance (GSURV) received reports of 1485 laboratory-confirmed and 332 suspected outbreaks of norovirus in English hospitals in the period 1992–2008. These outbreaks affected 45 855 people (median 15, range 2–719, IQR 9–24). The duration of outbreaks ranged between 1 and 136 days (median 8, IQR 5–13). Large variations were observed in the annual number of outbreaks reported. Peaks in reporting were observed in 1995/1996 and 2002 (Fig. 1). Outbreak reporting consistently peaked during the winter (Fig. 1).

Fig. 1. Outbreaks of confirmed and suspected norovirus in English hospitals by month and year (GSURV), 1992–2008.
Hospital outbreak reports 2009–2011 (HNORS)
Between January 2009 and December 2011, HNORS received 3980 reports of outbreaks of suspected and confirmed norovirus from 109 (66%) acute trusts and 41 (51%) community or mental health trusts listed by the NHS Choices website (http://www.nhs.uk/servicedirectories/pages/acutetrustlisting.aspx). Norovirus was laboratory confirmed in 69% (2737) of the reported outbreaks (75% in the 2009–2010 season, 62% in 2010–2011). The outbreaks were reported to have affected a total of 40 007 (median 9, range 0–110, IQR 6–14) patients and 10 620 staff (median 2, range 0–55, IQR 0–4). Outbreaks lasted a total of 24 129 days (median 6, range 1–59, IQR 4–10) and led to 26 717 days of ward/bay closures (median 8, range 1–86, IQR 6–11) and 46 513 bed-days lost (median 12, range 0–288, IQR 6–32). Therefore, on average, reported outbreaks are associated with 13 000 patients and 3400 staff becoming ill, 8900 days of ward closure and the loss of over 15 500 bed-days annually. Table 1 shows the number of outbreaks reported by year and by season. In the 2009–2010 and 2010–2011 seasons, 86% and 81% of outbreaks led to ward closures, respectively. The median length of outbreak, length of ward closures and the number of bed-days lost were similar in the two seasons (Table 1). General medicine, care of the elderly, admission wards and trauma and orthopaedics wards accounted for 54% of outbreaks over the 3 years. The median number of patients and staff did not differ between the seasons, although the maximum number of patients affected was higher in season 2009–2010 and the maximum number of staff was higher in 2010–2011.
Table 1. Characteristics of reported outbreaks (HNORS)

HNORS, Hospital norovirus outbreak reporting system; IQR, interquartile range.
* Data to 31 December 2011.
Seasonal and regional reporting pattern
The majority of outbreaks occurred during the winter months, 78% of all reported outbreaks occurred between October and March, with a particularly high number in the winter of 2009–2010 (Fig. 2). The pattern of reported outbreaks largely follows the pattern of norovirus laboratory reporting in LabBase2. Outbreaks in hospitals were reported from all regions in England. There were slight differences in the reporting pattern in three of the regions (Fig. 3), because not all of them provided data throughout the study period.

Fig. 2. Number of hospital outbreaks (HNORS) and laboratory reports of norovirus, January 2009 to December 2011.

Fig. 3. Percentage of reports received by reporting system in each region, January 2009 to December 2011.
Estimating underreporting of outbreaks
SCs reported 1074 and 459 outbreaks in 2009–2010 and 2010–2011 seasons, respectively (Table 2). In the two seasons (2009–2010 and 2010–2011) HNORS reported 3068 suspected and confirmed outbreaks. Using the capture–recapture method, we estimated that over the two seasons the true total of outbreaks of norovirus was 3852, which represents an underreporting of around 20% for the two seasons.
Table 2. Laboratory-reported outbreaks from specialist centres by HPA region

HPA, Health Protection Agency.
DISCUSSION
The development of a dedicated system, where infection preventionists directly enter data (HNORS), increased reporting of norovirus outbreaks in NHS hospitals in England so that more outbreaks were reported in the system's first full season of operation (2009/2010, n = 1884) than had been reported in the preceding 17 years (n = 1817). Data from HNORS demonstrate that norovirus outbreaks levy a heavy burden on English hospitals. Outbreaks are associated with, on average, 13 000 patients and 3400 staff becoming ill each year, 8900 days of ward closure and the loss of over 15 500 bed-days.
The first national surveillance system for collecting epidemiological data on general outbreaks of IID in England and Wales was introduced in 1992. Local public health specialists returned epidemiological data on investigated outbreaks using a single ‘one size fits all’ standardized paper form. This imposed severe limitations on the quantity and types of data that could be collected for each outbreak. The format allowed consistent collection of the following data items for each outbreak: location, setting, pathogen, number affected, hospitalizations, deaths, mode of transmission, vehicle of infection (if foodborne), evidence of association (if foodborne), and contributory factors (if foodborne). Reporting of hospital outbreaks was not routed directly through on-site control of infection teams.
Our analyses show that GSURV provided evidence suggesting that norovirus in hospitals was a matter of major public health concern. In retrospect, this system was able to provide a signal of increases in the number of outbreaks associated with the emergence of new variants of norovirus [Reference Lopman13]. However, examination of data from GSURV suggests that reporters varied in their interpretation of what constitutes an outbreak of IID in a hospital. GSURV was limited in that definitions had to be broad enough to apply to a range of settings and modes of transmission captured by the surveillance. For example, defining the spatial boundaries of an outbreak in a restaurant is very different than for in a hospital. In HNORS we were able to provide specific definitions, perhaps the most important being that each hospital unit (or ward) was the area of risk. If an outbreak affected multiple units, we asked for separate outbreak reports and used strict definitions based on the Avon study [Reference Lopman7]. Thus while we have inferred that ascertainment of outbreaks has increased following the introduction of HNORS we cannot be sure of the extent of the improvement. Reporters to HNORS are given guidance on case definitions which means that we can be assured that the outbreaks within the database conform to a stricter epidemiological standard. Conversely, the GSURV dataset on hospital outbreaks contains data on a variety of types of events. Given the numbers affected in outbreaks in the GSURV dataset it is likely that the hospital outbreak count in GSURV would be higher because outbreaks affecting more than one ward are commonly reported as a single outbreak in GSURV. This would not have happened if reporters had been given the same guidance as reporters to HNORS.
The HNORS development working group decided that it was important to collect data on the types of wards/units affected in outbreaks. Care of the elderly wards account for 16% of reported outbreaks, the early evidence collected indicates that the spread of norovirus is not narrowly confined to particular ward types.
The planning process to design a new surveillance system for the collection epidemiological data on outbreaks of norovirus in hospitals began in 2008. By this time the use of the internet for surveillance was well established [Reference Johnston4, Reference Kroneman14]. As a consequence it had become possible to design more sophisticated and flexible data collection instruments. Therefore by working with data providers on the design of the surveillance system it was possible to focus on specific data items that outbreak investigators could gain ready access to and which were of epidemiological value. It was recognized that, even using a voluntary system, transferring the responsibility for reporting directly to on-site staff was likely to lead to improvements in both the reliability of the data collected and ascertainment. The benefits of empowering stakeholders by providing access to the national database while preserving hospital confidentiality were recognized at an early stage. The most important benefits gained from the adoption of HNORS stem from: (a) the use of clear user-drawn case definitions, (b) the collection of impact measures, and (c) real-time contributor access to the national database and its data analysis tools.
It should be borne in mind that HNORS is a voluntary reporting system and complete ascertainment of outbreaks could not be expected. Our capture–recapture analysis suggests that although ascertainment fell during its second season of operation, reporting of laboratory-confirmed outbreaks remained above 60%. The comparison with routine laboratory reporting (LabBase2) showed that outbreak reporting was sensitive to increased norovirus activity, i.e. it followed the norovirus seasonality exhibited by laboratory reporting. Furthermore, the number of outbreaks reported in the winter of 2009/2010 was greater than the following season when laboratory reports were also greatly increased compared to previous and subsequent years.
There are limitations to the capture–recapture approach [Reference Brenner15]. The assumption that capture from one system (HNORS) is unrelated to the likelihood of capture of outbreaks in the other system (data from SCs) might have been violated. We also used only outbreaks from HNORS that were laboratory confirmed but this did not alter the results substantially (data not shown). HNORS is likely to underestimate the number of outbreaks that are laboratory confirmed especially if laboratory confirmation occurs after the outbreak is reported and this information is not updated. Data from the SCs did not have such rigorous definitions of an outbreak, in which case this could have overestimated the number of outbreaks reported from the SCs. This might have overestimated the level of underreporting especially if reports from SCs were not outbreaks but were data from sporadic cases and therefore would not match outbreaks reported to HNORS. Despite these limitations, and in the absence of any other data source available, the estimates from the capture–recapture method are likely to provide a good indication of under-ascertainment. The geographical distribution of outbreaks and laboratory reports (Fig. 3) suggests that there are geographial variations in the application of virological investigations of outbreaks of IID in hospitals. As such our calculations are conservative and might still underestimate the impact of norovirus outbreaks in English hospitals.
One of the features of norovirus outbreaks that make it distinct from some other hospital-acquired infections is the effect it has on staff. Staff illness accounted for 20% (10260/50267) of cases in outbreaks over 3 years. After accounting for underreporting we estimate that this equates to 5000–6500 cases of staff illness in hospitals in England each year. Assuming an average of 4 days absence from work per illness episode this would result in 20 000–25 000 staff days lost per year. Norovirus outbreaks are most frequent in winter [Reference Mounts16] (Fig. 2) which is when hospitals are most busy [Reference Elliot17]. Thus the pressure resulting from norovirus staff illness might be greater than the raw data suggests.
The recently published Second Study of Infectious Intestinal Disease in the Community shows that norovirus is the most common cause of IID in the UK [Reference Tam18]. The application of multiplex PCR tests was successful in increasing diagnoses of norovirus infection in specimens taken by general medical practitioners. The strains identified in outbreaks in community settings appear to be more diverse than those affecting healthcare settings, where the latter are dominated by noroviruses of genogroup II.4 [Reference Matthews19]. Understanding more about the interrelationship between community- and hospital-acquired norovirus might assist in the control of infection in hospitals. To make this possible it will be necessary to develop robust sampling frames to collect specimens from patients at primary care and in hospitals for virological analysis through genome sequencing.
In summary, data from HNORS has provided a more complete picture of the major public health problem resulting from norovirus outbreaks in NHS hospitals in England. Such outbreaks are frequently reported from hospitals from nearly all highly industrialized countries. However, the magnitude of the problem that we describe in English hospitals has not been reported elsewhere. Whether that is a result of a smaller burden or just underreporting in other settings can only be known when robust surveillance systems similar to HNORS are implemented in other countries.
APPENDIX 1. Data fields for HNORS reporting form

APPENDIX 2. Matching method
Estimated ratio of non-reported outbreaks to reported outbreaks is estimated based on capture–recapture methods to calculate the total number of outbreaks. The total number of outbreaks was calculated as N = n*m/R, where n is the number of HNORS-only reported outbreaks, m is the number of laboratory-only reported outbreaks, and R is the number of outbreaks in both web and laboratory systems (Fig. A1).
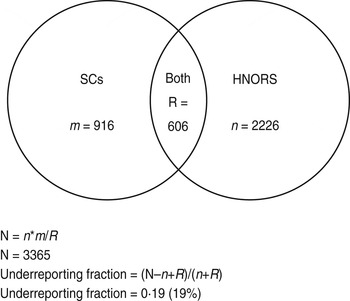
Fig. A1. Venn diagram illustrating capture–recapture and calculation of underreporting.
Outbreaks are considered to be a match (R) if they (a) occurred in the same Trust and hospital, and (b) where the first date of onset of illness in the reported outbreak and the specimen dates were within 14 days of each other, and (c) did not have different ward names. The ward name is often missing from the laboratory data; therefore, if criteria (a) and (b) were met and ward name was missing from the laboratory data, the outbreaks were still considered a match. This gives a large estimate for R, and therefore a conservative (low) estimate of the total number of outbreaks (N). The reporting ratio was then calculated as: (N – n+R)/(n+R).
ACKNOWLEDGEMENTS
The authors acknowledge Professor Sarah O'Brien for her helpful comments during the writing of this paper and Robin K. Adak for his assistance in introductory research. We also thank all those who continue to provide the information on outbreaks from hospital infection control teams who take the time to enter the data and colleagues in Health Protection Units for encouraging the reporting of outbreaks by hospital staff. Thanks are also due to all the epidemiologists and data administrators who have had a role in defining and maintaining outbreak surveillance at the HPA since 1992.
This research received no specific grant from any funding agency, commercial or not-for-profit sectors.
DECLARATION OF INTEREST
None.


