


1. Introduction
Historic
This paper reviews the evolution and development of various methods for establishing objective avalanche-forecast schemes. Some of the models grouped here have already been presented elsewhere. Models called type I in this text have been presented at Grindelwald (Reference Bois, Bois, Obled and GoodBois and others, [1975]) and subsequently at Cambridge (Reference Föhn, Föhn, Good, Bois and ObledFöhn and others, 1977). A preliminary version of the type II model was published in La Houille Blanche (Reference Bois and ObledBois and Obled, 1976) and the type III model is a new and still different approach.
List of symbols

In this paper, the set of explanatory variables is reviewed and extended, and all the models have been recalibrated on the same adjustment samples, and evaluated for the same test periods in order to allow proper comparisons.
Formulation of the problem
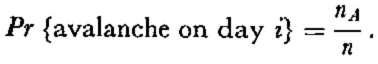
Following the reasoning of Reference LaChapelleLaChapelle (1977), our work leads to an evaluation of the avalanche potential, given the current meteorological and field observations, rather than an actual forecast. A problem, however, is encountered in the definition of avalanche hazard; it is not clear whether an avalanche 400 m long is twice as dangerous as one 200 m long, or if a day with ten observed avalanches is twice as dangerous as one with only five. It could also be argued that, in a tourist area, one avalanche on a clear day is potentially more dangerous than several during stormy weather. Furthermore, the problem may be posed for different scales of time and space. The methods will vary significantly if the hazard is to be evaluated for an entire state (e.g. Colorado), a particular itinerary (e.g. the Trans-Canadian Highway), or for a small region (e.g. a ski area). In this last case, if one avalanche occurs, it may be assumed that all similar slopes, or even the whole region, are suspect. It may therefore be considered that for an area which is not too small the region is either globally avalanche prone or not. For the time scale, one may be interested in following the change in the amount of hazard throughout the day, however, observational data are often limited to a daily basis. Here, the forecast will be presented as the percentage probability that at least one avalanche may occur during the coming 24 h in the area concerned.
The Parsenn area (Davos, Switzerland) with roughly 100 km2, was selected as a study area, since it is here that the Eidgenössisches institut für Schnee- und Lawinenforschung is located (Fig. 1). Simultaneous observations of snow and meteorological data as well as avalanche activity have been recorded there for more than 30 years. The selected area contains both gullies and avalanching slopes of various sizes, aspect, and steepness, and the number of potential paths is large compared with the daily avalanche activity (up to 18 avalanches per day). So, as noted by Reference BovisBovis (1977), it may be assumed that the activity during any given day does not lower the danger for the following day, except at the end of the winter season.

Fig. 1. Davos, Switzerland. Observed area with • Eidg. Institut für Schnee- und Lawinenforschung Weissfluhjoch (by permission of Eidg. Landestopographie)
Finally, it should be noted that we are trying to develop methods which are flexible enough to evaluate the hazard under all weather situations. Such a method must be able to evaluate the decrease in danger with time after a heavy snow-fall, as well as a possible isolated increase in a long period of relative stability. This distinguishes our approach from others which are entirely based on storm periods, neither do we use methods designed to study only one process at a time.
Similar work is in progress in other research groups (see Reference GrigoryanGrigoryan, [1975]) but little has been published so far.
2. Input data and variables
Before dealing with methodological aspects of forecasting, the information available and the input variables will be described.
Table I lists the raw input data from daily field measurements covering the winter periods between 1960–61 and 1973–74. These data are considered to be representative of the potential starting zone of avalanches (2000–3000 m a.s.l.) because they were measured at an approximate altitude of 2500 m.
Table I. Input data used to characterize meteorological and snow conditions

Explanatory variables
A given day i was characterized by a set of variables (see Appendix I). This stage constitutes an attempt to introduce physical knowledge about the assumed underlying phenomena; it is worthwhile noting that the change from raw data to evaluated variables is supposed to involve a substantial increase of information. For example, day i is characterized by its daily amount of precipitation, however, the quantity of fresh snow accumulated during a storm sequence (2, 3,…, d) is not redundant information as is, for example, the duration of the current dry period (i.e. since the last storm period).
It must be emphasized that derived or threshold variables may also represent non-linear effects rather than linear phenomena.
The meteorological situation is described by a large number of variables; thermal effects, for instance, are well defined, whereas this is not so evident for mechanical effects like snowdrift. On the other hand, the description of the snow cover is oversimplified, systematic data are lacking and the variables involved are only indices of stability or instability of the snow-pack.
Avalanche data
Every observed avalanche, natural or artificial, of the area under investigation is on file with a code number describing the morphological aspects as well as the date of occurrence. If the latter is presumed rather than observed, a number of uncertainties may be introduced, especially during storm conditions. The true data for the avalanche occurrence may have been missed, and the time lag between occurrence and observation may be as much as two days. This is one of the reasons for working on a daily basis even though some of the other variables are available on a finer time scale.
Ideally it would be advantageous to enter the information about artificially-triggered avalanches. This would be possible if avalanche control was performed systematically every day at a sufficient number of representative locations. In our case, however, avalanche control was not systematic and therefore we have only considered natural releases. Furthermore, it is also dangerous to use the recorded number of natural avalanches on a given day as the degree of avalanche hazard, because the uncertainty can be as high as 100%. Even a stratification of avalanche days according to the number of observed avalanches, as suggested by Reference BovisBovis (1977) can be deceptive.
These are the reasons why avalanche activity has been characterized as days when at least one avalanche is observed.
Removal of seasonal trends
It is clearly not feasible to consider the winter season (November to June) as an homogeneous period. Different variables such as air temperature, solar radiation, etc., show important seasonal trends. In order to cope with this problem without having to work on avalanche samples which are too small, the input information (1961–74) has been subdivided into bi-monthly periods. For research purposes, the two marginal periods (November–December and May-June) were neglected because of the difficulty in defining the exact beginning and end of winter. The remaining periods yield from the 14 winters:

Data from winters 1961–72 were used as adjustment samples whereas winters 1973 and 1974 were considered separately as a check on the models.
3. Preliminary analysis
There exists a real danger at this point of being overwhelmed by the large quantities of data contained in a sample of 50 variables × 800 d, and in attempting to be exhaustive there is a risk that some variables may be redundant. A certain condensation of the information is therefore required. Further, the use of discriminant models was not obvious at first, but through various methods of treating the observations, we were eventually led to this conclusion.
A first method consists in looking at each variable separately (Fig. 2), but this does not take into account intercorrelations between the variables.

Fig. 2. Histograms for three raw variables and three different weather types.
Intrinsic analysis of the variables
Let every day i be characterized by a set of p variables (p ═ 50) such that
may be considered as a point in the space Rp . Conversely, each variable l is given by N observations:
is a point in the space RN .
The above set of variables contains either absolute, interval, or ordinal variables and their values may either be continuous or discrete (Reference AnderbergAnderberg, 1973). Assuming that standardization provides us with variables which carry the same information as before, their linear correlation coefficient will be considered meaningful. A somewhat cruder but sometimes more realistic coding will be presented later (p. 321).
The redundancies in our set of variables will be investigated in order to determine which information is independent. This kind of analysis has to be performed because, in a subsequent step, squared distances in Rp will be evaluated between days or groups of days.
As a two-dimensional example, let us assume that R2 corresponds to two strictly independent variables. The distance between A and B depends as much on X1 as on X2 ,
Adding a new variable X3 which is either strongly correlated with, or identical to X2 , and then putting in the same way X4, X5,……, Xl , the usual distance becomes
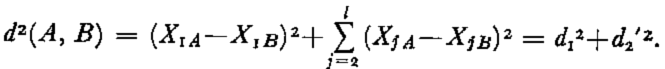
The relative influence of d 1 2 compared to d 2(A, B) is markedly reduced, although it is actually the only d due to an independent effect. Small perturbations such as measurement noises on the variables X j (j > 1) may cause non-significant deviations in d 2′2 of the order of d 1 2. Thus, the standardization of variables is not able to resolve completely the problem of the comparison of different data units. Even though scaling effects will disappear, dimensionality effects remain. To overcome these problems, a redundancy analysis may be performed either visually by graphical construction, or by using computer algorithms.
A first step consists in performing a principal-component analysis to determine the most likely number r of significant orthogonal factors. Various methods, mostly heuristic, agree on a number in the range 15 to 17. Unfortunately, each factor is not associated with only one variable and vice versa, so it becomes necessary to optimize the number of variables between r ≈ 17 and p = 50.
Different techniques presented by Reference JollifeJollife (1972) were applied using a number of refinements. A different, but theoretically more sound approach was proposed by Miller (unpublished) and generalized by Reference Robert and EscoufierRobert and Escoufier (1976). They define the redundancy of a set of variables given another set as the proportion of variance of the first set which is explained by the second. This method was implemented in an iterative manner, looking first for the variable that best correlates with the other 49. The next step sought the two variables that best correlate with the remaining 48, i.e. which redundancy with the other 48 is maximized, and so on till the number of variables of the second set has been properly reduced. This led us to keep 35 variables from amongst the 50 proposed, and those retained are indicated by an asterisk in Appendix I. They will be used to develop the typology associated with type II models and for the working space of type III models.
Visualization of observations
The principal-components analysis permits the display of the observation points in the factorial planes F 1/F 2/F 3/F 4, …. These reference axes are not original variables but independent linear combinations of them. So, in order to allow their interpretation, the projections of these original variables which are most correlated with F 1/F 2 are displayed in this plane. In this way, the avalanche variable may be taken into account only in an exogeneous way; every day, represented by a point, is coded differently whether an avalanche occurred or not. In Figures 3 and 4 the avalanche days show a somewhat different distribution from the non-avalanche days. There is no significant separation, but rather there are density changes suggesting a possible partition into two or three groups. Another example of this is the segregation in relation to the precipitation values in Figure 5.


Fig. 4. Principal component analysis of the March-April sample.
-
(a) Days with observed avalanches.
-
(b) Days without observed avalanche.
-
(c) Interpretation of factor axes F1 and F2 (in Figures 4a, 4b, 5, and 15).

Fig. 5. Avalanches occurring with and without precipitation in factor axes of Figure 4.
Such preliminary analyses, although not conclusive, are of essential importance to the choice of any forecasting model in that they provide a first insight into the appropriate type of model to be selected and into the available forecasting power. A preliminary analysis also shows that if there were different avalanche processes, the classification into dry- and wet-snow avalanches is not necessarily the most appropriate but is simply a starting point and could be affected by observational uncertainties (some of them can be detected in Figure 5).
Discrete coding of the variables and associated analyses
At first, a simple technique to display the differences between avalanche and non-avalanche days was as follows: the histograms of a variable Xl in a sample of non-avalanche days was compared with its histogram in a sample of avalanche days (Fig. 2). The distance between the two distributions might be measured by a x2-test which quantifies the relationship between the avalanche phenomenon and the variable under consideration. It showed, however, that we would probably be led to compare not only the differences between the means of the distributions (of avalanche versus non-avalanche days) but differences between the whole distributions because of the asymmetry of many of them. One way to avoidth is is to transform some of the variables.
Application to the analysis of variables, including the avalanche variable
A more sophisticated technique for the comparison of histograms is a multidimensional expansion of the comparison, i.e. a correspondence analysis (see, for example, Lebart and Fenelon, 1971). The correspondence analysis is applied to the whole set of variables (Xoj , j = 1, …, p), plus an exogeneous variable which is added to describe the number of avalanches on day i.
From a theoretical standpoint, the correspondence analysis is only applicable to contingency tables. Additional problems arise when used with data other than frequency data. To cope with this drawback, Nakache (1972) and Reference HillHill (1974) proposed the merging of data into K classes:
and

Thus a table with Km (m = p + 1) variables may be drawn up, assuming values of either 0 or 1. Performed like this, the correspondence-factor analysis displays each variable, usually in the plane of the first two factors, as K instead of only one point. For our purpose, K will be limited to the three classes which are illustrated by the following examples:

For theoretical reasons, the three classes should fulfil equal membership, but a number of variables can meet this requirement only approximately.
In the factorial plane F 1/F 2, each variable X 1,……., X p is then displayed by a trajectory of three points. The distance between two trajectories associated with any two variables gives an index of their statistical dependence (Nakache, 1972).
The values of the two variables considered may prove either to be strong, medium, or weak at the same time and over the complete set of N observations. Figure 6 illustrates two examples, for January and March. In March, the division of the avalanches into two groups (dry-snow and wet-snow avalanches) is relevant, the variable “dry-snow avalanche” correlates well with the fresh-snow depth, whilst the variable “wet-snow avalanche” is strongly correlated to the cumulated, positive temperatures (degree days). Displaying the relation between two variables by classes in this way is rather similar to creating a rank-order correlation and is called regression by “correspondence analysis” (Reference Brenot, Brenot, Cazes and LacourlyBrenot and others, 1975).

Fig. 6. Visualization of relations between avalanches and elaborated variables by correspondence analysis.(a.) January. (b.) March.
Application to the treatment of observations
Instead of looking for relationships between variables, we can use the above transformation as an alternative way of standardizing the variables. Each observation is characterized by pK Boolean variables, indicating in which class of each original variable the observation falls. At this stage, only the explanatory variables will be used and the avalanche variable will not be considered. A theoretical justification for such a coding, consistent with type I and II models, will be given in the next sections. It must also be pointed out that all these Boolean variables now have a similar distribution dependent on the number of classes (see Fig. 7). In this paper, only three classes will be considered.

Fig. 7.
-
(a) Example of the discrete coding of any continuous variable into k classes Xj l (l ═1,…., k); k ═ three, classes.
-
(b) Resulting distributions of any Boolean variable Xjl, ∀l ≤ k; k = two, three, or four classes.
A correspondence analysis may also be applied to this modified data array to concentrate the information on the first few factor scores which may represent the observations satisfactorily. These factor scores are, like principal-component scores, continuous data, rather symetrically distributed and appropriate to the approach used in models of type III.
In spite of the above technical considerations the basic underlying question in choosing such a coding is: Is it informative to know that there is 118.5 mm of water equivalent, or just to know that the snow-fall was greater than 80 cm in two days? Do we need a minimum temperature with three figures or just “low, around 0°C, above 0°C” … ?
If the second approach is sufficient, as suggested by Reference Yefimov and KozikYefimov and Kozik (1974), our developments are simply objective and automated versions of their manual treatment. A similar approach involving Boolean variables has also been attempted by Reference Grakovich, Tushinsky and TroshkinaGrakovich (1974). All these analyses are, however, descriptive, in that they attempt to display the information in a more objective way, and they help in choosing how to set the decision problem.
4. Type I models
Discrimination between two groups (avalanche day/non-avalanche days)
The forecast problem may initially be approximated by considering only two event categories (avalanche versus non-avalanche days) and then seeking the best associated discriminant variables. This may be supported by considering the first factorial plane for the January–February period, where two populations are likely to differ despite the plane being non-optimal for discrimination (Fig. 3).
Theoretical considerations
The theory of discriminant analysis will not be given here in full (see Reference AndersonAnderson, 1958; Reference RaoRao, [c1973]; Reference RomederRomeder, [c1973]). However, a few of the problems which may be encountered will be mentioned, and these refer mostly to the simplified two-group case.
The selection of variables and associated problems have been discussed in a previous paper (Reference Bois and ObledBois and others, [1975]). The backward selection of variables, starting with the complete set of all 50 variables, was abandoned in favour of an upward, stepwise selection because of computer time requirements. First, it was necessary to determine the number of variables to be introduced. Because of the non-normal distribution of the variables, the usual tests such as Wilks A-test (for BMD) or the Mahalanobis D 2 (related to Hotellings T 2-test) have been cautiously applied, even though Hotellings T 2-test is rather insensitive to the multi-normality requirements (Reference MardiaMardia, 1975).
A first method could consist of using normalized variables to transform the input variables X into their principal components Z. Alternatively, either a discrimination method suited to non-normally distributed populations (logistic discrimination, e.g. Reference AndersonAnderson (1974)) or other methods using exponential laws may be applied. Unfortunately, owing to the large variety of distributions encountered amongst the variables, no distribution may be preferred over another.
Thus, because the usual tests based on probabilistic assumptions could not be fulfilled, non-parametric methods were used. One for them consists of calibrating the model against a calibration sample and then applying it to a test sample. The introduction of new variables ceases when the misclassification rate of the test sample may no longer be decreased. However, the discriminant model obtained in this way is still slightly biased, in that it has been optimized for a given test sample.
Another problem is related to the selection of the group of non-avalanche days as their relative number is larger than 80% of all the days. When taking them all into consideration, the resulting selection could be biased in favour of the larger group (Reference MillerMiller, 1962). In order to give equal weight to the non-avalanche days and equal a priori probabilities to both groups, one non-avalanche day out of five was selected. The selection of these days was not random, as proposed by R. G. Miller, but taken every fifth day so long as this day was not itself, or did not precede, an avalanche day. This has to be done because most of the variables taken on contiguous days inside each bi-monthly period, appeared strongly autocorrelated. Since some of the variables were strongly discontinuous as well, some values of the autocorrelation coefficients are given for the first principal components in Table II.
Table II. Serial correlation of the first three principal components of the 50 Variables

It is known, both from regression analysis (which applies to the case of discrimination between two groups) and from discrimination analysis (Reference Basu and OdellBasu and Odell, 1974), that the effect of intra-class correlation among calibration samples has considerable influence on the sample variances of estimates. This may be accommodated in the non-avalanche group since the serial correlations collapse almost to zero after about five days. However, most of the avalanche days appear in sequences and, given the small number of avalanche occurrences, the withdrawal of any one day is not acceptable.
The last problem arises if the initial samples themselves are misclassified. Reference LachenbruchLachenbruch (1974) demonstrated that, although the Mahalanobis D 2 discriminant function as well as the error rates on the calibration samples are appreciably affected, the error rates for the test samples are only slightly altered, even if the rates of a priori misclassification are different for the two groups. In the case considered, it is essentially the avalanche group which is subject to those observational errors.
One possible way which was tried in an attempt to overcome this problem consisted of using weighted avalanche samples. For example, the days during which there was uncertainty about the recorded avalanche occurrence received a weight equal to one, whereas the days when there was no doubt about avalanche occurrence were given a double weight by adding such days into the sample of avalanche days twice. A similar method may also be used to take into account the level of avalanche activity; the weight being equal, then, to the number of avalanche occurrences for the day considered. Unfortunately, this approach still increased the intraclass correlation discussed above.
Most of the problems mentioned above still exist in the multiple-groups case, although they will not be mentioned further.
Survey of results based on continuous data
The samples used for calibrating and testing the models are shown in Table III.
Table III. Samples used for testing and calibrating type i models

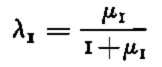
Various indices may be used to interpret the results. Since there is only one discriminant axis, corresponding to the first eigenvector u 1 associated with the first eigenvector µ1 of the matrix product W−1B (W: within; B: between groups variance-covariance matrices), the quantity
may be considered to be the discriminant power of the new variable ϒi = u 1 t X IV . The correlation structure of this discriminant axis may also be studied in terms of the original, elaborated variables (see Reference Bois, Bois, Obled and GoodBois and others, [1975]).
However, these total correlations must not be considered in an absolute sense if the variables are intercorrelated. In the case of two groups this is more easily seen by considering the discrimination between the two groups as equivalent to a multiple regression with an artificial variable ϒ:

where n 1 and n 2 are the respective numbers of individuals in each group. The set of regression coefficients is easily deduced from the coefficients of the two discriminant functions and may be interpreted in terms of partial correlations using a convenient standardization. Some of these results are given in Appendix II.
Results from test samples are presented in Figures 8a and 9a. These will be considered subsequently to be reference outcomes, given that discrimination in two groups is the simplest treatment which may be envisaged.

Fig. 8. Computed probabilities of avalanche occurrence and observed avalanche days for winter 1973.
-
(a) Model I (continuous against qualitative variables).
-
(b) Model II (2 stage against 1 stage model).
-
(c) Model III.

Fig. 9. Same as Figure 8 for winter 1974.
It may be concluded that in January and February avalanches occur when there is a large amount of fresh snow and a low air temperature. It can be observed that on the calibration sample, misclassification is essentially due to avalanche days (37 out of 131 against 15 out of 177 for non-avalanche days) showing that some of them do not fit the previously-defined type. In March and April, the interpretation is less simple, since two competing effects are clearly present. For example, warm, sunny weather favours avalanching whilst warm yet snowy weather prevents it. Partial correlations therefore have to be considered carefully.
All this suggests that a classification into avalanche and non-avalanche days is insufficient, but a more refined approach, used in previously published models, leads to similar conclusions. Avalanche days may be subdivided into two groups (wet- and dry-snow avalanches), as opposed to one group only of days with no avalanches recorded. One disadvantage lies in the fact that numerous misclassifications and uncertainties appear in the original avalanche data. The second disadvantage is that all the days without avalanches are considered to form a homogeneous population. Thus it seemed more appropriate to ask why warm days may cause avalanches or not and why cold days with fresh snow available either produce avalanches or not. This will be discussed later.
Survey of results based on categorized data
If, in the two-groups case, linear discriminant analysis on continuous data may reduce to a multiple correlation, as seen in the previous section, there is another possible interpretation, which may also be generalized to the multiple-groups case. This considers the method to be a canonical correlation analysis between a first set of variables Υk, k = 1, …, Ng , indicating the group, and a second set formed by the variables X j , j = 1,…….., P.
The Υk variables take Boolean values: Υik = 1 or 0 depending on whether the ith observation belongs to group k or not. It may thus seem consistent to treat in the same discrete way the second set of variables, using the discrete coding described in Section 3. The discriminant function will be defined as usual in the space of the discrete data Rpk , but instead of a linearly varying continuous function, the result is a step function. When transferred in the space of the original variables Rp , it provides, instead of an hyperplane, a surface made of independent facets. This shows that the loss of information about the variables is compensated by the possibility of including non-linear effects.
The discrete results shown in Figure 8a (dotted lines) appear to be slightly different from the continuous ones, partly because the selected variables are not exactly the same in the two cases. Some avalanches detected by one technique are missed by the other, but the reverse is also true. The results are on the whole less satisfactory, although the response of the qualitative data is sharper but sensitive to the class boundaries used in the coding of the continuous variables.
5. Type II models
Use of an objective avalanche classification
This technique is significantly different from the previous one since it attempts to enter some information about triggering mechanisms. The basic assumption is that avalanche days may be subdivided into different types, mostly related to the prevailing weather and snow conditions. A similar classification has already been proposed (Reference Quervain, Quervain, Chairman, LaChapdie, Losev and ShodaQuervain and others, 1973), but it attempts to be exhaustive and therefore considers types of avalanches which are not likely to occur in the Davos area. Furthermore, it may also call for information not available from the limited, though numerous variables which were used. It was, therefore, decided to seek an intrinsic “objective" classification, using only the available data (observed avalanche days as characterized by the set of our variables), and numerical algorithms. Thus, the classification does not tend to depend on any a priori assumptions introduced by the physicist, and it may be reproduced without further changes by anybody.
Non-hierarchical clustering methods
A description of clustering methods is given by Reference AnderbergAnderberg (1973), although the “dynamic clusters method”, developed by Reference DidayDiday (1974), was finally chosen mainly because of its probabilistic implications and its mathematical basis.
A brief description of the algorithm to illustrate the principal steps and iterations (i) :
NI = 1

It should be noted that parameters must be chosen before processing the algorithm:
-
(a) NI, the number of random initializations wanted. This number was limited to ten; it is evident however that the number of strong patterns increases and the number of individuals in each decreases, for increasing NI.
-
(b) NK, the number of calibration samples (between 10 and 15 for each kernel).
-
(c) NG, the number of kernels and therefore the number of groups wanted.
Problems encountered. The first problem, already mentioned in Section 3 concerned the choice of the sample space R l where clusters are sought. Dimensionality effects may introduce either deliberate or non-intentional weighting of variables which will change the existing clusters completely. The choice of the appropriate number of clusters poses an additional problem which will not be discussed extensively in this paper (see Reference vogel and WongVogel and Wong, unpulished; or Reference Fromm and NorthouseFromm and Norhouse, 1976). In the case considered, experience was gained by applying the method with known numbers of generated clusters, usually Gaussian but more or less separated, and heuristic rules were derived by simulation to delect the true number of clusters. However, obvious results from simulated samples become fuzzy when applied to real data. Some additional experience also emerged from hierarchical-classification trials.
In the case considered, the avalanche days were described by the reduced set of 35 variables, further transformed into l (15 < l < 35) principal components scores, or scores of correspondence analyses (as described in Section 3). The scores were either standardized to √λk, their corresponding eigenvalue, or to 1.0, in order to try different weighting effects. Thus, only the more stable patterns were considered.
The clustering programmes are usually performed in a R p or R l space with an Euclidian measure associated to the identity matrix I. Trials with adaptative measures of distance (i.e. which attempt to fit the proper variance–covariance matrix of each cluster) have not proved satisfactory since they are too sensitive to a few outlying clusters.
Thus, it was preferable to consider only the strong patterns obtained from the dynamic clusters method as kernels for a discriminant analysis. This last treatment classifies all the data units by taking into account either their mean distance structure (pooled within group variance–covariance matrix W –1) or the proper measures of each group separately (W k −1, k = 1,….., NG). It may be seen in the discriminant planes (Figs 10a and Figs 11a) that the density functions of these clusters are somewhat different, thus substantiating the use of quadratic discrimination (Reference RomederRomeder, 1973). This re-allocation provides the following groups outlined below.

Fig. 10.
-
(a) Three groups of avalanche days (January–February) in the first discriminant plane.
-
(b) Six groups of avalanche and non-avalanche days.

Fig. 11.
-
(a) Four groups of avalanche days (March-April) in the first discriminant plane.
-
(b) Eight groups of avalanche and non-avalanche days.
Results. In January three or possibly four groups were detected and may be represented by their projections in the first two discriminant axes. Another attempt of interpretation is also given by the following classification tree:

In March-April, four or (less likely) five groups were detected:

The fourth group is easily understood as this bimonthly period allows for maximum temperatures greater than 0°C; such values are rarely observed in January–February. Groups 1 and 2 correspond quite surprisingly well to the respective groups of January–February. Group 3 is, however, different as prolonged periods without precipitation in March–April usually favour positive temperatures.
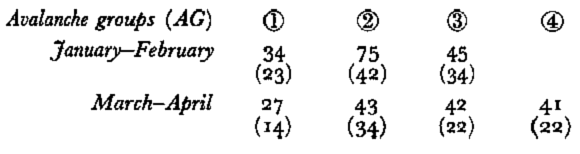
In Table IV, the number of avalanche days is given for each group, but, as avalanche days may be contiguous, the corresponding number of avalanche sequences is also given in parentheses.
Table IV. Number of individuals (days) in the different groups
Conclusions. It appears that avalanche days may roughly be clustered in three to five groups which mostly correspond to the prevailing weather situations. However, because of the relative continuity between the different types or groups, and because of uncertainties of actual dates of occurrence of some avalanches, the proposed classification tends to be fuzzy. The stability should also be increased by adding new samples. Nevertheless, the classification obtained, in general corresponds well to the propositions made by the Commission International des Neiges et Glaces.
Development of type II models
The next problem consists of determining, whether the avalanche triggering phenomena are similar within each group or if they differ.
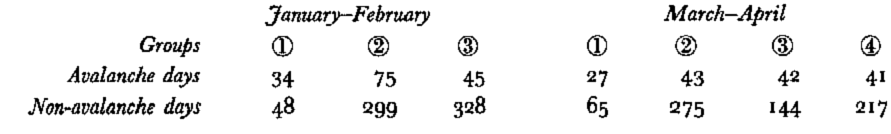
Assuming that the previous classification of avalanche days may be applied to each day, whether avalanching or not, the avalanche groups AG k were used as calibration samples to allocate all the other days (≈650) to these groups. Thus a given day i, although without avalanches, may appear to be of the same type as the avalanche days of group AG k .
Thus, the question arises of why, on similar days, some days are avalanche prone whilst others are not. From the non-avalanche days associated with group AG k (Table V), a reduced sample of days without avalanches NG k was taken, and discriminant analysis was applied to it (k = 1,……, 3 or 4) (Figs 10b and 11b).
Table V. Classification of all the days into avalanche groups AG
As a result, the following two-stage procedure is proposed:
-
1. Allocate a given day i to a snow–meteorological type AG k (k = 1 …, 3 or 4) using a first set of variables (ten or eleven seem sufficient).
-
2. If day i belongs to group k, operate the kth discriminant model AG k /NG k in order to decide whether avalanches will occur or not. When performing this second step, the proper variables (usually four to six) associated with the kth model are used and their influence may be interpreted physically.
These models have been implemented in an interactive mode on a small computer. First, experience was gained by processing the winters 1961 to 1972 from the calibration data set. Afterwards, the winters 1973 and 1974 were run in simulated operational conditions (Figs 8b and 9b, continuous line).
This two-stage approach appeared to be very tutorial in addition to producing a probability index. First, it associates the day on hand with a given weather type, which may be checked by the forecaster. Further, the avalanche-non-avalanche model, only valid for a given weather type, displays in a separate way the influences which are most related to hazardous conditions. However, this presupposes clear-cut separations between the different weather types, and rather poor connections between the variables defining the weather type and the avalanche triggering mechanism inside this type of weather. Unfortunately, the real world is less predictable. Another possible approach, therefore, consists of considering only one level of discrimination between the six or eight groups of avalanche and non-avalanche days. It thus provides a unique model which attempts to allocate any given day to one of them, i.e. AG 1, or NG 1 or AG 2, or……, NG k . It is not easily interpreted, due to partial covariance effects, but compared with the two-stage approach, and allowing a similar number of variables, this direct approach gives results (Figs 8b and 9b, dashed lines) slightly inferior for the January–February periods, but somewhat more sensitive for the March–April ones.
The two-stage approach thus gives a slight, but not definite, advantage.
Use of categorized variables
A similar discriminant analysis between all avalanche and non-avalanche groups has been performed using the qualitative version of our explanatory variables and a one-stage approach. The comparison between models using continuous or discrete data is shown in Figure 12. For the March–April period (respectively dashed and dotted lines) the model based on qualitative data reacts well, is less damped, and sharpens the detection of some avalanche days, but unfortunately other avalanche days are completely missed.

Fig. 12. Comparison of the one-stage multiple types discriminant models using continuous or categorized data.
Additional theoretical work is required about an optimal choice of boundaries to split a continuous variable into K qualitative ones. Further, when one qualitative variable has been selected, the question remains whether or not all the others coming from the same original variable should be forced into the model.
6. Type III models
Non-parametric, local dynamic models
As mentioned in Section 3 and verified in Section 5 when presenting the days in the first discriminant plane, the density of avalanche days varies almost continuously although some regions are more dense than others. The strict classification of type II models, however, allowing a given day to belong strictly to one weather type may seem too rigorous and does not allow for the relative overlapping between different types.
Theoretical considerations
One approach, termed a “neighbourhood” method, consists of assuming that there is no definite separation between groups but rather a continuously changing relative density of avalanche days (Fig. 13).

Fig. 13. Relative density of avalanche and non-avalanche days in factor axes of Figure 3.
Having chosen an appropriate predictor space R l , and given a new day i, the method consists of extracting its nearest neighbours, no matter whether with or without avalanches, to obtain an estimate of the local density, i.e. the conditonal probability at the point under consideration:
According to Reference Fix and HodgesFix and Hodges (1951), the number n of neighbours selected, among which n A were avalanching, must be sufficiently large to give an accurate estimate but must remain small compared to the size of the calibration file. The authors provide an heuristic rule for appreciating n.
Another problem concerns the number of dimensions to be used. In spite of recent developments (Reference CollombCollomb, unpublished), theoretical results tend to be either very poor or to have no practical application. One main result is that the standard error of estimate grows with power 4(l+ 4)−1 of a given parameter functionally related to the size of the calibration file. This feature considerably limits the number of dimensions l to be considered.
A further step may consist in examining the local discrimination among those n points, distinguishing the ones with avalanches from those without. This is a valuable procedure only if new information is added. As an example, let us consider discrimination between two Gaussian groups in R 2. This may be done either globally, by linear discrimination (global method), or by the above, local method. A day i will be correctly classified by both approaches (Fig. 14). However there is no purpose in trying to discriminate further within the spherical neighbourhood using the same variables, since no further underlying distribution may be assumed. However, by the introduction of new variables X l+1 , …, not already included in the R l space, the adjustment of a local linear discriminant model may appreciably improve the results.

Fig. 14. Distinction between local and global discrimination
Practical application to avalanche data
Let each day be characterized by its l = 17 first principal component scores, standardized either to
Although physically less meaningful, type III models gave equivalent performances at a much lower computation cost than type I and II models. In addition, a careful look at the closest neighbours of the past was also very instructive.
The results obtained for winters 1973 and 1974 are shown in Figures 8c and 9c.
Avalanche-prone situation or evolution ?
The day i has so far only been considered as an isolated point, either in R p or in R l , assuming its positioning to be related to avalanche activity; hence, mention has been made of avalanche-prone situations. However, the phenomenon may depend not only on the situation of day i but on what it was on days i—1, i—2, …. In order to examine this in the plane of the first two principal factors only (as interpreted in Section 3), the avalanche days were considered first, and each one of them was connected with its three predecessors (Fig. 15). Some peculiar trajectories resulted which appeared to be non-random and possibly to have some physical significance. This suggests that the phenomenon not only depended on the situation of day i but also on the evolution which led to day i. However, it has to be demonstrated further that it differs from the case of days without avalanches.

Fig. 15. Evolution of avalanche situation: trajectories of days culminating in avalanche occurrences.
This has been more extensively studied by Reference Bois and ObledBois and Obled (1976). Summarily, their conclusions are the following:
the running weather situations in winter time tend to follow a well established cycle:
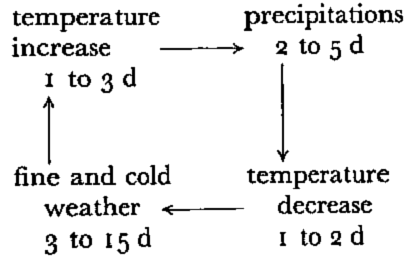
this holds true in springtime, except that clear weather may lead to warm afternoons; a number of avalanches (usually recorded as “dry”) need first precipitation, with a following secondary effect such as temperature change or wind action. They are obviously related to dynamic processes; on the other hand, the avalanches occurring during long sequences of clear weather are associated with more static, cumulative effects.
Such information might be used in a multidimensional, non-parametric model where not only the closest neighbours of the given day would be sought, but also a search would be made for the closest profiles or sequences.
7. Discussion and conclusions
The statistical approach has proved useful in coping with the problems of avalanche forecasting, at least for a given homogeneous region. Nevertheless, the closer the statistical model relates to the physical mechanisms, the more efficient it may be supposed in actual forecast. However, all the avalanche-triggering processes are still not fully understood or do not appear in our data due to the lack of appropriate measurements.
Various methods have been proposed and applied in order to try to bring out the main underlying phenomena. A number of points still remain unclear and need further consideration despite extensive study. The first concerns the explanatory variables used, the dimensionality of their set, and the proper measure to be used in the appropriate predictor space. The characterization of avalanche activity is also debatable, but is highly subordinate to the quality of the available data.
As for the models used, they all show a fairly good agreement with the observed avalanche activity. However, the type I models, which treat the avalanche–non-avalanche phenomena in an approximate way only, provide smaller probabilities, yet appear to be very robust owing to the large samples. Type II models are not considerably better than type I models, though they tend to be more explanatory and instructive in that they provide a comprehensive classification which can be easily interpreted and checked by the forecaster. This seems more satisfactory to the physicists, but the strength of the modelling should be increased by incorporating larger samples. This also holds true for type III, which appears promising but requires further development.
The use of qualitative data also appears promising but needs further refinement. It could allow the use of rough data (e.g. wind data on the Beaufort scale) which are more usually available than continuous measurements.
It should also be kept in mind that the results displayed were mostly obtained in blind tests during the 1973 and 1974 periods. Nevertheless, the comparison between the models appears difficult, since many criteria should be considered (such as overall efficiency, parsimony in the variable requirements, usefulness of sophisticated methods, etc.). No definite conclusions can be drawn, except that type II and III models probably fit the variety of actual phenomena better than type I models. However, a saturation level was reached regardless of the sophistication of the models used, and new developments should be expected to involve the actual use of models in operational forecasting.
The main drawback of these statistical approaches is their sensitivity to errors in the avalanche data. This suggests that more effort should be made to collect very accurate data on at least a daily basis. Another suggestion is that a given day should not be considered alone in an isolated way, but as the result of the past. The problem is that methods are available to study one time-dependent process at a time, whereas here different processes are running together, with different time lags, and very different relative importances—the delineation in well-defined successive weather types is only a first and crude approach.
In conclusion, one may wonder at the quantity of statistical considerations required by a problem apparently so simple as that of the short-term forecasting of avalanche hazards. However, despite sampling problems, unverified statistical hypotheses, and questionable physics, statistical models still remain the only feasible method. The lack of knowledge concerning the elementary phenomena and their mutual interactions is likely to delay, for some years, the use of deterministic forecasting models.
Acknowledgements
This work has been carried out in close collaboration between the Institut de Mécanique de l’Institut de Grenoble and the Eidgenössisches Institut für Schnee- und Lawinenforschung. We are deeply indebted to Professor M. R. de Quervain, Director of the Davos Institute, for his continuous support, to Drs Ph. Bois and D. Duband for their helpful statistical advice, and to the physicists and observers of Davos Weissfluhjoch for their useful comments and suggestions. Finally the authors wish to record their sincere appreciation for the comments given by the anonymous referees, which helped to improve the presentation and clarity of the paper significantly.
Appendix I
The explanatory variables used


Appendix II
Type I models

The variables selected are ordered according to their F-values. The sign displayed in parentheses indicates increasing (+) or decreasing (−) hazard when the variables increase, assuming that all the others remain constant (partial correlation).
Type II models
First level
Discrimination between the different groups of avalanche days:

Second level
Discriminant models between avalanche and non-avalanche inside each class of avalanche days:

Type III models
The lower number of avalanche days forecast, and yet the greater number of avalanche days missed, show that the coding chosen to express the results in terms of estimated probability is not exactly comparable to the one used with type I or II models. A search should be made for a suitable homogeuization.
Appendix III


