Dietary intake plays an important role in the prevention of chronic diseases(1, 2) and the adverse effects of children's unhealthy eating behaviours, in particular the increasing prevalence of childhood overweight and obesity, have become a significant public health challenge(Reference Wang and Lobstein3). Unfavourable diets in childhood may have long-term implications, especially as tracking of overweight from childhood to adulthood occurs, and thereby increase the risk of subsequent morbidity and mortality(Reference Berenson4, Reference Wright, Emmett and Ness5). The evidence of consistency in relation to dietary habits in children is limited and most studies report only poor to moderate stability over time, indicating that the diets of children are potentially modifiable(Reference Patterson, Warnberg and Kearney6).
Compared with food-based dietary guidelines and nutritional recommendations, many children generally consume too little fruit and vegetables, fish and fibre, and too much of foods high in fat and sugar(Reference Elmadfa, Meyer and Nowak7, Reference Pedersen, Fagt and Groth8). As improved nutrition is a key factor in promoting health, growth and development in children, there is an obvious need to address this issue.
It has been suggested that family factors and the nature of foods available at home, in schools and in fast-food establishments are some of the most significant determinants of the eating habits of children(Reference Taylor, Evers and McKenna9). In this context, weekdays and weekend days differ in many ways, both structurally and culturally, which may influence dietary intake patterns, for example through more access to food and snacks, together with likely expectations of fewer restrictions on weekend days than during weekdays. Periods of holidays and summer vacations have been associated with increases in weight status in both children(Reference von Hippel, Powell and Downey10) and adults(Reference Yanovski, Yanovski and Sovik11), and similar differences may apply on a smaller scale to weekends.
Previous research in children has suggested that snacking and other daily eating patterns differ on weekdays compared with weekend days in a way that may have an impact on the overall diet quality on these days(Reference Bjelland, Lien and Grydeland12, Reference Cullen, Lara and de Moor13). Moreover, Friday stands out as a weekday on which the diet may resemble both weekdays and weekend days in terms of diet quality. However, few studies have considered these issues of dietary intake. The objective of the present study was therefore to compare differences in diet quality on weekdays (Monday–Thursday), Fridays and weekend days in a simple random sample of Danish children.
Methods
Sample
Data for the present study were derived from the Danish National Survey of Dietary Habits and Physical Activity 2003–2008, which is a nationwide cross-sectional survey. The study population comprised a simple random sample of 4–14-year-old children, retrieved from the Central Office of Civil Registration. Participants received an invitation letter and were afterwards contacted by telephone. For the families who agreed to participate, written informed consent was obtained from a parent of each child prior to their participation. In comparison with census data from Statistics Denmark, the distribution of gender and age of the participants could be characterized as representative for the Danish population of children aged 4–14 years.
Assessment of dietary intake
Dietary intake was recorded every day for seven consecutive days in food records with pre-coded response categories, which included open answer options. Children and their parents were instructed in person by trained interviewers on how to complete the food records. The parents were responsible for completing the records and for deciding to what extent their children were capable of assisting. The food record was organized according to the typical Danish meal pattern (breakfast, lunch, dinner and in between meals). Each meal was divided into sections with headings such as beverages, bread, spreadable fats, meat and vegetables to make it easier to find and record the relevant foods, dishes and beverages. For food items not included in the pre-coded food record, the participants wrote the type of food and portion size eaten in open answer categories. The quantities of foods consumed were given in predefined household measures (cups, spoons, slices, etc.) or estimated from photographs in a picture book containing fourteen series of food photographs, each series showing four to six different portion sizes. As a supplement to the food record, participants also received a food recording booklet for the children to take to school or to other places outside their home on the days of assessment. Intakes of energy, nutrients and food items were calculated for each individual using the software system GIES version 0·995a (developed at the National Food Institute, Technical University of Denmark, Søborg, Denmark) and the Danish Food Composition Databank version 7 (www.foodcomp.dk). Validation of the method for children and adults is described elsewhere(Reference Rothausen, Matthiessen and Groth14, Reference Biltoft-Jensen, Matthiessen and Rasmussen15).
Besides energy intake and macronutrients, a number of food items were selected to give an indication of the diet quality. The selection of variables was based on the work of Sepp et al.(Reference Sepp, Ekelund and Becker16) and the Nordic Monitoring project(Reference Fagt, Andersen and Anderssen17), which has shown that the intake of certain food groups explains a considerable part of the variation in the relative content of total fat, saturated fat, added sugars and dietary fibre in the diet. The intake of these food groups is therefore particularly useful in the assessment of overall nutritional quality of the diet. Energy density of the diet was calculated separately for (i) solid foods and liquids consumed as food (e.g. soups and yoghurt) and (ii) beverages, including both energy-containing and non-energy-containing beverages (e.g. milk/juice and water/tea, respectively) and presented as kJ/100 g. Furthermore, dietary intake based on the average intake during the week was compared with the nutritional recommendations for added sugars, saturated fat, fish and fruit and vegetables(18, Reference Astrup, Andersen and Stender19).
Definition of weekdays and weekend days
Weekdays and weekend days were defined as Monday to Thursday and as Saturday and Sunday, respectively. Preliminary analysis showed that intakes on Friday differed from those on both Monday to Thursday and Saturday and Sunday. Therefore Friday was kept as a period of its own, instead of making a dichotomous weekday/weekend day variable.
Weight status
Information about the children's height and weight was obtained through a personal face-to-face interview with one of the parents, referred to as the ‘responding parent’, which was the mother in 87 % of cases. Prevalence of overweight and obesity in the study sample was defined according to international age- and gender-specific BMI cut-off values for children and adolescents(Reference Cole, Bellizzi and Flegal20) corresponding to BMI values of ≥25 and ≥30 kg/m2, respectively, for adults aged ≥18 years.
Parental education
The educational level of the responding parent was defined in four categories: (i) basic school (10 years or less of total education); (ii) vocational education, upper secondary school (10–12 years); (iii) short higher education (13–15 years, primarily theoretical); and (iv) long higher education (15 + years, primarily theoretical).
Definition of under-reporters and over-reporters
Prevalence of misreporters was assessed by evaluating the 95 % confidence limits of agreement between recorded energy intake and estimated BMR on the individual level. The Goldberg's cut-off 2 criterion was used(Reference Goldberg, Black and Jebb21), which takes into account age- and gender-specific values for physical activity. Physical activity level values corresponding to light physical activity were used to define cut-off values for under-reporters and over-reporters, respectively(Reference Torun, Davies and Livingstone22). Estimates of BMR were calculated from equations based on age, gender, height and weight(23).
Statistical analyses
The main analyses were performed separately for the three age groups, 4–6 years, 7–10 years and 11–14, years due to the wide age range of children in the study population and associated different degree of parental influence on the diet and diet recording. Differences between gender regarding height, weight and BMI were analysed using Student's t test, whereas differences between age groups regarding height, weight and BMI were analysed using one-way ANOVA and Tukey's post hoc test. Differences regarding parental education and weight status were assessed between gender and between age groups using the χ 2 test and Fisher's exact test.
Differences in energy intake, macronutrient intake and energy density for weekdays v. weekend days, Fridays v. weekdays and Fridays v. weekend days were analysed using Student's t test. For some of the food items, especially sausages, full-fat cheese, fries and fried potatoes and rye bread, a high percentage of the children (up to 79 % within the three age groups) had zero intakes during the week. To account for zero intakes, these variables were compared between weekdays, Fridays and weekend days using Tobit regression analysis, which includes the zero observations in the analysis by combining the binary information of intake v. zero intake with the quantitative intake values for the non-zero cases. Mean values and standard deviations were used to describe the diet, because some of the medians were equal to or close to zero.
Data were analysed separately for boys and girls due to significant gender differences in dietary intake in the preliminary analyses. Since the dietary intake analyses included multiple tests, Bonferroni corrections with k = 3 were performed. The unit g/10 MJ was used to take differences in total energy intake into account and to assess the quality of the diet, rather than absolute intakes. Data were analysed with the SPSS for Windows statistical software package version 19·0 (SPSS Statistics, Inc., Chicago, IL, USA) and the R statistical software version 2·13·2 (2009; R Development Core Team, http://www.r-project.org) with a significance level of P < 0·05.
Results
Study population
A total of 1294 children were invited to participate and 1006 (78 %) children accepted. After exclusion of incomplete dietary recordings, data from 784 (61 %) children with seven consecutive days of dietary recording and information about BMI and parental educational level were available for analysis. The group of excluded children (n 222) comprised 27 % 4–6-year-olds, 32 % 7–10-year-olds and 41 % 11–14-year-olds. Characteristics of the study population are presented for each age group in Table 1. Within each age group no gender differences were found regarding height, weight, BMI and parental education. Furthermore, no gender differences were observed with regard to weight status for the 7–10- and 11–14-year-old children, but there were more overweight and obese girls than boys in the 4–6-year-old children (P = 0·034). Height, weight and BMI were all significantly different between age groups (P < 0·001), whereas there were no significant differences between age groups regarding gender distribution, weight status and parental education. The prevalence of identified under-reporters was 1·0 % in the 4–6-year-olds, 3·8 % in the 7–10-year-olds and 16·6 % in the 11–14-year-olds. The number of under-reporters did not differ between genders.
Table 1 Characteristics of the study population: children aged 4–14 years, the Danish National Survey of Dietary Habits and Physical Activity 2003–2008
a,b,cMean values within a row with unlike superscript letters were significantly different between age groups (P < 0·001).
*Differences between age groups tested using the χ 2 test for gender distribution and parental education, by one-way ANOVA for height, weight and BMI, and by Fisher's exact test for weight status.
†Weight status according to international cut off values(Reference Cole, Bellizzi and Flegal20). Weight status differed significantly between genders in the 4–6-year-old children (P = 0·034), but not in the 7–10-year-olds (P = 0·975) or in the 11–14-year-olds (P = 0·705).
‡Parental educational level: basic school = 10 years or less of total education; vocational education, upper secondary school = 10–12 years; short higher education = 13–15 years (primarily theoretical); long higher education = 15 + years (primarily theoretical).
Based on the average intake during the week, boys had a significantly higher total energy intake than girls in all three age groups (4–6 years: boys 7·87 (sd 1·87) MJ/d v. girls 6·91 (sd 1·34) MJ/d, P < 0·001; 7–10 years: boys 8·79 (sd 1·94) MJ/d v. girls 8·19 (sd 2·03) MJ/d, P = 0·01; 11–14 years: boys 9·57 (sd 2·83) MJ/d v. girls 7·74 (sd 1·99) MJ/d, P < 0·001).
A large proportion of the children did not meet the nutritional recommendations of keeping the percentage of energy from added sugars below 10 % (66 % of the children) and the percentage of energy from saturated fat below 10 % (96 % of the children)(18). A total of 89 % of the children did not reach the recommended intake of fish of at least 200 g/week, and the recommended intake of fruit and vegetables was not met by 66 % of the 4–10-year-old children (recommended intake of 400 g/d) and by 91 % of the 11–14-year-olds (recommended intake of 600 g/d)(Reference Astrup, Andersen and Stender19).
Food and nutrient intakes
Mean intakes of energy, macronutrients, selected food items and energy density of the diet on weekdays, Fridays and weekend days are presented for each age group in Tables 2–4. The following results were all statistically significant at a significance level of P < 0·05.
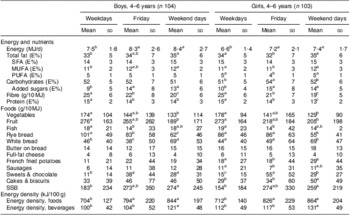
Table 2 Dietary content by gender on weekdays (Monday–Thursday), Fridays and weekend days (Saturday and Sunday): 4–6-year-old children, the Danish National Survey of Dietary Habits and Physical Activity 2003–2008

E%, percentage of energy intake; SSB, sugar-sweetened beverages.
a,b,cFor each gender group, mean values within a row with unlike superscript letters were significantly different (P < 0·05).
Table 3 Dietary content by gender on weekdays (Monday–Thursday), Fridays and weekend days (Saturday and Sunday): 7–10-year-old children, the Danish National Survey of Dietary Habits and Physical Activity 2003–2008

E%, percentage of energy intake; SSB, sugar-sweetened beverages.
a,b,cFor each gender group, mean values within a row with unlike superscript letters were significantly different (P < 0·05).
Table 4 Dietary content by gender on weekdays (Monday–Thursday), Fridays and weekend days (Saturday and Sunday): 11–14-year-old children: the Danish National Survey of Dietary Habits and Physical Activity 2003–2008

E%, percentage of energy intake; SSB, sugar-sweetened beverages.
a,b,cFor each gender group, mean values within a row with unlike superscript letters were significantly different (P < 0·05).
Weekdays v. weekend days
For both boys and girls in all three age groups, energy intake was consistently higher on weekend days than on weekdays. Furthermore, the percentage of energy from added sugars was higher, whereas the fibre content and the percentage of energy from protein were lower on weekend days compared with weekdays. The diet also contained a higher amount of sugar-sweetened beverages (SSB) and white bread, and a lower amount of rye bread on weekend days v. weekdays. In addition, the energy density of foods as well as of beverages was higher on weekend days than on weekdays. Boys and girls aged 4–6 and 7–10 years also had higher intakes of sweets and chocolate and lower intakes of fruit and vegetables on weekend days compared with weekdays.
Fridays v. weekdays
Energy intake was higher on Fridays than on weekdays for both boys and girls in all three age groups. Differences that applied to all groups also included a higher percentage of energy from added sugars, a lower percentage of energy from protein and a lower fibre content of the diet on Fridays than on weekdays. In addition, the intake of fruit was lower for the 4–6-year-olds and the 11–14-year-old girls, and the intake of rye bread was lower for all groups except for the 4–6-year-olds and the 11–14-year-old girls. The diet contained significantly higher amounts of sweets and chocolate on Fridays than on weekdays for all groups, although this was not significant for the 11–14-year-olds. The energy density of foods was higher on Fridays than on weekdays for all age and gender groups, and the 11–14-year-old girls also had a higher energy density of beverages on Fridays compared with weekdays.
Fridays v. weekend days
Energy intake did not differ significantly between Fridays and weekend days, except for the 7–10-year-old boys, who had a higher energy intake on Fridays than on weekend days. For both boys and girls in all three age groups intake of white bread was lower on Fridays than on weekend days. The fibre content of the diet was higher on Fridays compared with weekend days, although this was not significant for the 11–14-year-old boys, whereas intake of cakes and biscuits was lower for all groups, except for the 4–6-year-old boys and the 7–10-year-old girls. The energy density of foods was lower on Fridays than on weekend days in the 7–10-year-old girls, whereas the energy density of beverages was lower in the 4–6-year-olds and 7–10-year-old girls.
Discussion
Results from the present study showed that there were significant, distinct differences and characteristic patterns in the children's diet quality during weekdays, Fridays and weekend days. Results of the present study indicate that quality of the diet consumed during weekend days was lower than on weekdays, whereas the diet quality on Fridays appeared to be at an intermediate level. Furthermore, average energy intake and energy density were consistently higher on weekend days than on weekdays and intermediate on Fridays. The tendency of increasing energy density from weekdays to weekend days further supports the finding of decreasing diet quality from weekdays to weekend days, because higher energy density has previously has been associated with lower dietary quality in children(Reference Patterson, Warnberg and Poortvliet24). Moreover, a high intake of energy-dense foods has been convincingly identified as a factor promoting weight gain(2).
The majority of the children did not meet the dietary recommendations for added sugars, saturated fat, fish and fruit and vegetables on a weekly basis. The present results therefore further emphasize the importance of considering the unfavourable dietary intake patterns during weekends and Fridays.
To the authors’ knowledge, the present study is the first on the diet quality on weekdays v. weekend days in a representative sample of children in Europe. Although few studies have addressed this issue specifically in school-aged children, similar findings for certain key variables such as SSB and the percentage of energy from fat have been presented previously(Reference Bjelland, Lien and Grydeland12, Reference Cullen, Lara and de Moor13). The tendency towards less healthy dietary habits during weekends compared with weekdays is also in accordance with other studies in pre-school children(Reference Sepp, Lennernas and Pettersson25–Reference Lehtisalo, Erkkola and Tapanainen27). A Scottish study of 5–17-year-olds showed no significant differences in energy intake, total fat, saturated fat and non-milk extrinsic sugars between weekdays and weekend days(Reference Macdiarmid, Loe and Craig28); however, the overall findings suggested that the weekend is a period with less healthy dietary patterns compared with weekdays.
In the present study, the significantly higher energy intake on Fridays and weekend days compared with weekdays stresses that not only did the children have less healthy dietary habits on Fridays and weekend days, they also consumed more in total rather than compensating by eating less amounts of more regular foods. This is of concern in the prevention of overweight in children because these dietary habits may promote positive energy balance, thereby increasing the risk of becoming overweight and obese. Furthermore, the finding that especially sugar-rich foods and beverages contributed more to the energy intake on Fridays and weekend days compared with weekdays is of concern. Findings from epidemiological studies clearly indicate that regular consumption of SSB may lead to weight gain and substantially increase the risk of developing chronic diseases(Reference Hu and Malik29). In addition, a high intake of added sugars may increase the risk of a nutritionally inadequate diet(Reference Mølgaard, Andersen and Barkholt30) and is found to be positively associated with multiple measures known to increase CVD risk in adolescents(Reference Welsh, Sharma and Cunningham31).
Some general environmental and structural differences between schooldays and non-schooldays may in part explain the findings that the dietary quality is lower on weekend days. Schooldays may be more structured and supervised, while parents’ attitudes towards healthy eating habits and the availability of different foods and beverages during weekends are most likely very important factors for the variation in dietary quality during the week(Reference Taylor, Evers and McKenna9). The perception that it is acceptable to lessen the restrictions during weekends on food groups that should be limited in the diet has been described in a combined qualitative and quantitative Danish study concerning parents’ motives to give their children sugar-rich foods(Reference Iversen, Matthiessen and Fagt32). The interviewed parents expressed the view that they felt capable of controlling their children's sugar intake. However, the dietary intake data revealed that the children had a considerably higher intake of added sugars than recommended. The parents also expressed the view that it has become a tradition to give children sugar-rich foods during weekends and that a ‘culture of cosiness’ is seen as a legitimized cause for this. The promotion of healthy eating habits might benefit from more focus on changing this attitude.
Weekends also include a tendency for children to be less physically active than on weekdays and spend more time in sedentary behaviours, including television viewing and other screen time(Reference Rey-Lopez, Vicente-Rodriguez and Ortega33–Reference Soric and Misigoj-Durakovic35), thereby further increasing the risk for weight gain during weekend days. Moreover, extended periods spent watching television has been associated with generally having less healthy food preferences and food habits in school-aged children(Reference Hare-Bruun, Nielsen and Kristensen36); thus these factors may act together in an undesirable direction.
In dietary assessment, Fridays are usually considered equal to other weekdays. However, results from the present study showed that the diet on Fridays appeared as a mix of the diet on weekdays and weekend days. Furthermore, according to the variables analysed in the present study, there were more significant differences between Fridays and weekdays than between Fridays and weekend days. This suggests that in assessment of dietary intake, the weekend is not necessarily limited to Saturdays and Sundays, but may include Fridays as well. The issue of whether dietary intake on Fridays should be considered as belonging to weekdays or weekend days needs to be addressed in future dietary assessment studies.
As for all dietary assessment studies, a limitation of the present study is that self-reported food recording may potentially be subject to misreporting. However, the degree of under-reporting seemed to be rather limited with the exception of the group of children aged 11–14 years, which is recognized as a particularly challenging age group when assessing dietary intake(Reference Livingstone, Robson and Wallace37). While parents take the full responsibility for the dietary recording of younger children, older children often record their intakes with less parental assistance. This is reasonable from the point of view that older children may have more frequent snacking outside the home and less structured eating patterns, which the parents may not know in detail. However, this combination also means that food items or eating occasions may be more prone to be forgotten or missed out by the older children. In addition, sensitivity to social desirability and possibly decreased interest in dietary recording may increase the susceptibility to under-reporting among older children(Reference Livingstone, Robson and Wallace37).
Acknowledging that dietary under-reporting is a well-recognized, ubiquitous concern in dietary assessment, we assessed the prevalence of under-reporters using the Goldberg method. Although this approach has some limitations in that it only identifies the most extreme misreporters and is considered to have a low specificity at the individual level(Reference Black38), it is the most commonly used approach when the doubly labelled water method or other objective measurements of energy expenditure are not available.
One strength of the present study is the separate analyses of data for the three age groups to allow for different eating patterns and different challenges in dietary assessment represented by the age span of 4–14 years. Another major strength is the comprehensive dietary data amassed from daily recordings of dietary intake for seven consecutive days by each participant. These data enabled detailed analyses of the diet quality across the week, including specific distinction of the diet on Fridays. Other strengths include the nationwide character of the study and the wide age span of the sample that render the results more generalizable to children in the general population.
Conclusions
Significant differences and distinct characteristic patterns were found in children's diet quality during weekdays, Fridays and weekend days. The present study suggests that in the prevention of childhood overweight and obesity, more attention should be paid to the higher energy intake, especially from sugar-rich foods and beverages, on Fridays and weekend days.
Acknowledgements
This work was supported by the university PhD scholarships under DTU Food, Technical University of Denmark. The authors declare no conflict of interest. B.W.R. designed the analyses of the present study, performed the statistical analyses and was responsible for writing the manuscript. J.M. was responsible for the design and collection of data in the Danish National Survey of Dietary Habits and Physical Activity. P.B.B. contributed with statistical counselling. B.W.R., C.H., J.M., P.B.B., L.F.A. and I.T. all participated in the discussion of the results and revision of the manuscript. The authors are grateful to researcher Anja Biltoft-Jensen, senior advisor Sisse Fagt and senior researcher Margit Velsing Groth, who are responsible for the design and development of questionnaires to the Danish National Survey of Dietary Habits and Physical Activity. The authors are also grateful to senior advisor Tue Christensen, dietitian Karin Hess Ygil, data scanning manager Hanne-Jette Hinch and data warehouse manager Karsten Kørup, for their contributions to the data processing.