


Introduction
This paper utilises the Antarctic and Southern Ocean climate data made available on the World Wide Web (http://www.antcrc.ulas.edu.au/~Jacka/climate.html), to extend earlier work by Budd (1975), Jacka (1990) and Jacka and Budd (1991) monitoring climate change in the Antarctic and Southern Ocean. The previous analysis of these data-sets up to 1988 only (Jacka and Budd, 1991) indicated mean warming trends for the Antarctic stations of 2.8°C (100 a)−1 from the mean of the regression slopes, and 1.3°C (100 a)−1 for the trend of the mean anomalies. The corresponding warming trends for the Southern Ocean stations were 0.8°C(100a)−1 for both calculation methods. From that study, we concluded that there had been a small but significant trend towards increased temperatures over the period 1949-88 for the occupied Southern Ocean and South Pacific Ocean stations, and over the period 1959-88 for the coastal Antarctic stations. We also concluded that there had been a small decrease in the Antarctic sea-ice extent over the period covered by routine satellite-based monitoring, 1973-88. We argued that these trends were compatible with the Intergovernmental Panel on Climate Change (IPCC) expected trends resulting from atmospheric greenhouse-gas concentration increases.
Since Jacka and Budd (1991), a few data have been corrected from original sources, some 1987 and 1988 station data not available at the time of preparation of that paper have become available, the temperature and sea-ice data for the period 1988-96 have been added to the study, Mount Pinatubo (Philippines) has erupted (in 1991) with an apparent impact on Antarctic temperatures, and a new analysis of historic whaling data (de la Alare, 1997) has provided important missing sea-ice information for the period 1930— 60. It is timely therefore to carry out a re-analysis of the data.
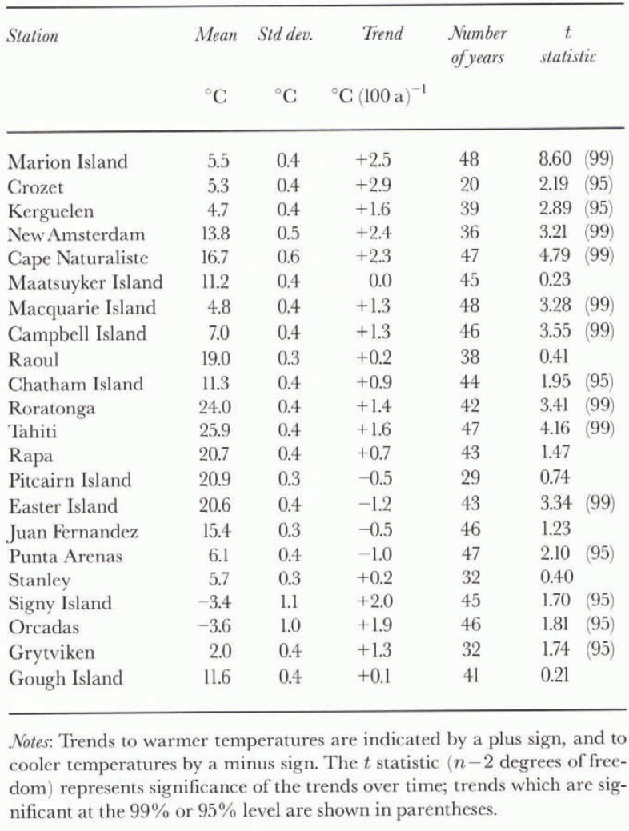
For the temperatures the monthly mean (for calculation of seasonal data) and annual mean data as presented on the Website, are utilised. This leads to a geographical bias in our statistical analyses for the Antarctic Peninsula sector since there are many stations in this sector. Thus, the mean temperature anomalies are calculated for individual Peninsula stations, and these anomalies are then combined to provide just one record for this region. For the same reason, data from Scott Base, but not McMurdo Station, are utilised. in addition, it should be noted that the earlier analysis did not include the inland stations, South Pole and Vostok. The current analysis does include these stations. With these considerations, a total of up to 16 Antarctic stations are included in the analyses below for the full period 1959-96. For the ocean islands, up to 15 Southern Ocean and 7 South Pacific Ocean islands are included for the full period, 1949- 96.
Table. 1. Calculations of mean and standard deviation of the annual surface temperatures for Antarctic stations over the period 1959 96, and of the temperature trend (slope of the linear regression fit to the annual data) over the period
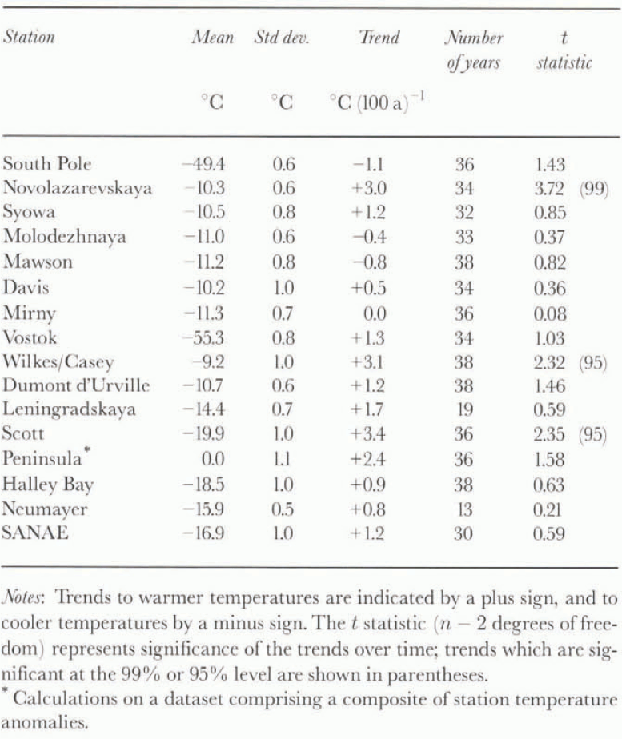
Table. 2. Calculations of mean and standard deviation of the annual surface temperatures for Southern and South Pacific Ocean stations over the period 1949-96, and of the temperature trend (slope of the linear regression fit to the annual data) over the period
Station Temperature Trends
Statistical examination of the temperature data records on the time domain reveals that most stationsdata continue to exhibit warming trends similar to those given by Jacka and Budd (1991). Details of the calculations for the individual stations are shown in Table 1 for the Antarctic stations, and Table 2 for the Southern and South Pacific Ocean stations. To clarify the significance of the trends, Jacka and Budd presented a series of histograms for the Antarctic stations and for the island stations. That procedure is repeated here, adding a further histogram for each region, with the data to 1996.
The new histograms (figs 1 and 2) show the frequencies of stations with annual mean temperature data exhibiting different linear regression-line slopes. Regression slopes were calculated over a series of increasing time periods, beginning in 1949 for the Southern Ocean stations, and 1959 for the Antarctic stations, then adding a further 10 years for each new calculation up to 1988, and then the 8 years from

Fig. 1. Histograms showing the frequency of Southern and Pacific Ocean stations (Pacific Ocean station data shown hatched) with annual temperature data exhibiting different linear regression-line slopes. Data periods are (a) 1949-58, (b) 1949-68, (c) 1949-78, (d) 1949-88 and (e) 1949-96. The means of the regression slopes are indicated.

Fig. 2. Histograms showing the frequency of Antarctic sta-tions with annual temperature data exhibiting different linear regression-line slopes. Data periods are (a) 1959-68, (b) 1959-78, (c) 1959-88 and (d) 1959-96. The means of the regression slopes are indicated.
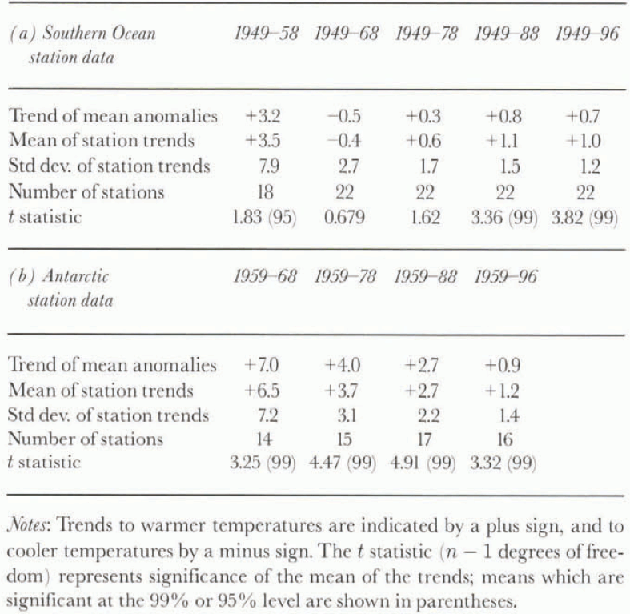
1989-96 for the final calculations. Summaries of the mean trends and their standard deviations are given in Table 3 along with the regression slopes of the mean anomalies discussed below.
For the first 10 year period for the ocean island stations, the distribution of frequencies about a near-zero regression-line slope is (as expected) similar to that for a random sample of data with no trend. As each 10 years of data is added, a convergence towards a positive trend develops. For the Southern and South Pacific Ocean data, particularly with the addition of the past 8 years, this trend is now more firmly established.The mean trend for these stations is l.0°C (100 a) −1 with a standard deviation of 12°C (100 a)−1. Jacka and Budd'S (1991) estimate of the mean trend was 0.8°C(100a)−1, but the fi gure for the period up to 1988 is re-vised here to 1.1 c (100 a) −1 as a result of additional data now available. The hatched areas of these histograms represent the South Pacific Ocean data. While the mean of these data is not significantly different from that for the ocean island data as a whole, we note that every station bar one exhibiting a cooling trend is a South Pacific Ocean station. The geographical distribution of the trends is discussed in more detail below.
Table. 3. Changes in mean annual temperature trend, in c (100a) over time, as indicated by menus and standard deviations of the slopes through individual station data, and by slopes of regression lines through annual mean anomaly data
For the Antarctic stations, the mean of the regression slopes to 1996 indicates a warming trend of I.2°C (100 a)−1 with a standard deviation of 1.4°C (100 a) −1.Jacka and Budd (1991) calculated a mean warming trend for the period up to 1988 of 2.8°C (100 a)−1 The Antarctic data are more van-able than the Southern Ocean data, and the trend is not as well established as that for the Southern Ocean, since the range of the slopes is greater. The decrease in mean slope from the earlier estimate for the Antarctic data is partly due to a sharp decrease in the trend, beginning in 1991, with lower temperatures persisting for about 4 years. We attribute this to the volcanic eruption of Mount Pinatubo, and possibly Mount Hudson in South America in 1991. Mount Pinatubo injected ~20 Mt of sulphur dioxide into the stratosphere (Reference Bluth, Doiron, Schnelzler, Krueger and WalterBluth and others, 1992) and has been linked to decreased areas of melt and decreased mean annual temperatures on the Greenland ice sheet ( Reference Abdalati and SteffenAbdalati and Steffen, 1997) and to changes in global mean temperature (Reference Houghton, Filho, Gallander, Harris, Kattenberg and MaskellHoughton and oihers, 1996).
When individual stations are considered separately, the trends for most stations, as indicated by the regression-line slopes through the annual means, are not significant. The significance of the difference of the trends from zero maybe represented by the Student's t statistic with N — 2 degrees of freedom, given by
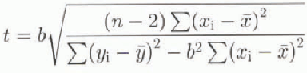
where X is the long-term mean temperature, Xi are the individual annual temperatures, b is the regression-line slope, and N is the number of years, yi, for which data are included. The values of this t statistic are listed in tables 1 and 2. Seven Southern Ocean stations exhibit warming trends significant at the 99% level, and a further six exhibit warming trends significant at the 95% level. Easter Island and Punta Arenas exhibit cooling trends, significant at the 99% and 95% levels, respectively. of the Antarctic stations, Novola-zarevskaya exhibits a warming trend significant at the 99% level, while Casey and Scott exhibit warming trends significant at the 95% level.
The mean of the station trends, however, is much more significant, and is becoming more highly significant over time, so that the Southern Ocean station data trends are now as clearly significant as the Antarctic data trends. The significance of the difference from zero of the group mean, X (over all rt stations and with sample standard deviation, S), of the regression slopes may be represented by the t statistic with n-1 degrees of freedom, given by
The t values (table 3) show that the mean trends up to recent times are highly significant in spite of the recent downturn for the Antarctic stations after the Pinatubo eruption.
Using data up to 1994 in a similar study to the one outlined here, Reference JonesJones (1995) noted that most of the warming trend for the Antarctic stations occurred during the first half of the time period, i.e. from 1957 to the early 1970s. Although this is true, the present results indicate that some warming has continued at a lower rate through the second half of the record, and the warming trend over the whole record has maintained its high significance even up to the most recent period. The high interannual and multi-year variability gives rise to large variability in shorter-term trends. Also, as mentioned above, the reductions in mean temperature after 1991 contributed substantially to the decreased trend of the later half of the record. TÒ clarify this, the trends for the different periods of the mean Antarctic temperature anomalies were 6.4°C (100 a) −1 for 1957-75, 3.2°C(100a) −1 for 1976-91 and 04°C (100 a)−1 for 1976-96 compared with the trend for the whole period (1957-96) of 1.2°C (100 a)−1. This latter, longer-term trend is more significant than the trends for the shorter periods and is considered to be the more robust indicator of the average long-term trend for the Antarctic continent.
Sea-Ice-Extent Trend
Figure 3 shows a histogram of the frequencies of longitudes (based on a total of 36 longitudes at 10° intervals) with mean annual sca-ice-extent data exhibiting different regression-line slopes. These data are from the U.S. Navy-National Oceanic and Atmospheric Administration Joint Ice Center (JIG) weekly ice charts (one map is chosen per month) and cover the period 1973-96. There is a wide distribution (from -6° to 4-4 lat. (100 a)−1) of trends of sea-ice change, but the mean trend over this period is near zero. As noted below, the four 10° longitude locations exhibiting high negative slopes (i.e increased sea-ice extent) are from one sector, while the six with high positive slopes (i.e decreased sea-ice extent) are from another. Apart from these two sectors of clear advance and retreat, the sea-ice-extent trends over the satellite era are small.
Trends of the Mean Anomaly Data
Figure 4 shows the time series for the means, across all stations, of the annual temperature anomalies for the Southern and South Pacific Ocean stations and for the Antarctic stations, and, across all longitudes, the annual mean latitude from the sea-ice-extent data. Only stations with records longer than 14 years are considered, and the annual anomalies for each station are taken from their long-term average. This allows the combination of anomalies for all stations available in individual years to give group mean annual anomalies, even though some stations may not be included in the mean change over some part of the record. The decrease in temperatures in the period 1991-93 for the Antarctic stations, attributed above to the Mount Pinatubo eruption, is immediately clear. It can be seen also that the temperatures by 1996 appear to have “recovered” from the Pinatubo effect. Although the Southern Ocean temperatures show no clear Pinatubo effect, there is some evidence of increased sea ice in the 4 years immediately after the eruption. The next few years will be particularly important for monitoring the trend in these parameters “post-Pinatubo".
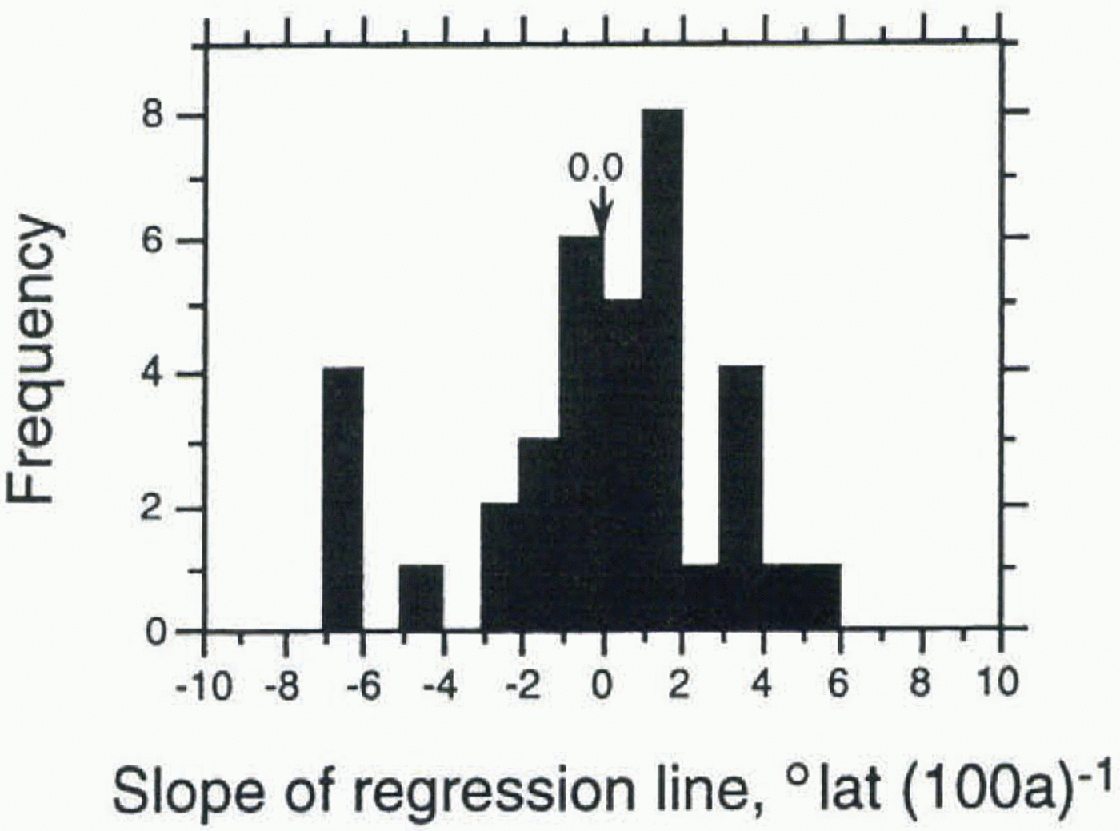
Fig. 3. Histogram showing the frequency of locations (of 36 X 10° longitudinal intervals) with annual sea-ice-extent data over time exhibiting different linear regression-line slopes. The data period is 1973-96. The mean of the regression slopes is indicated. A positive regression slope indicates a trend towards higher latitudes or less sea ice.
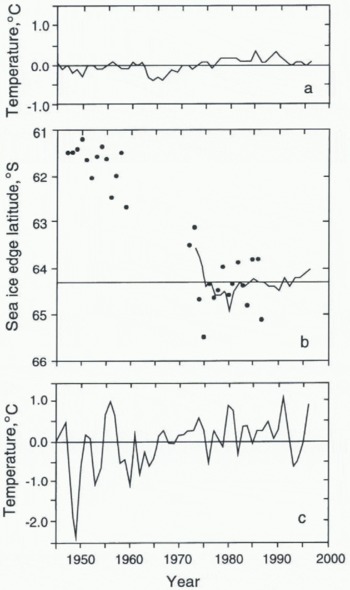
Fig. 4. Mean across all longitudes of (a) Southern and Smith Pacific Ocean station mean temperature anomalies, (b) annual sea-ice extent and (c) coastal Antarctic station mean temperature anomalies. The dots superimposed on the sea-ice-extent curve are from estimates based on southernmost positions of whaling-factory ships (after de la Mare, 1997).
For the Southern Ocean mean temperature anomaly data the regression slope indicates a warming trend of 0.7°C (100 a)−1, and for the corresponding Antarctic data a warming trend of 0.9°C (100a)−1. These trends (summarised in Table 4) are slightly less than those indicated by taking the means of the slopes of the regression lines for the individual station datasets. For the sea-ice-extent data, the trend of the mean data is to 0.2 ° lat. (100 a)−1 more sea ice (cf. zero trend for the mean of the individual trends).
In Figure 4, we have added to the sea-ice-extent plot data of the latitude of the southernmost whale-factory-ship positions (after de la Mare, 1997) for the period 1946-87. For these data for the period 1973—87, de la Mare reports a mean latitude of 64.3° S. The JIG sea-ice-extent data indicate a mean annual latitude of 64.2° S. The datasets are overlain in Figure 4 with the mean for the satellite era at 64.3° S. The de la Mare data were derived from the positions of whaling-factory ships which were stationed near the sea-ice edge, an area of high biological activity. De la Mare argued that these data are a good proxy for sea-ice extent, and, for the months (mid-October to mid-April) covered by his data, he obtained a high correlation with the JIC sea-ice-edge data for the period 1973 to 1986-87 of r2 = 0.832. For the period 1932-39, de la Mare found a correlation of r2 = 0.88 between the data derived from the whaling records and the sea-ice positions reported by the Discovery expeditions.
While there is not a strong correlation between the de la Mare data and theJIC data on an annual basis, Figure 4 does confirm that the data derived from whaling observations during the period 1973-87 are within 0.5° lat. of the JIG data. Given that the whaling-based data are compiled from observations from October to April only and that they are not evenly distributed M round the Antarctic continent, it is not surprising that a stronger correlation with the annual satellite data is not found.
With the addition of the whaling-based data, we can conclude that there appears to have been a significant decrease in sea-ice area over our period of interest here (1949-96), highlighted by an apparent marked drop in ice extent between the early 1950S and the mid-1970s tie la Mare 1997), but very little net change since then. The observation of a decrease in duration of fast ice at Signy and Laurie Islands over the period 1930 to the mid-1950s (Reference Murphy, Clarke, Symon and PriddleMurphy and others, 1995) would seem also to be compatible with a decrease in sea-ice area in the Weddell Sea region over that period.
Seasonal Trends
The mean trends for the different seasons (summer: December February; autumn: March May; winter: June August: spring: September November), as well as the annual mean trends, are given in Table 4. Results are shown for the means of the individual regression slopes and for the regressions of the mean anomalies. The relative seasonal variations from these different regressions are similar.
Table. 4. Trends of seasonal and annual mean temperature, in C(100 a)−1 and sea-ice extent, in ° lat. (100 a)−1, calculated from (a) the means of the slopes through individual station data, and (b) slopes of regression lines through annual mean anomaly data
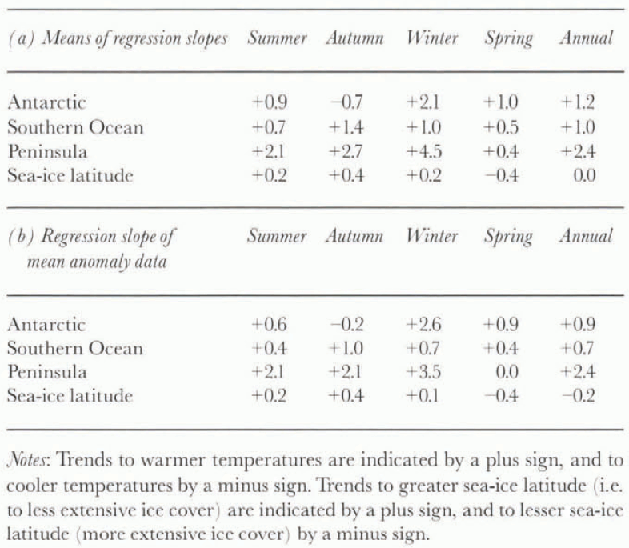
The means for the group of Antarctic Peninsula stations are also shown since they show a consistent regional rate of change more than twice the average for the total of the Antarctic stations. It is worth noting, however, that a few other individual Antarctic stations (e.g. Novolazarcvskaya, Casey, Scott) exhibit warming trends greater than the mean Peninsula trend (see Table 1).
For the Antarctic stations, the warming trends are largest in winter and smallest in autumn. For the Southern Ocean stations, the trends are largest in autumn and smallest in spring and summer. The sea-ice changes show a small trend towards an increase in spring, with decreases in the other seasons, the largest being in autumn. The relative seasonal trends for the Antarctic Peninsula stations as a group are more like those of the Southern Ocean stations than those of the other Antarctic stations.

Fig. 5. The slopes of regression lines through the annual mean temperature data for each station are plotted for Antarctic coastal stations about the inner circle and for Southern and Pacific Ocean inland stations about the outer circle. The slopes of regression lines through the annual mean sea-ice-extent data (for the period 1973-96) at each 10° of longitude are plotted about the middle circle. The scale indicates 0-5°C (100 a)−1 for the temperatures, and 0-5° lat. (100 a)−1 for the sea-ice extent. Sectors exhibiting a warming trend, and sectors exhibiting a reduced sea-ice extent are indicated by shading, and the opposite changes by hatching.
Geographical Distribution of Trends
Figure 5 is a revision of Jacka and Budd'S (1991) figure 8. It presents a plot of the slopes of the regression lines through the time series of annual mean temperature data for each station, plotted at the longitude of the station. Coastal Antarctic stations are plotted about the inner circle, and Southern and South Pacific Ocean stations about the outer circle. The sea-ice-extent slopes are plotted about the middle circle.
Mawson and Molodezhnaya, neighbouring stations in East Antarctica, are the only coastal Antarctic stations still displaying a cooling trend. We have suggested earlier (Jacka and Budd, 1991) that these two stations may be affected by increased air flow from the cold interior, as indicated by the analysis ofseasonal pressure anomalies (Jones and Wig-ley, 1988). Even at these two stations, however, the trends to cooler conditions have become smaller and less significant with the addition of the past 8 years of data ( Molodezhnaya: 0.4°C (100 a)−1; Mawson 0.8°C (100 a)−1).
For the Southern Ocean islands, Jacka and Budd (1991) noted that every station displayed a warming trend, while a cooling trend was exhibited only by the South Pacific island stations included in the dataset. With the addition of the past 8 years of data, the western Pacific Ocean stations are now trending (![]() ) to warmer temperatures, while the eastern Pacific islands and Punta Arenas are trending (-0.5° to -1.0°C (100 a)−1) to cooler temperatures. The eastern Pacific region is now the only sector of the islands record still displaying a cooling.
) to warmer temperatures, while the eastern Pacific islands and Punta Arenas are trending (-0.5° to -1.0°C (100 a)−1) to cooler temperatures. The eastern Pacific region is now the only sector of the islands record still displaying a cooling.
The geographical distribution of the sea-ice-extent trends is noteworthy. While the mean trend is zero, the sector 0—40° east of the Weddell Sea has a clear trend towards increased sea ice. This is matched by a large sector of decreasing extent around the South Pacific sector of the West Antarctic coast, near the Bellingshausen and Amundsen Seas from about 65° to 160° W. Elsewhere, the sea-ice-extent trends are relatively small.
Discussion and Conclusions
Addit ion of the 8 years of data from 1989-96 results in little change in the mean warming trend (0.8-1.0°C (100 a)−1) for the island stations, but a slight reduction in the standard deviation of the trends from 1.5° to 1.2°C(100a)−1. The western Pacific Ocean stations now exhibit a warming trend, while the eastern Pacific stations and Punta Arenas exhibit a cooling (rend. There is little effect on the Southern Ocean island annual mean temperatures from the eruption of Mount Pinatubo, with a <0.3°C departure below the mean regression-line trend, somewhat smaller than the global departures given by the IPCC (Houghton and others, 1996, fig. 5.20). However, the eruption seems to have had a more significant effect on the trends for the Antarctic stations. The mean Antarctic temperature shows a decrease of ~ 1°c immediately following the eruption, and it has taken about 4 years for the mean annual temperature to “recover” to the pre-Pinatubo values. It will be important to monitor the Antarctic temperatures over the next few years to establish the new post-Pinatubo trend. The warming calculated from the mean of the individual trends for the Antarctic stations for the data up till 1988 was +2.7°C (100 a)−1. The corresponding mean trend for the 1959-96 data has been lowered to +1.2°C (100 a)−1. The standard deviations of the regression slopes for the two periods were 2.2° and 1.4°C (100 a)−1, respectively. The trend of the annual mean temperature deviations changed from +2.7°C(100a)−1 for data to 1988 to +0.9°C (100 a) −1 for data to 1996. Thus there appears to be a convergence of these trends with the longer record, along with a reduction in the standard deviations of the trends across the stations. The decrease in the mean of the regressions appears to be largely a consequence of the lower post-eruption temperatures. Despite the effects of Pi-natubo, we still see a tendency for all the stations to exhibit a similar trend, with only two stations exhibiting a cooling; but even for these, the cooling trend is smaller than in the previous analysis, and is now only 0.4° to -0.8°C (100 a)−1.
The sea-ice dataset from the satellite era, now extended to include 1973-96, shows no significant overall trend. in the 1991 analysis, we found a small trend to decreased extent. There has, however, been a trend towards increased sea ice over the past 5 years, possibly in response to the Antarctic cooling as a consequence of the Pinatubo eruption. The trend to less sea ice over the period 1973-88 had been due in part to relatively extensive ice extent, as indicated by the JIC charts, in 1973 and 1974. The reliability of these data has been questioned by H.J. Zwally (personal communication, 1997). On the other hand, these 1973 and 1974 data agree reasonably well with data now available from the positions of the factory whaling ships (de la Mare, 1997). The agreement between the sea-ice edge and the position of whaling ships for theJIC era is encouraging and provides some confidence that the earlier data from the whaling-ship positions are reasonable proxies for the sea-ice extent. in this case, (i) the 1973 and 1974 data would seem to be validated, and (ii) there was an apparent marked decrease (of ~2°lat.) in the sea-ice extent in ~30years from the mid-19 10S. With these new data, further work is now required to establish relationships between climatic patterns and sea-ice-extent changes. in particular, it may become possible to examine the time series of changes for different longitudes in order to ascertain whether the changes have been systematically distribu-ted around the Southern Ocean. The evidence from the 1973-96 sea-ice-extent data is that some sectors (the Atlantic) have exhibited more extensive sea ice, while for others (the eastern Pacific) the extent has decreased. By combining the archived climatic data for sea ice, atmosphere and ocean with modelling it may become possible to determine the interrelationships between the sea-ice and temperature changes.


