
All fingers on our detective glove thus far point in a single direction: in the aggregate, the story of the Greek trade economy over the LBA–EIA transition is one of decline soon after 1200 BCE, a long period of stagnation, and eventual recovery in the ninth and eighth centuries. The quantitative changes in import data, in the evidence for trade in commodities, and in the export evidence from the LBA to the Geometric periods show that Greeks probably had less contact with their neighbors around the Mediterranean in the IIIC and PG periods in the aggregate than they did in the IIIB and the Geometric periods. This might lead us to conclude that Greece truly was “in the dark” and cut off from the wider Mediterranean during the period between the Mycenaean collapse and the eighth century BCE. However, in this chapter, I consider a final variable that we must take into account before drawing any conclusions about economic change based on the numbers presented in the previous chapters. I examine how an apparent decline in trade volume after the collapse of Mycenaean society looks if demographic change, and its likely impact on the scale and structure of the economy as a whole, is taken into account.
The lower import quantities from the PG have most commonly been viewed as a direct reflection of a decrease in the robustness or existence of Mediterranean trade routes after the collapse of the Mycenaean palaces. However, most people also think that the population of the Greek world decreased dramatically after LB IIIB (though this is still a controversial topic).Footnote 1 If there was significant demographic change after IIIB, this must be taken into account when assessing changes in archaeological quantities through time, because “population trends and the economy are locked into dynamic interrelationships that affect … the wealth or poverty of society itself.”Footnote 2 The size of a population will therefore directly influence patterns of consumption and production. If the number of imports declined in proportion to the population, it might indicate not that Aegean trade routes fell out of use during the EIA, but that it was the economy in general that contracted, squelching Greeks’ purchasing power and simplifying productive organization in ways that made interaction and exchange more difficult, and less of a priority. If this were the case, a decline in imported goods and commodities in Greece during the postpalatial period would have been the result of demand-side, rather than supply-side, factors: the aggregate quantity of traded objects and materials decreased because there were fewer people around who could produce them, could afford to purchase them, and/or had the need and desire to use them. In this chapter I will argue that it was in fact demographic change, rather than changes or interruptions of trade routes, that explains the quantitative changes that we see in the evidence the best.
5.1. Estimating the Population of Early Greece
Is it important to know the population of prehistoric Greece? If so, why and how would this knowledge impact our interpretation of the prehistoric economy? In the same vein that I maintain the importance of knowing “how much” trade declined after the Bronze Age, I also believe that we must put this information into a demographic context in order to truly understand its meaning. In this section I discuss the rationale for including a chapter on demography in this book, and provide a brief review of standard methods in the study of ancient populations.Footnote 3 I break down the kinds of evidence available, and lay out the basic picture of population change we have for early Greece. Weighing all the evidence, I argue that a population decline of about 40–60 percent between the late thirteenth and late eleventh century is likely, with steady growth after that.
Why Demography?
Though I will argue that demography played a particularly important role in the processes that defined the Greek Bronze/Iron Age transition, a sense of population change through time is important in any comparative, historical, economic study. The size, density, and composition of a population will have an effect on almost every aspect of its functioning, and it is difficult to understand social processes without at least a crude grasp of these figures. As Scheidel puts it, “demography is much more than just numbers, and relevant to much of what we seek to know and understand about the distant past.”Footnote 4
In addition to being generally instrumental in reconstructing past economies, demographic trends are particularly important in the study of the LBA–EIA economy because of the ongoing debate about the role trade played in sociopolitical processes at the end of the Bronze Age. This debate is reviewed in full in the Introduction to this book, but it is worth restating here. The notion that trade was disrupted around 1200 BCE has been central to many explanations of the Bronze Age collapse. According to this position, the Bronze Age palatial elite was meant to have been able to support its authority in part because of the elite’s preferential access to luxury goods from exotic lands, which allowed them to claim special status vis-à-vis the rest of the population.Footnote 5 Thus, trade routes must, at least to some extent, have underpinned the hierarchy and structure of society in the LBA. A complete breakdown in trade routes would therefore have caused significant changes in the ability of states to function and thus in the way that communities and power were organized.Footnote 6
This argument rests in part on a straightforward interpretation of imports, which become less common in Greece after 1200 BCE, as we have seen. Most people explain the observed decrease in imports in Greece after the Mycenaean collapse as a symptom of a general slackening in Mediterranean trade networks, or even a total disruption, at this time. However, identifying a decrease in import quantities does not in itself prove that the Greeks had less access to a system of Mediterranean trade in the IIIC and PG periods. An observed pattern can often arise from a variety of different circumstances, and so it is always important to sort out different possible causes for the observed patterns before coming to a conclusion. While a disruption of trade routes is one possible cause for a decreased number of imports, other scenarios could have led to the same outcome. One likely alternative explanation is demographic change.
If we were to correlate the decrease in imported objects from the Late Mycenaean period with a decrease in access to trade (that is, if we focus on supply side issues), this could strongly imply a direct causal connection between a decrease in import numbers and the Mycenaean collapse. There are various scenarios of causality that could be read into this hypothesis. One possible scenario is that the demise of Mycenaean palatial institutions, which may have had some primacy in managing long-distance trade, caused a decrease in trade. Another possibility would be that a disruption of trade routes played some part in causing the social hierarchy of Mycenaean culture (which relied on imports for creating social difference) to collapse and brought on the end of the Aegean Bronze Age.Footnote 7 If we accept this scenario, we then would conclude that a supply-side crisis in palatial access to exogenous goods was a major factor in the events that led to the end of Mycenaean society. In either case, a change in import deposition is causally linked (as either a consequence or catalyst) in a direct way with the Mycenaean collapse.
However, I wish to focus more closely on the question of demand, and to argue that the patterns in import totals, apparent commodity acquisition, and export totals are epiphenomena of a decrease in the quantity of people living and working in Greece after the events that precipitated the end of the Mycenaean palatial system. This is an important move from the point of view of reconstructing the causal chain of ancient social processes, so I will take a moment to clarify it here. If it is likely that import totals correlate well with population levels in a way that makes it clear that trade was never “disrupted” as a supply side argument would suggest, the possibility that the disruption in trade routes played a role in, or had much structural connection to, the collapse of the Mycenaean palace societies must be reconsidered. In this interpretation, patterns in the number of import totals would be best understood as a correlate of population fluctuation, rather than a cause or effect of social phenomena. This would, in turn, suggest that trade was not a factor in the social changes associated with the end of Mycenaean civilization, and that we should seek different explanations for those social changes besides the breakdown of trade.Footnote 8 Finally, this line of reasoning would suggest that the key issues that we should focus on when we are trying to unravel the economic nature of the LBA–EIA transition are the cadence and causes of depopulation in the IIIC period. We might also need to re-think our understanding of the way in which Mycenaean elites cultivated power during the LBA, and the power structures surrounding LBA trade.
Determining the relationship between patterns in imports, exports, commodities, population patterns, and trade networks in the prehistoric Mediterranean therefore has considerable implications for the study of the LBA–EIA transition in general. For my argument, determining the size of the population will help me to find the best explanation for the patterns in the evidence laid out in the preceding chapters. In what follows, I seek to distinguish between two possibilities – whether imports declined in number because of disrupted trade routes, or whether imports declined in number because of depopulation and overall economic contraction.
Estimating Population from Archaeological Evidence
In order to conduct an analysis of the relationships among import tallies, trade, and population change, it is first necessary to get some idea of the size of the population of Greece. Demography in prehistoric populations is a complicated and controversial topic, and so I review the nature of the evidence before arriving at some tentative estimates about the Greek population.
The first step in formal demography is to describe the population.Footnote 9 Demographers usually describe populations in consultation with data from a direct measure, such as a census. Palaeodemographers, on the other hand, do not have direct access to the populations they are interested in describing. It is therefore necessary to use proxy data to describe any hypothetical archaeological population. Proxy data are by definition indirect measures rather than explicit ones, and their interpretation can be problematic.Footnote 10 In archaeology, the primary categories of proxy data are burials, settlements/structures, and ceramic evidence from surveys. Burials can be added up and assumed to represent some percentage of a total community,Footnote 11 settlement size can be extrapolated out into figures based on assumed occupation per hectare,Footnote 12 and the evaluation of the density of surface pottery can indicate fluctuation in site distribution and agricultural intensification over time.Footnote 13
However, while all three types of archaeological evidence provide information about past populations, each category is considerably flawed as far as its potential for producing even roughly accurate estimates for overall population size. Archaeologically visible burial can be limited to certain sectors of the population, skeletons rarely survive in good stead in acidic Greek soils (hindering attempts to model age and sex ratios), and cemeteries may or may not be thoroughly excavated, even when found unlooted.Footnote 14 Therefore, even though it is clear that we have excavated more cemeteries from the IIIB and G periods (IIIB = ~450; G = ~332) and as compared to the IIIC and PG periods (IIIC = ~205; PG = ~245), it is difficult to interpret this data where population fluctuations are concerned. The situation for our period is even further exacerbated by the fact that most Bronze Age burials are multiple, while most from the EIA contain only a single individual.
Another way to get a rough idea of the size of a population is to use excavated or estimated settlement size coupled with assumed or inferred density of habitation. As in the case of burial evidence, the size and number of buildings in a settlement that is fully excavated, or the assumed or inferred extent of settlements that are only partially excavated, are indirect proxies for an original population. While archaeologists have used a variety of methods to deduce population from settlement sizes, these have proven as problematic as burial evidence for generating convincing estimates. Efforts to create universal models of population based on normal human tolerances have been criticized for ignoring important variation in psychological attitudes and approaches to space across cultures.Footnote 15 Furthermore, archaeological approaches based on this method have been criticized because they ignore the variable, culturally dependent relationship between individuals and required/preferred living space.Footnote 16 An alternative is to “build up a culture-specific occupation density assessment,”Footnote 17 but this requires the existence of well-excavated settlements, not to mention information about how people share space, which can be unforthcoming for prehistoric societies.Footnote 18 Perhaps as a result of these difficulties, Aegean archaeologists are generally hesitant to make population estimates for individual settlements, preferring to limit themselves to qualitative descriptions of periodic settlement sizes or settlement patterns that they perceive to be larger or smaller, denser or sparser than in the preceding and following eras.Footnote 19 When archaeologists do estimate population size for individual sites, these vary dramatically. Whitelaw settles on a figure of 14,000–18,000 for Neopalatial Knossos, but previous estimates have put the figure as high as 100,000.Footnote 20 Bennet proposes 6,400 for the population of Mycenae (circa 32 ha at 200 people/ha),Footnote 21 but French suspects that this figure may be too high. According to this logic, the population of Pylos (at 15 ha) would only be 3,000.Footnote 22
For the EIA, the reliability and quantity of settlement data is worse. Despite the progress archaeologists have made in exploring material record of the EIA during recent decades, we still lack a good sense of “normal” settlement structure or size for the earlier part of the period.Footnote 23 It is therefore no surprise that calculations of EIA settlement sizes have varied widely. The evidence suggests that these were rarely larger than hamlets or villages, though acknowledging this does not bring us any closer to a sense of the absolute population of EIA Greece.Footnote 24
Finally, ceramic frequency data drawn from regional intensive and extensive surveys is another proxy that could potentially be used to make estimates about the population of prehistoric Greece.Footnote 25 However, these datasets are difficult to interpret.Footnote 26 Cultural attributes of the “subject population” such as settlement pattern (centralized versus dispersed), agricultural regime (intensive versus pastoral), and rate of artifact discard (frequent versus infrequent) can all affect the archaeological visibility of a given group.Footnote 27 It is generally thought to be unlikely that ceramics collected during intensive survey accurately reflect the original “parent” population of either ceramics or of the people who made and used those ceramics.Footnote 28 Due to limitations of space, it is not possible to rehearse all of the methodological and interpretative problems with surface survey in the current context, because they are legion.Footnote 29
For the current discussion, the most relevant problem with survey data is the fact that almost every regional survey in Greece has recovered less PG pottery than LBA pottery, creating the impression that in the Iron Age landscape of Greece, “people were obliged to go about calling aloud in the hopes of meeting somebody else, as whales are said to do.”Footnote 30 Results from extensive survey in Messenia suggested that “the Dark Age population was … 10% of what it was in LH IIIB.”Footnote 31 In the Southern Argolid survey there was one definite PG site found, compared with twenty-seven confirmed LH sites.Footnote 32 Figure 5.1 summarizes the results from a number of Mediterranean surveys. Is the under-representation of the EIA in surveys evidence of severe depopulation? This is one possibility. The low profile of Protogeometric pottery in surveys could be an accurate index of population size and density (fewer pots = fewer people).
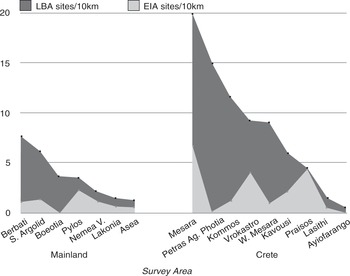
Figure 5.1. LBA and EIA sites from surveys in Greece
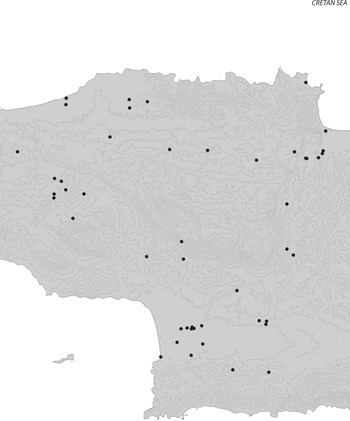
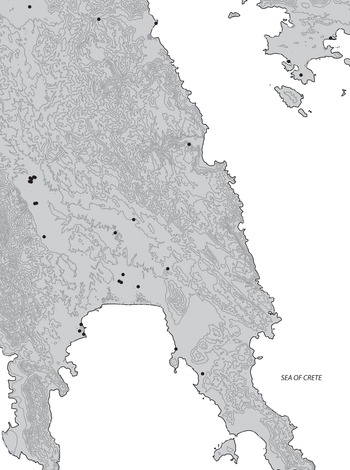
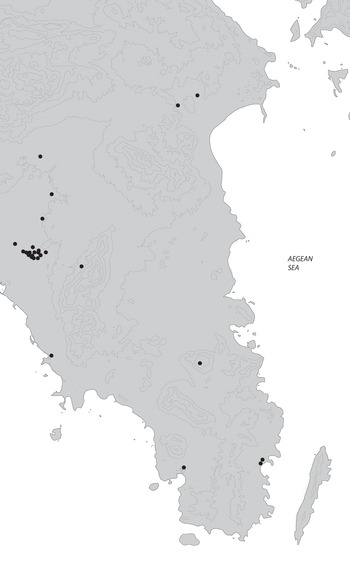
Map 5.1. Distribution of Protogeometric sites in central Crete
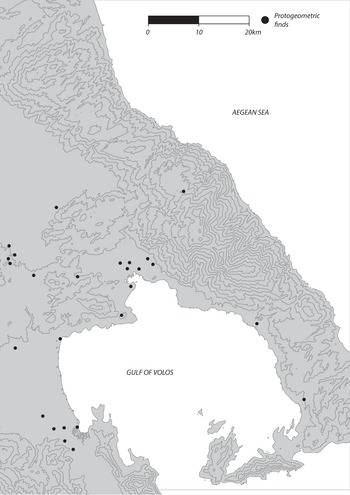
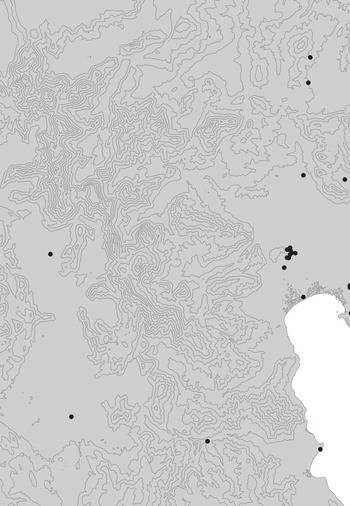
Map 5.2. Distribution of Protogeometric sites in Thessaly
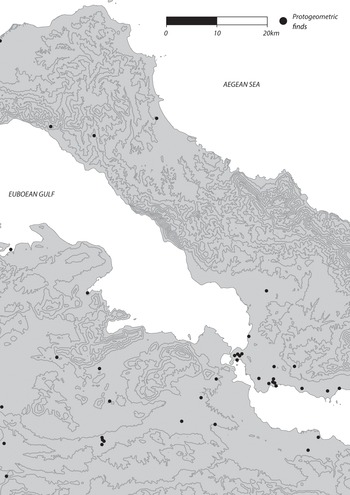
Map 5.3. Distribution of Protogeometric sites in central Greece
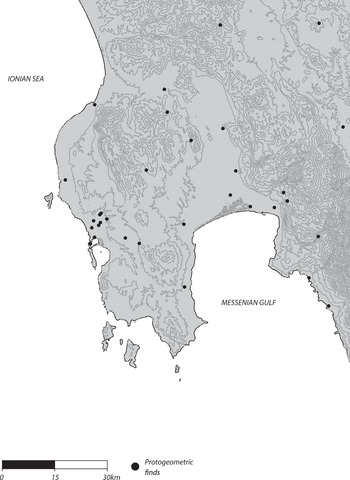
Map 5.4. Distribution of Protogeometric sites in the southern Peloponnese
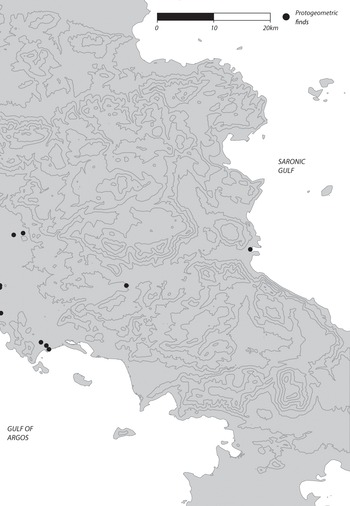
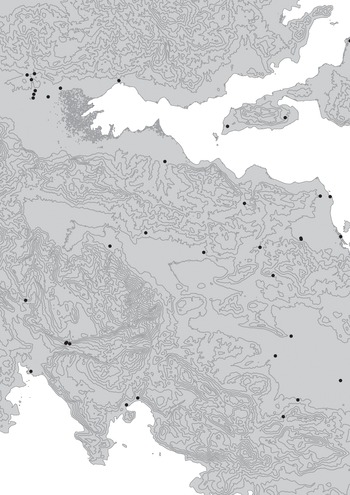
Map 5.5. Distribution of Protogeometric sites in the northern Argolid
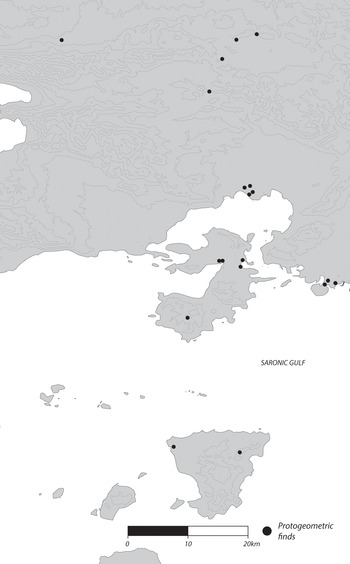
Map 5.6. Distribution of Protogeometric sites in Attica
However, there are other possible scenarios.Footnote 33 We could conjecture that PG Greeks lived in temporary dwellings and moved around so much that their sites are simply too small and dispersed to leave much of a ceramic signature in the kinds of areas (low-lying agricultural fields) that tend to be represented by intensive survey tracts.Footnote 34 Any combination of poor survival and recognition rates of PG pottery and a dispersed settlement pattern might explain our inability to “find” the EIA in the Greek landscape. That is to say, the record that we have of PG in the survey evidence could be the result of distortions on a variety of levels. Protogeometric pottery may not survive because of taphonomic factors, or it may survive in ways that go unnoticed by archaeologists, or it may never have existed. Protogeometric people were sparse and discarded ceramics at rates equal to their predecessors and successors, or they were plentiful but did not use or discard much pottery, or they were plentiful and discarded pottery in ways that are difficult for us to perceive. It is a classic case of equifinality – whatever the mechanisms involved, the end result is that we are left with little PG material. In short, there are many reasons to believe that the record of intensive survey data, especially that from the period between the thirteenth and eighth century BCE, is deeply problematic for reconstructing accurate population figures with any confidence.
Absolute Population
In summary, the evidence suggests that neither mortuary, nor settlement, nor survey evidence will give us much of a firm basis from which to accurately estimate
(1) the population of Greece during the Mycenaean period
(2) the population of Greece right after the fall of the palaces
or
(3) the population of Greece during the EIA.
A bleak outlook indeed!Footnote 35 In this scenario, it is difficult to imagine that we will ever have even a viable starting point from which to compare populations across time periods, or to achieve the goal of this chapter, which is to calculate roughly accurate diachronic values for imports per capita. However, although we may not be able to be precise in describing prehistoric populations over time, it is still possible to use the data that we have to approximate a generally accurate impression of early populations. I try my best to do this using the same “cumulative credibility” strategy evoked in Chapter 4, relying again on the assumption that “if evidence from all approaches converges on a common viewpoint, this creates a strong argument for approximation to reality in reconstructing past population levels.”Footnote 36
In this section I briefly summarize current views held by scholars regarding the scale and chronology of demographic change in Greece, present a tentative model for population change, then set this view against a background of some estimates based on a sample of archaeological evidence. The most likely scenario, taking into account informed opinion, statistical models, and the archaeological material overall, suggests that there was a decline in population after 1200 BCE followed by sustained low habitation levels until the eighth century, when steady growth that would continue into the Classical period began in earnest. I propose that there were something like 600,000 people in the core areas of Greece in the Bronze Age and that this number dwindled to a nadir of about 330,000 in the EIA.
Past and Current Views on EIA Population Change
In one of the earliest synthetic studies of the EIA in Greece, Snodgrass began his description of the period by positing “a fall in population that is certainly detectable and that may have been devastating.”Footnote 37 In one of the most recent synthetic works on the EIA, Dickinson more equivocally states, “[a] major and surely highly significant shift in the distribution of population was clearly taking place, and the total population shrank markedly in some regions (for example, Messenia).”Footnote 38 Most people agree that civilization in LBA represented a relative peak of settlement density and intensive land use in Greece,Footnote 39 but that there were many fewer people around during the eleventh through ninth centuries.Footnote 40
At the same time, the scale of population change remains controversial. Snodgrass’s figures suggested that there was a severe population decline.Footnote 41 From a straightforward reading of the evidence he hypothesized that there were 75 percent fewer people in Greece during the eleventh century than there had been 200 years prior.Footnote 42 Desborough, in turn, believed that there was a 90 percent decrease in population by the end of the twelfth century.Footnote 43 Both these estimates were based on a drop in the number of known sites, which probably overestimated the scale of decline. Indeed, I. Morris has since demonstrated that such a swift drop would have been exceptional indeed, requiring us to imagine a “catastrophic” change in mortality.Footnote 44 Scheidel suggested that the raw archaeological data should be tempered in ways that do not require us to adopt “bizarre saltationist”Footnote 45 models for reconstructing ancient demographic change. Still, I. Morris argues that the evidence we have points mostly toward a relatively dramatic decline in the number of inhabitants in Greece after 1200 BCE, with recovery only slowly beginning in the tenth century.Footnote 46 Tandy and Dickinson follow the same basic figures.Footnote 47 Most recent estimates put the decline in population at about one-half to two-thirds.Footnote 48
However, some scholarsFootnote 49 deny that there was drastic depopulation in the EIA because they think we have fundamentally misunderstood the evidence. Foxhall argues that PG pottery is not often recognized by archaeologists, and that although Greek communities were “rattled” around 1150, they “survived and … continued to produce much the same things in many of the same ways” (though she admits that political units “may sometimes have differed in scale”).Footnote 50 Papadopoulos takes a harder line, suggesting that the Dark Age is an imaginative figment of Eurocentric schools of thought emanating from an old-fashioned university cabal at Cambridge.Footnote 51 He states, “[t]he concept of a Dark Age is more of a modern scholarly construction than one based on solid archaeological evidence.”Footnote 52 Papadopoulos denies the existence of the era of decline and stagnation described by Snodgrass, et al., and in particular suggests that the “intimations of poverty and the depopulation of the landscape inherent in the traditional view of the period are based on a certain reading of the archaeological record, relying on historical exceptionalism.”Footnote 53 His position is that decentralization, rather than depopulation, can account for the differences between LBA and PG settlement tallies from surveys, though Dickinson points out that the evidence from the surviving settlements does not support this.Footnote 54 Mazarakis Ainian suggests that the known EIA buildings with stone socles were derived from other, flimsier buildings made “entirely of perishable materials” meaning that most EIA buildings do not survive in the archaeological record at all.Footnote 55 Similar arguments, suggesting that the depopulation of EIA Greece is an illusion, are not uncommon.Footnote 56
It is difficult to evaluate the claims about relative population levels that are made by these dissenting scholars because they avoid quantification in a way that makes their arguments impossible to compare to those put forward in clear terms by Snodgrass. Furthermore, although they do raise credible concerns about the way in which EIA material has been interpreted, scholars that dissent from the prevailing depopulation orthodoxy do not do a good job of providing a convincing alternative scenario that would explain the observable changes in the archaeological record. Any position that denies a significant depopulation after the Bronze Age presumably works under the assumption that there was steady growth from circa 1600 BCE to the Classical period. In order to convincingly demonstrate steady demographic and economic growth for this stretch of time, it would first be necessary to present a convincing explanation for the relative impoverishment of the archaeological record from 1200–900 BCE that does a better job of accounting for the evidence than demographic and economic collapse.
In the absence of such an explanation, it remains true that, given the premodern context, demographic change caused by endogenous or climatic factors is the most economical and probabilistic explanation for the rapid changes in political structure and social conditions that are evident in Greece between 1400 and 700 BCE.Footnote 57 An appraisal of early Greek history that denies any decrease in population after 1200 must therefore demonstrate thoroughgoing and robust evidence and possess great explanatory power before it gains general acceptance. To date such an appraisal has not yet been presented. Therefore, I assume substantial population decline after 1200 BCE,Footnote 58 with growth thereafter, continuing into the eighth century and beyond.
Model and Estimates
Given this schematic scenario of relative population change, is it possible to produce some believable numbers for the absolute population of Greece during the LB IIIB, IIIC, and PG periods? The first step in this process is to find a benchmark population, some “known” absolute population from which to begin calculating. Since we have no such figure from prehistoric Greece, the best, most proximate benchmark for population estimates comes from Classical Greece.Footnote 59 Greek historians have used various documentary sources to produce estimates of the population of the Greek world. The generally accepted estimate puts the population of the Greek mainland and parts of the Aegean islands at two to three million inhabitants during the Classical period (480–323 BCE).Footnote 60 This may be overly conservative. Something closer to a minimum of four million people, including slaves, in the Greek mainland by the end of the fourth century has lately gained favor as an estimate.Footnote 61 Hansen’s work on Greek demography stems from a detailed and thorough study of the evidence, and his calculations are compelling because they are based on sources that are largely independent of literary accounts.Footnote 62 However, since Classical Greek “polis culture” probably covered a much larger area than the Mycenaean and EIA heartlands and since slave populations may inflate Hansen’s total in ways that might obscure natural growth patterns, I settle on the more conservative figure of two million people in the fourth century.Footnote 63
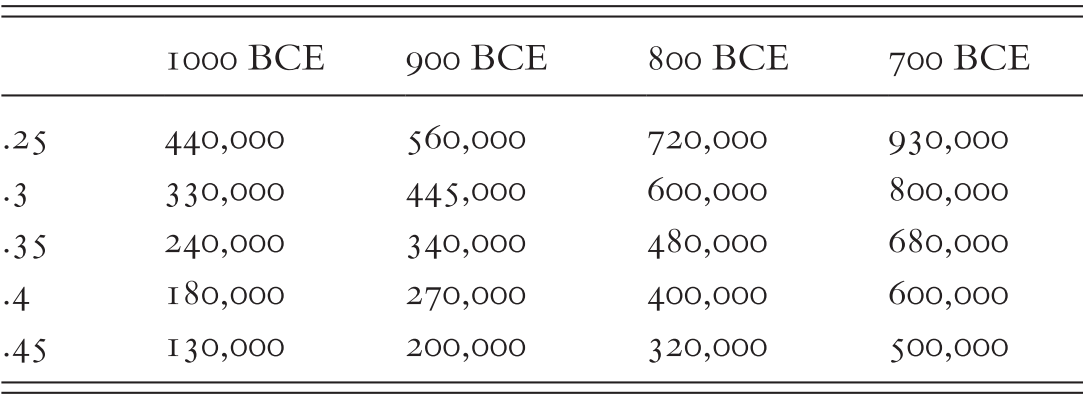
Scheidel argues persuasively that “it is unlikely that the mean growth rate deviated significantly from a range of between perhaps 0.25 and 0.45 percent per year”Footnote 64 between 1000 BCE and the fourth century. A range of these possible growth rates would give Table 5.1’s diachronic growth scenarios, assuming steady, that is, noncyclical, patterns for the EIA.
Table 5.1. Proposed population growth and growth rates in the EIA
| 1000 BCE | 900 BCE | 800 BCE | 700 BCE | |
|---|---|---|---|---|
| .25 | 440,000 | 560,000 | 720,000 | 930,000 |
| .3 | 330,000 | 445,000 | 600,000 | 800,000 |
| .35 | 240,000 | 340,000 | 480,000 | 680,000 |
| .4 | 180,000 | 270,000 | 400,000 | 600,000 |
| .45 | 130,000 | 200,000 | 320,000 | 500,000 |
The ranges in Table 5.1 which assume a relatively rapid growth rate and a beginning population of fewer than 200,000 people in the EIA are probably wrong, and even the higher starting population estimate of 440,000 for 1000 BCE may be too low. If growth rates vacillated considerably over time, starting out slowly in the tenth and ninth centuries and accelerating after 800 BCE, EIA Greece could have been home to over 500,000 people. Given the general uncertainty about finer-grained changes in growth rates during the tenth to eighth centuries, it may be prudent to assume a middling growth rate of 0.3 percent over the early part of the EIA and a maximum possible population of around 330,000 in 1000 BCE.
For the LBA, Renfrew estimated a total population of about one million people.Footnote 65 He based this figure on a generalizing model, made before much intensive survey data from the region was published.Footnote 66 As noted, work based on this archaeological evidence is flawed, but it is worth considering calculations based on this evidence as a general check of the plausibility of a Scheidelian growth model.Footnote 67 Whitelaw’s work has much to recommend it, but it focuses on Crete in particular and focuses more on individual settlements and polities than on aggregate figures.Footnote 68 Branigan and Cherry each provide more general estimates, but also focus mostly on Crete.Footnote 69 Their estimates for total population are slightly lower than Renfrew’s, but the idea that Mycenaean Greece could not have supported more than one million people remains standard.
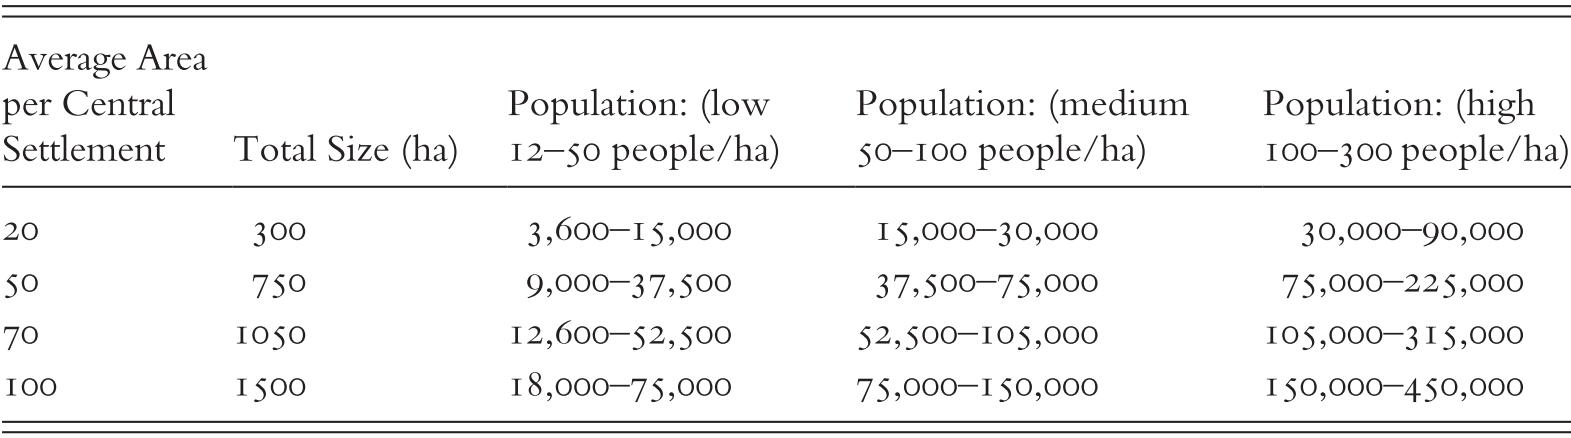
It is appropriate to reevaluate Renfrew’s figure of one million in light of current evidence. A recent overall summary of LBA settlement patterns states that “Minoan and Mycenaean states were relatively small, with territories of about 1,500 square km and central settlements of 20–100 hectares.”Footnote 70 It is not clear how many Mycenaean states or (if there was only one Mycenaean state) how many political subunits of the Mycenaean state there were. On the mainland, we can say confidently that there was at least one political unit in the Argolid, one each in Messenia, Lakonia, Corinth, Athens, Thebes, Orchomenos, and Dimini. On Crete, Mycenaean states may have been centered at Chania, somewhere in the Mesara, at Palaikastro, and at Knossos. Thus there is clear evidence that something in the vicinity of twelve palace-centered states existed in the LBA. We might also consider that, given the density of Mycenaean remains in Achaea, there might have been a palatial center somewhere in or around the modern Greek city of Patras. In addition, recent excavations at Kanakia on Salamis suggest the existence of a possibly palatial settlement here that must have been quite important, and there is sure to have been some kind of Mycenaean presence in both central-east and central Crete. If we assume that approximately fifteen palace centers served as the foci of the main LBA polities, it is possible to provide a range of possible urban population estimates for the mainland and Crete:Footnote 71
Table 5.2. Range of “Urban/Polity” Population in Bronze Age centers
| Average Area per Central Settlement | Total Size (ha) | Population: (low 12–50 people/ha) | Population: (medium 50–100 people/ha) | Population: (high 100–300 people/ha) |
|---|---|---|---|---|
| 20 | 300 | 3,600–15,000 | 15,000–30,000 | 30,000–90,000 |
| 50 | 750 | 9,000–37,500 | 37,500–75,000 | 75,000–225,000 |
| 70 | 1050 | 12,600–52,500 | 52,500–105,000 | 105,000–315,000 |
| 100 | 1500 | 18,000–75,000 | 75,000–150,000 | 150,000–450,000 |
Current estimates for the density of occupation at LBA palace centers and their urban surroundings are in the higher range, and something like 200 people per hectare may be a good average. A mean urban size in the middle of the ranges given previously (60 ha) and an assumed urban density of 200 persons/hectare gives a rough estimate of 180,000 urban dwellers in all of Mycenaean Greece.Footnote 72 Converting this total number of urban-center dwellers to overall population requires having some sense of the ratio of urban to rural settlement, that is, the proportion of individuals living in the palatial centers and the people living in smaller towns or in the countryside. The ratio of identified urban sites to sites that are known only from surface artifacts (for IIIB the numbers break down to 284 sites and 592 artifact scatters, or about a 1:2 ratio of urban to rural sites) might give us a good sense of the breakdown between those who dwell in the hinterland and those who lived in settlements. I chose a ratio of 1:2.5 of urban to rural occupants, on the assumption that a sizable portion of people who live outside of town centers must be completely invisible archaeologically.Footnote 73 This would suggest a general figure of 600,000 people in Greece, much lower than Renfrew and others posit, but in line with the statistical models suggested by Scheidel.Footnote 74
Accepting a figure of 600,000 people for the LBA and 330,000 for the beginning of the EIA would imply one of two basic scenarios for demographic patterns. On the one hand, there could have been a drastic depopulation directly after the fall of the palaces (of around 75 percent) and steady growth at 0.3 percent for two centuries, reaching a level of 330,000 by the beginning of the tenth century. Alternatively, slower decline is possible, with losses of 50 percent of the population slowly accumulating over two centuries, and bottoming out in 1000 BCE. Another possibility is that population declined drastically right after the palatial collapse and was stagnant through the twelfth and eleventh centuries before beginning to grow quickly in the tenth century. Since the sequence of population change is not clear, I assume that the population in the middle of IIIC and the middle of PG may have been about the same, since these points would come on either side of a proposed 1000 BCE nadir. That said, a slightly higher or lower figure for either period is possible, depending on the rate of population change after the palatial collapse and the rate of growth after 1000 BCE.
In any case, a combination of models and studies of urbanism suggests that a decrease in population of around 40–60 percent between the thirteenth and tenth centuries is plausible. A brief examination of other archaeological evidence supports this. While there are many new sites on Crete that appear right after LB IIIB, these are on the whole much smaller than their predecessors. Likewise, the few sites on the mainland with continued habitation after the end of the palatial period shrink considerably, with a few exceptions.Footnote 75 Overall, the number of all settlement sites that I have been able to identify shrinks to about one third, from 296 in the IIIB, to 134 in IIIC, to 90 in the PG.
According to these figures, then, an estimate of 250,000 to 350,000 people in the PG does not seem unreasonable. If there were about 100 settlements, and an average of 1,000 people per settlement (accounting for both tiny hamlets like Mitrou and larger settlements like Athens and Knossos), we would have 100,000 people living in settlements in the PG period. If the population were as urban as it had been in the LBA (with one urban dweller for every 2.5 rural dwellers), the total population could be something like 250,000. However, if the population were considerably more rural in the PG, as some have argued, a figure of up to 350,000 is not impossible to imagine.
Combining these various strands of reasoning, I therefore settle on figures of about 500,000–700,000 people in Mycenaean Greece, and figures of 250,000–350,000 people on average during the postpalatial periods, depending on the rate of decline and growth between 1200 and 900 BCE, with probable variation in changes both regionally and over time. Assuming a reasonable growth rate during the EIA, a population of the same approximate size as the LBA figure had likely been re-established, if not slightly outstripped, by the end of the Geometric period. These numbers are likely to be imprecise, but not insane.
5.2. Population and the Economy
Archaeological reasoning involves trying to take all of the evidence into account when coming up with an argument about the way things happened in the past. When the evidence indicates a pattern that diverges from prevailing opinion about the way things happened, it is important to try to explain the dissonance between consensus and evidence. I have argued that the population of Greece was between 500,000 and 700,000 during the final periods of the LBA, decreased to 250,000–350,000 by about 1000 BCE, and grew steadily after that. Comparing these demographic changes with the number of imports known from ancient Greece shows that imports were extremely rare at all periods, but that import totals track population change with some fidelity. I summarize the data in Table 5.3.
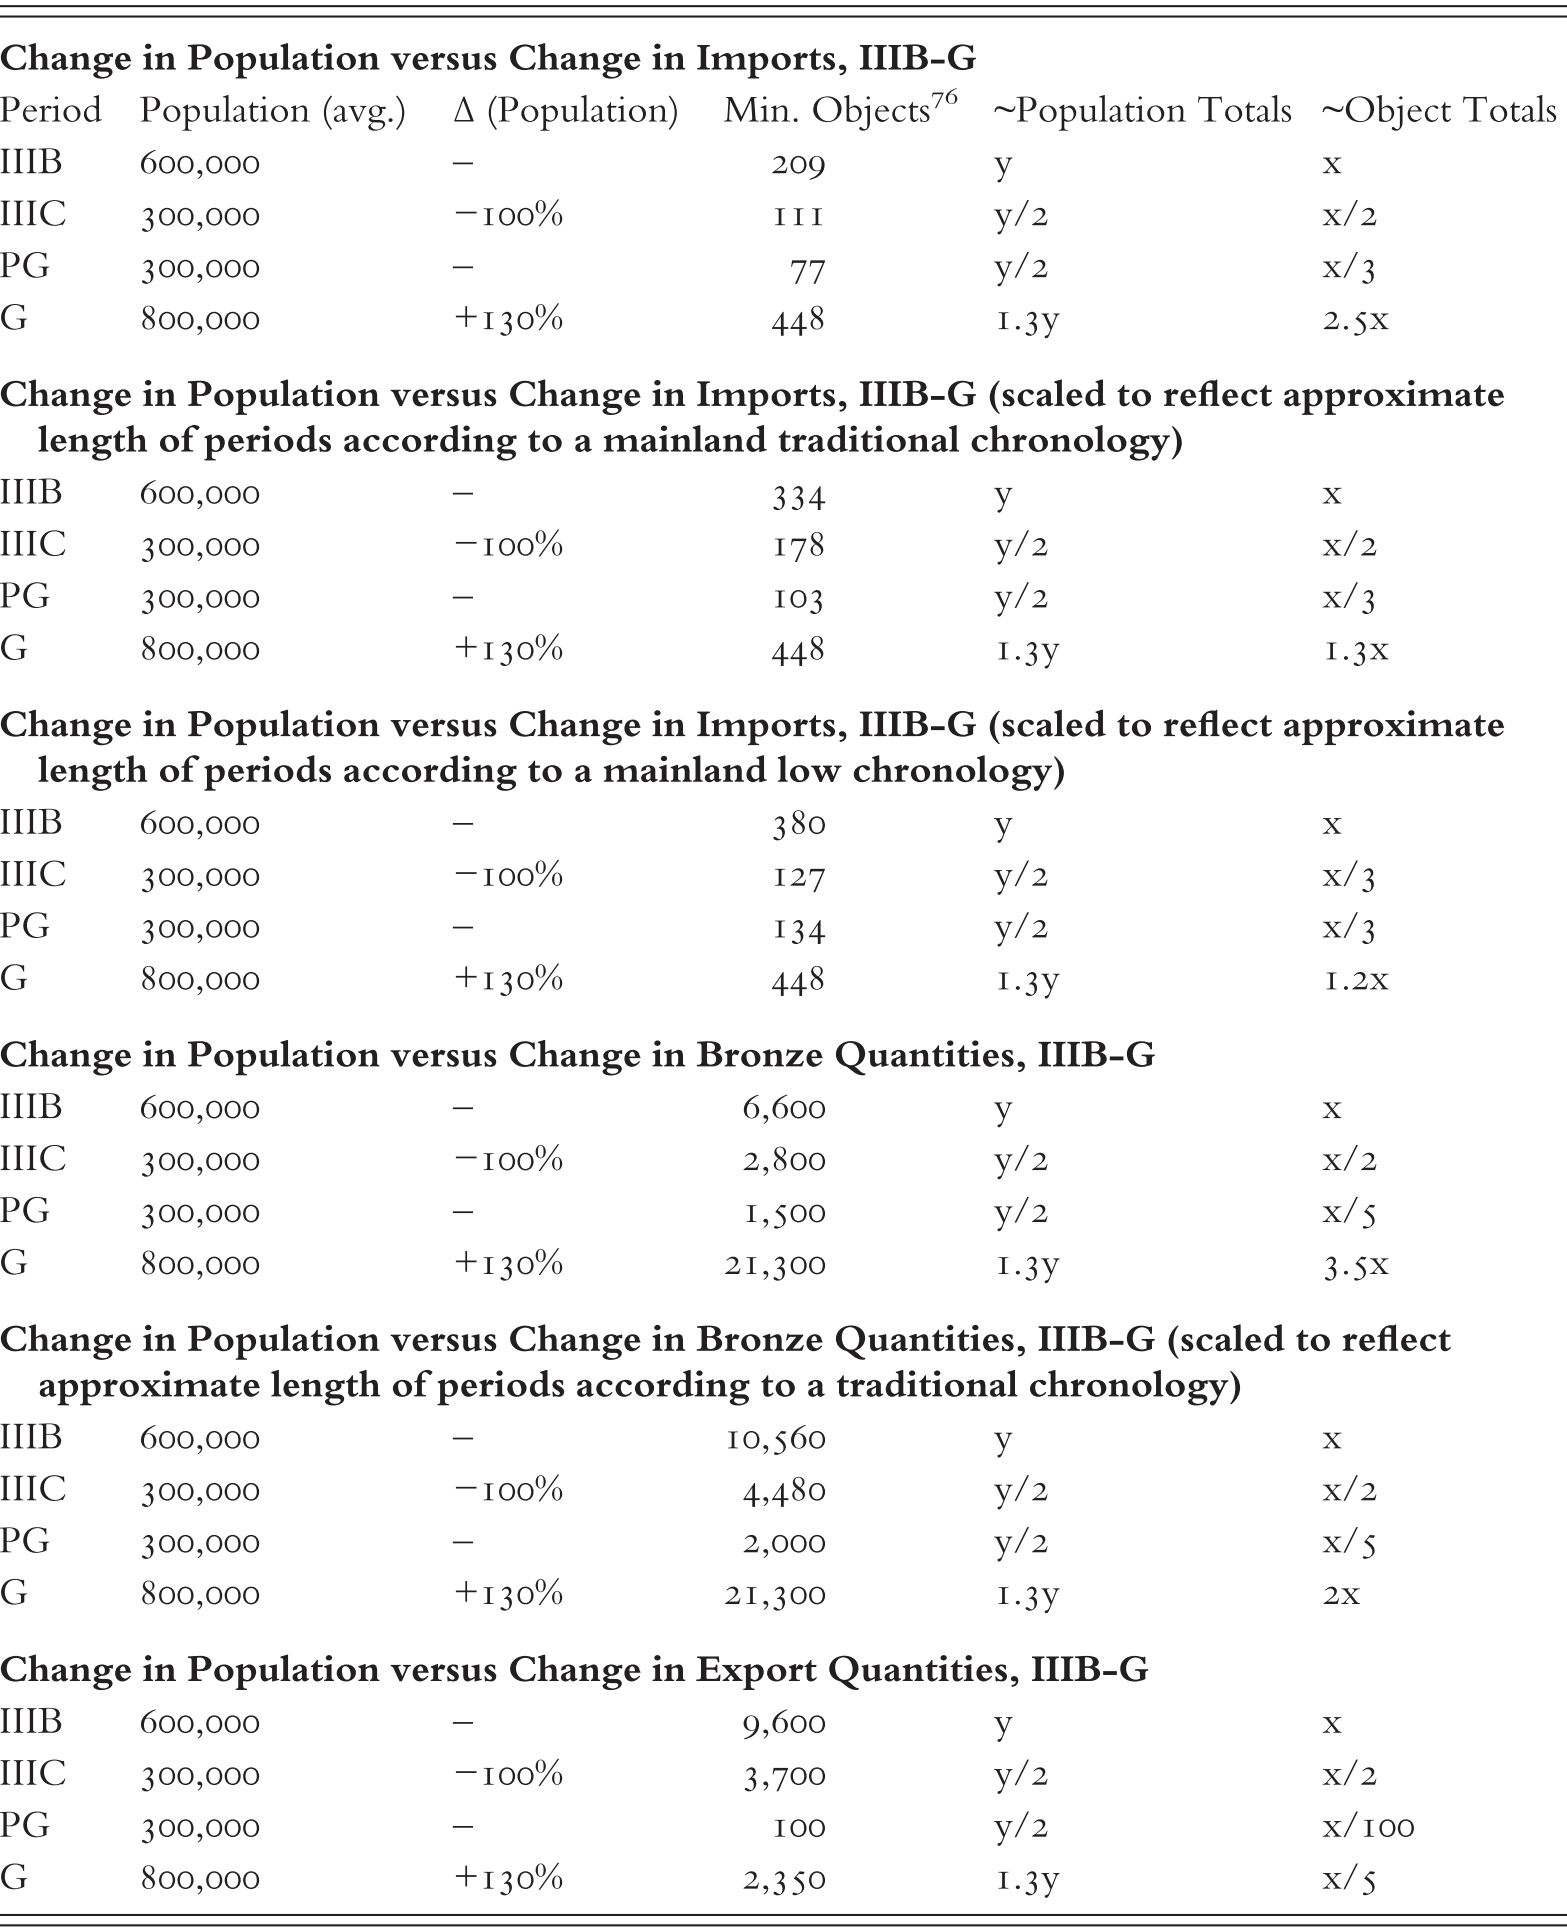
Table 5.3 Change in population vs. change in various categories of material evidence
| Change in Population versus Change in Imports, IIIB-G | |||||
| Period | Population (avg.) | ∆ (Population) | Min. ObjectsFootnote 76 | ~Population Totals | ~Object Totals |
| IIIB | 600,000 | – | 209 | y | x |
| IIIC | 300,000 | −100% | 111 | y/2 | x/2 |
| PG | 300,000 | – | 77 | y/2 | x/3 |
| G | 800,000 | +130% | 448 | 1.3y | 2.5x |
| Change in Population versus Change in Imports, IIIB-G (scaled to reflect approximate length of periods according to a mainland traditional chronology) | |||||
| IIIB | 600,000 | – | 334 | y | x |
| IIIC | 300,000 | −100% | 178 | y/2 | x/2 |
| PG | 300,000 | – | 103 | y/2 | x/3 |
| G | 800,000 | +130% | 448 | 1.3y | 1.3x |
| Change in Population versus Change in Imports, IIIB-G (scaled to reflect approximate length of periods according to a mainland low chronology) | |||||
| IIIB | 600,000 | – | 380 | y | x |
| IIIC | 300,000 | −100% | 127 | y/2 | x/3 |
| PG | 300,000 | – | 134 | y/2 | x/3 |
| G | 800,000 | +130% | 448 | 1.3y | 1.2x |
| Change in Population versus Change in Bronze Quantities, IIIB-G | |||||
| IIIB | 600,000 | – | 6,600 | y | x |
| IIIC | 300,000 | −100% | 2,800 | y/2 | x/2 |
| PG | 300,000 | – | 1,500 | y/2 | x/5 |
| G | 800,000 | +130% | 21,300 | 1.3y | 3.5x |
| Change in Population versus Change in Bronze Quantities, IIIB-G (scaled to reflect approximate length of periods according to a traditional chronology) | |||||
| IIIB | 600,000 | – | 10,560 | y | x |
| IIIC | 300,000 | −100% | 4,480 | y/2 | x/2 |
| PG | 300,000 | – | 2,000 | y/2 | x/5 |
| G | 800,000 | +130% | 21,300 | 1.3y | 2x |
| Change in Population versus Change in Export Quantities, IIIB-G | |||||
| IIIB | 600,000 | – | 9,600 | y | x |
| IIIC | 300,000 | −100% | 3,700 | y/2 | x/2 |
| PG | 300,000 | – | 100 | y/2 | x/100 |
| G | 800,000 | +130% | 2,350 | 1.3y | x/5 |
There is variation in the patterns, depending (as usual) on preferred chronological breakdown of the period between 1300 and 700 BCE. But, an overall decline in import and bronze deposition after the end of the IIIB period, commensurate with the decline in population, is clear. Imports continue to track population size, roughly, in the PG period and increase only during the general period of growth that accompanied the LPG and the Geometric periods. It is not surprising that smaller populations of human beings, and smaller numbers of sites overall, would produce smaller quantities of material. The notion that quantities of particular categories of material evidence are a direct reflection of population size is, however, not necessarily borne out by our additional categories of evidence. The number of bronzes deposited from period to period, for instance, while still supporting a notional decline of deposition rates in tandem with a shrinking population after 1200 BCE, shows unexpectedly low numbers of bronzes for the PG period, and unexpectedly high numbers for the Geometric period. We can think of some ways to account for this given our knowledge of social practice during the PG and G periods. The unexpectedly low number of bronzes from the PG period might be accounted for by the decreasing popularity of this metal as a signifier of social class amongst EIA Greeks, and the unexpectedly high number of bronzes from the Geometric period as a reflection of a new habit of purposeful deposition of tiny bronze figurines in sanctuaries, where they are likely to make their way into the archaeological record. Nonetheless, within a margin of error, both the import evidence and the bronze evidence suggest we might be able to align quantitative change in trade volume directly with population growth and decline.
Taking into account the export evidence complicates matters and leads us to fresh questions about quantities in the archaeological record (as if the reader will not have had enough of these by now!). The relationship between LB IIIB exports and LB IIIC exports does support an alignment between gross quantitative change and population (the number of bronzes declines by about half after the IIIB period) but things in the EIA look difficult to align with population in any meaningful way. The number of known exports from the PG period is vanishingly tiny, and clearly does not track overall population decline. The data for the Geometric period is perhaps most surprising. Based on all other indicators, if quantitative evidence tracked perfectly with the overall scale of the economy, we would expect export quantities from the G period to be far higher. During the eighth century, when we have so much evidence for a booming population and import economy, Greek exports are surprisingly uncommon abroad.
How we interpret this evidence will depend upon how we choose to conceptualize the complex relationship between demography and trade economies. How should we imagine demography and trade interacting? The argument that fluctuation in domestic demand best explains the archaeological record finds a great deal of support from both logical and empirical perspectives, and so while there are other ways that we could proceed, I will focus on the possible implication of low population levels for the scale of a trade economy. In order to participate in a long-distance trade economy, any hypothetical community must not only have access to trade networks, but also the means to acquire goods that circulate via those trade networks. Greece during all phases of the LBA and EIA had access to trade networks – imported objects do turn up in Greece in numbers commensurate with the small population of the period and metals made of imported materials do too.
But is it likely that the small population of Protogeometric Greece was well positioned to participate actively in these long-distance trade networks? To answer this question, we must take into account the broader economic framework within which trade operates. Any economic system contains a number of different parts, often conceptualized as elements of three different subsystems: production, circulation, and consumption. In order to participate in an exchange economy, a community ought to be producing goods or materials of some kind in surplus in order to exchange for incoming objects or materials. The larger the size of a population, the greater the quantity of human capital available to produce fungible materials such as agricultural surplus and value-added goods that could be fed into an active exchange economy. Thus, we might expect that in the aggregate, periods of peak demography would naturally encompass times of increased exchange volume.
Does this necessarily mean that there is a linear relationship between scalar change in trade and scalar change in population? As the evidence shows, this is not the case. Demographic change is likely to be accompanied by complex transformations in social and economic structure, as changing ratios of capital and labor, for instance, alter the basic calculations of everyday life.Footnote 77 Likewise, the disintegration of complex societies, which in the Greek LBA example was apparently accompanied by demographic decline, will also change a variety of the underlying factors determining the quality of trade systems: the peer-polity relationships between trading partners, the organizational stability underpinning reliably revisitable ports, the incentives/coercive forces compelling specialized artisans to continue production, peaceful conditions encouraging trust-based relationships among trading partners, and so forth. Given all of the complex factors playing into the shaping of economies, and trade economies in particular, we cannot necessarily pin down the exact relationship between population and scalar change in trade during this period.
However, we can get some glimpses of the transformations within the overall domestic Greek economy from the LBA-EIA transition. It is apparent from the domestic evidence for production and the evidence of the exports that the Mycenaean system for transforming agricultural goods into value-added products like perfumed oil at scale was key in enabling their participation in a long-distance economy. To maintain this kind of system, the Mycenaeans apparently depended to some degree on attached labor and slaves,Footnote 78 part of a heterogeneous division of work whereby the population was divided into many categories along a chain of production that was geographically and socially dispersed.Footnote 79 This economic structure had many moving parts that enabled Mycenaean states to muster considerable capital and acquire exogenous materials like bronze, glass, ivory, and gold in quantity. The archaeological evidence from the IIIB period contains large-scale production facilities, and other intimations of labor concentration and organization that support this view.Footnote 80
Though the evidence is limited, the overall picture of the domestic economy after the end of the IIIB period is overwhelmingly one of considerable change on all possible axes. There is no evidence that production of luxury goods continued after the fall of the palaces, and industries for the production of more common products (textiles, ceramics, bronze) were simplified and probably were not produced for the purpose of exchange.Footnote 81 There is little in the material record (with the possible exception of industrial activity in the lower citadel at IIIC Tiryns)Footnote 82 to show that attached labor was common after the collapse of palatial administration, although in the absence of texts, this might be difficult to assess. The archaeological evidence is clearer when it comes to the organization of craft activities. Nucleated production appears to have been commonplace in IIIB, when many sites did not produce their own pottery or textiles, indicating that production was not fully dispersed. On the other hand, the archaeological record for the IIIC period features a greater deal of homogeneity.Footnote 83 More excavated sites have some evidence of small-scale craft or agricultural production. Like evidence for production, the import corpus and the known bronzes from the IIIC period are more evenly dispersed throughout Greece than they were in the IIIB period.Footnote 84
All of this appears to underscore a major change in the organization of both production and trade after the end of the palatial economies, involving the relatively “neat decomposition” of a complex society from a confederate, formal state into its constituent parts, each comprising an independent and largely self-sufficient unit.Footnote 85 small communities producing small quantities of capital each had an equal share in a fragmented world of long-distance trade: Achaea was still actively connected as a producer and consumer of finished goods with the west/Italy, Attica continued contacts of some kind with the east (perhaps thanks to mineral resources), and Crete was engaged with both at once. I will consider the possible mechanisms for these contacts in the next chapter. Regardless of how IIIC exchanges took place, the patterns of production and consumption are both evocative of a smaller, less-unified economic system, exactly what we would expect to see during a period of severe depopulation.Footnote 86
The scale and degree of concentration of craft production remained limited during the twelfth to ninth centuries, and we do not see much change in the evidence for domestic economies between the IIIC and PG periods; in both periods there are signs of household production at an unusually large percentage of sites, but few apparent industrial facilities at scales comparable to those known from the IIIB period.Footnote 87 Given the demographic stagnation across this transition, we might not be surprised by the lack of development in apparent economic complexity between 1150 and 1050. While the domestic scene does not present clear differences, the quantity of exports known from the PG period is far lower than from the IIIC period, suggesting more economic dynamism between IIIC and PG than an initial survey of the evidence reveals. We could account for this dynamism in a few ways. First, it is now widely believed that the IIIC period was a time of uncontrolled migration, and that post-Mycenaean Greeks moved abroad in large numbers during the early twelfth century, taking with them their ceramic traditions.Footnote 88 The quantitative evidence for exports from IIIC might therefore not represent a system of production geared up for export, but rather a movement of individuals. In this case, the “export data” for this period might be a combination of actually-exported and “export-imitating” domestically-produced wares, as is almost certainly the case from IIIB/C Italy and the Philistine territories. So, exports in the IIIC period may not all be representative surrogates of two-way long-distance exchange. On the other hand, the number of PG imports is unexpectedly low, and so even a dramatic adjustment of the IIIC numbers that took into account the movement of people in the twelfth century would probably not bring PG and IIIC export quantities into alignment. Since almost all exports from all of early Greek history consist of pottery, we must assume that PG ceramics were not being exported, either for their own value or the value of contents, in the same quantities as IIIC ceramics or IIIB ones.
A substantive change in economic institutions is a likely explanation for this. A possibility we may consider is that Greeks were exporting something other than ceramics or goods contained in ceramics during the PG period. Given the low apparent population levels, and the large labor inputs required to create agricultural surplus in a harsh Mediterranean environment, bulk agricultural goods like olive oil or wheat are not a likely candidate. A small population of herders with large stock holdings (as the Homeric poems suggest might have existed in early Greece) could notionally have made a reputation as exporters of animal products, value-added goods like textiles made from animal products, or even of animals themselves.Footnote 89 We know from fictional episodes like the shipment of a hecatomb of cattle to Chryse in book one of the Iliad that moving large herds of animals around for exchange was possible, though it would be hard to track this archaeologically.Footnote 90 Given biblical evidence that purportedly refers to contemporary trade in the Near East, we might also consider the notion that the purchase and sale of human labor accounts for some of the Greek wealth in the tenth through eighth centuries.Footnote 91 Finally, the idea that “early adopters” of iron production were profiting from trade in ores or finished metal products in the Protogeometric period is attractive, and will be discussed further in Chapter 6.
Whatever structural changes in the economy we want to tentatively reconstruct to explain the low number of exports compared to all other economic indicators from the PG and Geometric periods, it is relatively clear that the productive economy was simpler, and structured differently, across the board in the Protogeometric and Geometric periods than it was in the Late Bronze Age. Some indication of the decrease in economic complexity after the end of the palatial period may be provided by the fact that the number of occupational names and titles in the Homeric texts is a small sample of the extensive repertoire preserved in the Linear B documents. While Morpurgo-Davies counts different specialized occupations in Linear B, only 40 seem to have continued on to Homeric times.Footnote 92 Kerameus and chalkeis survived, but words for workers such as shipbuilders, wheelwrights, and unguent boilers fell out of the language. Presumably, this shrinking of the lexical range of artisanal categorization reflects a narrowing of economic range. Though the loss of lexical range does not necessarily imply the loss of some professions,Footnote 93 the implication could likely be that the organization of craft production shifted toward a more modest range of goods produced by a less specialized body of craftspeople.Footnote 94 Thus, we can probably conclude that “the craft sphere was [simple] compared to the Bronze Age.”Footnote 95
I suggest that all of this evidence is consistent with a scenario of Early Iron Age economy in which a small local population, organized according to relatively uncomplicated oikos-centered institutions was unlikely to have been able to manufacture goods or commodities on the same scale of production or level of artisanal sophistication as a large and complex, organized population, and therefore did not participate in long-distance exchange networks in gross quantitative measure with the Mycenaean polities of the LBA. However, it is also true that trade probably continued through the demographic decline in a measure appropriate to the new demographic realities. In this light, we should not be surprised that the scale of trade in the aggregate did decline after the end of the LBA. Does this imply that population size has a determinant impact on the nature of economic structures? Not necessarily; it is interesting to see, for example, that when the economy and population began to recover in the ninth and especially eighth centuries, the prevailing model of long-distance interaction did not revert suddenly back to an LBA one in straightforward ways. In the Geometric period, craft production shows some signs of development, but not in the way that a study of LBA crafts would push us to anticipate. While there are a few indications of the production of luxury goods attached to some social eliteFootnote 96 and of ceramic production in worksites like the Athenian AgoraFootnote 97 the sort of large manufacturing installations apparent in the archaeological record from the IIIB period have not yet come to light from the Geometric period (though by the Archaic period the picture changes dramatically). The primary evidence for Geometric production does not come from ceramic workshops, or installations for the production of fancy luxury goods attached to elite settlements, but rather from evidence of the production of bronze or iron artifacts at sanctuaries.Footnote 98 There are many implications of this phenomenon, but for the purposes of distinguishing change in the archaeological record of the domestic economy the main point is that overlap with the context of the productive economy with earlier periods is not immediately obvious.
5.3. Conclusion
In this chapter I have considered the relationship between aggregate and per capita change in the data for long-distance trade from early Greece. While there is a relatively steep drop in the aggregate number of imported objects in Greece after the thirteenth century, and a rise again in the Geometric period, controlling this for population decline and growth makes fluctuation in the quantitative evidence look like less of a phenomenon of its own significance, and more like the natural outcome of population decline and growth. That is to say, if we take demographic change into account, it looks like patterns in the remaining number of known material categories of evidence for long-distance exchange correlate relatively closely with demography. The data show that figures of imports per capita remain steady (within a margin of error, at a low level) over time. Considering all of the evidence suggests that it was the population rather than the intensity of Greeks’ interactions with the rest of the Mediterranean that declined between 1200 and 900 BCE. I therefore reject the notion that regular long-distant contact was absent or even much-diminished at any juncture of early Greek history, even when people living in Greece were materially at their poorest. At the same time, adding in the evidence of exports muddies the picture, and makes the formulation of a direct, linear relationship between the size of the population, the organization of the economy, and the nature of long-distance exchange difficult to sustain. Notwithstanding the fact that the interplay of imports, trade, society, and economy in Early Greece was highly complex and remains poorly understood, there are clear signs of demographic changes across this period that must have had far-reaching impacts on the economy, and may explain at least some of the aggregate quantitative change we observe in the archaeological record.